Financial Information
Shareholder Return Performance Graph — Unaudited
The following graph compares the performance of the Company’s Class A Common Stock from December 28, 2007 to December 28, 2012 (the end of our 2007 and 2012 fiscal years) with the performance of the Standard & Poor’s Corporation Composite 500 Index and the Standard & Poor’s Hotels, Resorts & Cruise Lines Index. The graph assumes an initial investment of $100 on December 28, 2007, and reinvestment of dividends. As discussed in more detail in Footnote No. 16, “Spin-off” of the Notes to our Financial Statements in this report, on November 21, 2011 we completed a spin-off of our timeshare operations and timeshare development business through a special tax-free dividend to our shareholders of all of the issued and outstanding common stock of our then wholly owned subsidiary Marriott Vacations Worldwide Corporation (“MVW”). From the spin-off date, Marriott no longer beneficially owned any shares of MVW common stock. In conjunction with the spin-off, our shareholders received one share of MVW common stock for every ten shares of our common stock that were held on the record date. We reflect the effect of the spin-off in the cumulative total return of our common stock as a reinvested dividend.
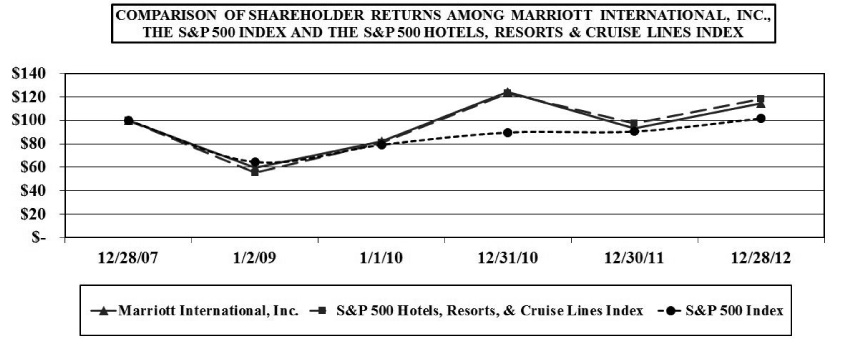
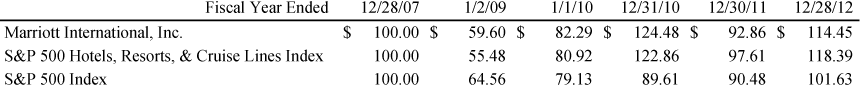
NOTE: Throughout the period shown in this chart, the S&P 500 Hotels, Resorts & Cruise Lines Index consisted of Carnival Corporation, Starwood Hotels & Resorts Worldwide Inc., the Company, and Wyndham Worldwide Corporation.