Financial Highlights IN MILLIONS, EXCEPT PER SHARE DATA; YEARS ENDED DECEMBER 31

INCOME STATEMENT
20092008
Net interest income
Provision for loan losses
Net income
Preferred stock dividends
Net income (loss) attributable to common shares
Provision for loan losses
Net income
Preferred stock dividends
Net income (loss) attributable to common shares
$ 1,567
1,082
17
134
(118)
1,082
17
134
(118)
$ 1,815
686
213
17
192
686
213
17
192
PER SHARE OF COMMON STOCK
Diluted net income (loss)
Cash dividends declared
Common shareholders' equity
Market value
Average common shares outstanding – diluted
Cash dividends declared
Common shareholders' equity
Market value
Average common shares outstanding – diluted
(0.79)
0.20
31.82
29.57
149
0.20
31.82
29.57
149
1.28
2.31
33.31
19.85
149
2.31
33.31
19.85
149
RATIOS
Return on average assets
Return on average common shareholders' equity
Tier 1 common capital as a percentage of risk-weighted assets*
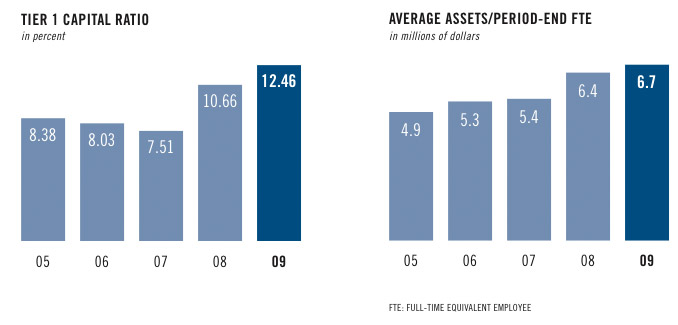
Tier 1 capital as a percentage of risk-weighted assets
Total capital as a percentage of risk-weighted assets
Tangible common equity as a percentage of tangible assets*
Return on average common shareholders' equity
Tier 1 common capital as a percentage of risk-weighted assets*
Tier 1 capital as a percentage of risk-weighted assets
Total capital as a percentage of risk-weighted assets
Tangible common equity as a percentage of tangible assets*
0.03%
(2.37)
8.18
12.46
16.93
7.99
(2.37)
8.18
12.46
16.93
7.99
0.33%
3.79
7.08
10.66
14.72
7.21
3.79
7.08
10.66
14.72
7.21
BALANCE SHEET (at December 31)
Total assets
Total earning assets
Total loans
Total deposits
Total preferred equity
Total shareholders’ equity
Total earning assets
Total loans
Total deposits
Total preferred equity
Total shareholders’ equity
$ 59,249
54,558
42,161
39,665
2,151
7,029
54,558
42,161
39,665
2,151
7,029
$ 67,548
62,374
50,505
41,955
2,129
7,152
62,374
50,505
41,955
2,129
7,152

* See Supplemental Financial Data section for reconcilements of non-GAAP financial measures.