UNITED STATES
SECURITIES AND EXCHANGE COMMISSION
Washington, D.C. 20549
FORM 10-K
Annual Report Pursuant to Section 13 or 15(d) of the
Securities Exchange Act of 1934
For the fiscal year ended
December 31, 2015
Commission file number 1-10706
COMERICA INCORPORATED
(Exact Name of Registrant as Specified in Its Charter)
|
| | |
| Delaware | | 38-1998421 |
| (State or Other Jurisdiction of Incorporation) | | (IRS Employer Identification Number) |
Comerica Bank Tower
1717 Main Street, MC 6404
Dallas, Texas 75201
(Address of Principal Executive Offices) (Zip Code)
(214) 462-6831
(Registrant's Telephone Number, Including Area Code)
Securities registered pursuant to Section 12(b) of
the Exchange Act:
・ Common Stock, $5 par value
・ Warrants to Purchase Common Stock (expiring November 14, 2018)
These securities are registered on the New York Stock Exchange.
Securities registered pursuant to Section 12(g) of the
Exchange Act:
・ Warrants to Purchase Common Stock (expiring December 12, 2018)
Indicate by check mark if the registrant is a well-known seasoned issuer, as defined in Rule 405 of the Securities Act. Yes ý No o
Indicate by check mark if registrant is not required to file reports pursuant to Section 13 or Section 15(d) of the Act. Yes o No ý
Indicate by check mark whether the registrant (1) has filed all reports required to be filed by Section 13 or 15(d) of the Securities Exchange Act of 1934 during the preceding 12 months (or for such shorter period that the registrant was required to file such reports), and (2) has been subject to such filing requirements for the past 90 days. Yes ý No o
Indicate by check mark whether the registrant has submitted electronically and posted on its corporate Web site, if any, every Interactive Data File required to be submitted and posted pursuant to Rule 405 of Regulation S-T (§ 232.405 of this chapter) during the preceding 12 months (or for such shorter period that the registrant was required to submit and post such files). Yes ý No o
Indicate by check mark if disclosure of delinquent filers pursuant to Item 405 of Regulation S-K (§229.405) is not contained herein, and will not be contained, to the best of registrant's knowledge, in definitive proxy or information statements incorporated by reference in Part III of this Form 10-K or any amendment to this Form 10-K. o
Indicate by check mark whether the registrant is a large accelerated filer, an accelerated filer, a non-accelerated filer, or a smaller reporting company. See the definitions of "large accelerated filer," "accelerated filer" and "smaller reporting company" in Rule 12b-2 of the Exchange Act.
|
| | | | | | |
| Large accelerated filer ý | | Accelerated filer o | | Non-accelerated filer o (Do not check if a smaller reporting company) | | Smaller reporting company o |
Indicate by check mark whether the registrant is a shell company (as defined in Rule 12b-2 of the Exchange Act). Yes o No ý
At June 30, 2015 (the last business day of the registrant's most recently completed second fiscal quarter), the registrant's common stock, $5 par value, held by non-affiliates had an aggregate market value of approximately $9.0 billion based on the closing price on the New York Stock Exchange on that date of $51.32 per share. For purposes of this Form 10-K only, it has been assumed that all common shares Comerica's Trust Department holds for Comerica's employee plans, and all common shares the registrant's directors and executive officers hold, are shares held by affiliates.
At February 19, 2016, the registrant had outstanding 174,878,064 shares of its common stock, $5 par value.
Documents Incorporated by Reference:
Part III:
Items 10-14—Proxy Statement for the Annual Meeting of Shareholders to be held April 26, 2016.
TABLE OF CONTENTS
PART I
Item 1. Business.
GENERAL
Comerica Incorporated ("Comerica") is a financial services company, incorporated under the laws of the State of Delaware, and headquartered in Dallas, Texas. Based on total assets as reported in the most recently filed Consolidated Financial Statements for Bank Holding Companies (FR Y-9C), it was among the 25 largest commercial United States ("U.S.") financial holding companies. Comerica was formed in 1973 to acquire the outstanding common stock of Comerica Bank, which at such time was a Michigan banking corporation and one of Michigan's oldest banks (formerly Comerica Bank-Detroit). On October 31, 2007, Comerica Bank, a Michigan banking corporation, was merged with and into Comerica Bank, a Texas banking association ("Comerica Bank"). As of December 31, 2015, Comerica owned directly or indirectly all the outstanding common stock of 2 active banking and 36 non-banking subsidiaries. At December 31, 2015, Comerica had total assets of approximately $71.9 billion, total deposits of approximately $59.9 billion, total loans (net of unearned income) of approximately $49.1 billion and shareholders' equity of approximately $7.6 billion.
Business Segments
Comerica has strategically aligned its operations into three major business segments: the Business Bank, the Retail Bank, and Wealth Management. In addition to the three major business segments, Finance is also reported as a segment. We provide information about our business segments and the principal products and services provided by these segments in Note 22 on pages F-103 through F-107 of the Notes to Consolidated Financial Statements located in the Financial Section of this report.
Comerica operates in three primary geographic markets - Texas, California, and Michigan, as well as in Arizona and Florida, with select businesses operating in several other states, and in Canada and Mexico. We provide information about our market segments in Note 22 on pages F-103 through F-107 of the Notes to Consolidated Financial Statements located in the Financial Section of this report.
Activities with customers domiciled outside the U.S., in total or with any individual country, are not significant. We provide information on risks attendant to foreign operations: (1) under the caption "Concentration of Credit Risk" on page F-30 of the Financial Section of this report; and (2) under the caption "International Exposure" on page F-33 of the Financial Section of this report.
We provide information about the net interest income and noninterest income we received from our various classes of products and services: (1) under the caption, "Analysis of Net Interest Income-Fully Taxable Equivalent (FTE)" on page F-6 of the Financial Section of this report; (2) under the caption "Net Interest Income" on pages F-7 through F-8 of the Financial Section of this report; and (3) under the caption "Noninterest Income" on pages F-8 through F-9 of the Financial Section of this report.
Acquisition of Sterling Bancshares, Inc.
On July 28, 2011, Comerica acquired all the outstanding common stock of Sterling Bancshares, Inc. ("Sterling"), a bank holding company headquartered in Houston, Texas, in a stock-for-stock transaction. Sterling common shareholders and holders of outstanding Sterling phantom stock units received 0.2365 shares of Comerica's common stock in exchange for each share of Sterling common stock or phantom stock unit. As a result, Comerica issued approximately 24 million common shares with an acquisition date fair value of $793 million, based on Comerica's closing stock price of $32.67 on July 27, 2011. Based on the merger agreement, outstanding and unexercised options to purchase Sterling common stock were converted into fully vested options to purchase common stock of Comerica. In addition, outstanding warrants to purchase Sterling common stock were converted into warrants to purchase common stock of Comerica. Including an insignificant amount of cash paid in lieu of fractional shares, the fair value of total consideration paid was $803 million. The acquisition of Sterling significantly expanded Comerica's presence in Texas, particularly in the Houston and San Antonio areas.
COMPETITION
The financial services business is highly competitive. Comerica and its subsidiaries mainly compete in their three primary geographic markets of Texas, California and Michigan, as well as in the states of Arizona and Florida. They also compete in broader, national geographic markets, as well as markets in Mexico and Canada. They are subject to competition with respect to various products and services, including, without limitation, loans and lines of credit, deposits, cash management, capital market products, international trade finance, letters of credit, foreign exchange management services, loan syndication services, consumer lending, consumer deposit gathering, mortgage loan origination, consumer products, fiduciary services, private banking, retirement services, investment management and advisory services, investment banking services, brokerage services, the sale of annuity products, and the sale of life, disability and long-term care insurance products.
Comerica competes in terms of products and pricing with large national and regional financial institutions and with smaller financial institutions. Some of Comerica's larger competitors, including certain nationwide banks that have a significant
presence in Comerica's market area, may make available to their customers a broader array of product, pricing and structure alternatives and, due to their asset size, may more easily absorb credit losses in a larger overall portfolio. Some of Comerica's competitors (larger or smaller) may have more liberal lending policies and processes. Further, Comerica's banking competitors may be subject to a significantly different or reduced degree of regulation due to their asset size or types of products offered. They may also have the ability to more efficiently utilize resources to comply with regulations or may be able to more effectively absorb the costs of regulations into their existing cost structure. Comerica believes that the level of competition in all geographic markets will continue to increase in the future.
In addition to banks, Comerica's banking subsidiaries also face competition from other financial intermediaries, including savings and loan associations, consumer finance companies, leasing companies, venture capital funds, credit unions, investment banks, insurance companies and securities firms. Competition among providers of financial products and services continues to increase, with consumers having the opportunity to select from a growing variety of traditional and nontraditional alternatives. The ability of non-banking financial institutions to provide services previously limited to commercial banks has intensified competition. Because non-banking financial institutions are not subject to many of the same regulatory restrictions as banks and bank holding companies, they can often operate with greater flexibility and lower cost structures.
In addition, the industry continues to consolidate, which affects competition by eliminating some regional and local institutions, while strengthening the franchises of acquirers.
SUPERVISION AND REGULATION
Banks, bank holding companies, and financial institutions are highly regulated at both the state and federal level. Comerica is subject to supervision and regulation at the federal level by the Board of Governors of the Federal Reserve System ("FRB") under the Bank Holding Company Act of 1956, as amended. The Gramm-Leach-Bliley Act expanded the activities in which a bank holding company registered as a financial holding company can engage. The conditions to be a financial holding company include, among others, the requirement that each depository institution subsidiary of the holding company be well capitalized and well managed. Effective July 2011, the Dodd-Frank Wall Street Reform and Consumer Protection Act (the "Dodd-Frank Act") also requires the well capitalized and well managed standards to be met at the financial holding company level. Comerica became a financial holding company in 2000. As a financial holding company, Comerica may affiliate with securities firms and insurance companies, and engage in activities that are financial in nature. Activities that are "financial in nature" include, but are not limited to: securities underwriting; securities dealing and market making; sponsoring mutual funds and investment companies (subject to regulatory requirements, including restrictions set forth in the Volcker Rule, described under the heading "The Dodd-Frank Wall Street Reform and Consumer Protection Act and Other Recent Legislative and Regulatory Developments" below); insurance underwriting and agency; merchant banking; and activities that the FRB has determined to be financial in nature or incidental or complementary to a financial activity, provided that it does not pose a substantial risk to the safety or soundness of the depository institution or the financial system generally. A bank holding company that is not also a financial holding company is limited to engaging in banking and other activities previously determined by the FRB to be closely related to banking.
Comerica Bank is chartered by the State of Texas and at the state level is supervised and regulated by the Texas Department of Banking under the Texas Finance Code. Comerica Bank has elected to be a member of the Federal Reserve System under the Federal Reserve Act and, consequently, is supervised and regulated by the Federal Reserve Bank of Dallas. Comerica Bank & Trust, National Association is chartered under federal law and is subject to supervision and regulation by the Office of the Comptroller of the Currency ("OCC") under the National Bank Act. Comerica Bank & Trust, National Association, by virtue of being a national bank, is also a member of the Federal Reserve System. The deposits of Comerica Bank and Comerica Bank & Trust, National Association are insured by the Deposit Insurance Fund of the Federal Deposit Insurance Corporation ("FDIC") to the extent provided by law. Certain transactions executed by Comerica Bank are also subject to regulation by the U.S. Commodity Futures Trading Commission. In Canada, Comerica Bank is supervised by the Office of the Superintendent of Financial Institutions and in Mexico, by the Banco de México.
The FRB supervises non-banking activities conducted by companies directly and indirectly owned by Comerica. In addition, Comerica's non-banking subsidiaries are subject to supervision and regulation by various state, federal and self-regulatory agencies, including, but not limited to, the Financial Industry Regulatory Authority (in the case of Comerica Securities, Inc.), the Office of Financial and Insurance Regulation of the State of Michigan (in the case of Comerica Securities, Inc. and Comerica Insurance Services, Inc.), and the Securities and Exchange Commission ("SEC") (in the case of Comerica Securities, Inc. and World Asset Management, Inc.).
Described below are material elements of selected laws and regulations applicable to Comerica and its subsidiaries. The descriptions are not intended to be complete and are qualified in their entirety by reference to the full text of the statutes and regulations described. Changes in applicable law or regulation, and in their application by regulatory agencies, cannot be predicted, but they may have a material effect on the business of Comerica and its subsidiaries.
Requirements for Approval of Acquisitions and Activities
In most cases, no FRB approval is required for Comerica to acquire a company engaged in activities that are financial in nature or incidental to activities that are financial in nature, as determined by the FRB. However, Federal and state laws impose notice and approval requirements for mergers and acquisitions of other depository institutions or bank holding companies. Prior approval is required before Comerica may acquire the beneficial ownership or control of more than 5% of the voting shares or substantially all of the assets of a bank holding company (including a financial holding company) or a bank.
The Community Reinvestment Act of 1977 ("CRA") requires U.S. banks to help serve the credit needs of their communities. Comerica Bank's current rating under the "CRA" is "satisfactory". If any subsidiary bank of Comerica were to receive a rating under the CRA of less than "satisfactory," Comerica would be prohibited from engaging in certain activities.
In addition, Comerica, Comerica Bank and Comerica Bank & Trust, National Association, are each "well capitalized" and "well managed" under FRB standards. If any subsidiary bank of Comerica were to cease being "well capitalized" or "well managed" under applicable regulatory standards, the FRB could place limitations on Comerica's ability to conduct the broader financial activities permissible for financial holding companies or impose limitations or conditions on the conduct or activities of Comerica or its affiliates. If the deficiencies persisted, the FRB could order Comerica to divest any subsidiary bank or to cease engaging in any activities permissible for financial holding companies that are not permissible for bank holding companies, or Comerica could elect to conform its non-banking activities to those permissible for a bank holding company that is not also a financial holding company.
Further, the effectiveness of Comerica and its subsidiaries in complying with anti-money laundering regulations (discussed below) is also taken into account by the FRB when considering applications for approval of acquisitions.
Transactions with Affiliates
Various governmental requirements, including Sections 23A and 23B of the Federal Reserve Act and the FRB's Regulation W, limit borrowings by Comerica and its nonbank subsidiaries from its affiliate insured depository institutions, and also limit various other transactions between Comerica and its nonbank subsidiaries, on the one hand, and Comerica's affiliate insured depository institutions, on the other. For example, Section 23A of the Federal Reserve Act limits the aggregate outstanding amount of any insured depository institution's loans and other "covered transactions" with any particular nonbank affiliate to no more than 10% of the institution's total capital and limits the aggregate outstanding amount of any insured depository institution's covered transactions with all of its nonbank affiliates to no more than 20% of its total capital. "Covered transactions" are defined by statute to include a loan or extension of credit, as well as a purchase of securities issued by an affiliate, a purchase of assets (unless otherwise exempted by the FRB) from the affiliate, the acceptance of securities issued by the affiliate as collateral for a loan, and the issuance of a guarantee, acceptance or letter of credit on behalf of an affiliate. Section 23A of the Federal Reserve Act also generally requires that an insured depository institution's loans to its nonbank affiliates be, at a minimum, 100% secured, and Section 23B of the Federal Reserve Act generally requires that an insured depository institution's transactions with its nonbank affiliates be on terms and under circumstances that are substantially the same or at least as favorable as those prevailing for comparable transactions with nonaffiliates. The Dodd-Frank Act significantly expanded the coverage and scope of the limitations on affiliate transactions within a banking organization. For example, commencing in July 2012, the Dodd-Frank Act applies the 10% of capital limit on covered transactions to financial subsidiaries and amends the definition of "covered transaction" to include (i) securities borrowing or lending transactions with an affiliate, and (ii) all derivatives transactions with an affiliate, to the extent that either causes a bank or its affiliate to have credit exposure to the securities borrowing/lending or derivative counterparty.
Privacy
The privacy provisions of the Gramm-Leach-Bliley Act generally prohibit financial institutions, including Comerica, from disclosing nonpublic personal financial information of consumer customers to third parties for certain purposes (primarily marketing) unless customers have the opportunity to "opt out" of the disclosure. The Fair Credit Reporting Act restricts information sharing among affiliates for marketing purposes.
Anti-Money Laundering Regulations
The Uniting and Strengthening America by Providing Appropriate Tools Required to Intercept and Obstruct Terrorism Act ("USA PATRIOT Act") of 2001 and its implementing regulations substantially broadened the scope of U.S. anti-money laundering laws and regulations by requiring insured depository institutions, broker-dealers, and certain other financial institutions to have policies, procedures, and controls to detect, prevent, and report money laundering and terrorist financing. The USA PATRIOT Act and its regulations also provide for information sharing, subject to conditions, between federal law enforcement agencies and financial institutions, as well as among financial institutions, for counter-terrorism purposes. Federal banking regulators are required, when reviewing bank holding company acquisition and bank merger applications, to take into account the effectiveness of the anti-money laundering activities of the applicants. To comply with these obligations, Comerica and its various operating units have implemented appropriate internal practices, procedures, and controls.
Interstate Banking and Branching
The Interstate Banking and Branching Efficiency Act (the "Interstate Act"), as amended by the Dodd-Frank Act, permits a bank holding company, with FRB approval, to acquire banking institutions located in states other than the bank holding company's home state without regard to whether the transaction is prohibited under state law, but subject to any state requirement that the bank has been organized and operating for a minimum period of time, not to exceed five years, and the requirement that the bank holding company, prior to and following the proposed acquisition, control no more than 10% of the total amount of deposits of insured depository institutions in the U.S. and no more than 30% of such deposits in that state (or such amount as established by state law if such amount is lower than 30%). The Interstate Act, as amended, also authorizes banks to operate branch offices outside their home states by merging with out-of-state banks, purchasing branches in other states and by establishing de novo branches in other states, subject to various conditions. In the case of purchasing branches in a state in which it does not already have banking operations, the "host" state must have "opted-in" to the Interstate Act by enacting a law permitting such branch purchases. The Dodd-Frank Act expanded the de novo interstate branching authority of banks beyond what had been permitted under the Interstate Act by eliminating the requirement that a state expressly "opt-in" to de novo branching, in favor of a rule that de novo interstate branching is permissible if under the law of the state in which the branch is to be located, a state bank chartered by that state would be permitted to establish the branch. Effective July 21, 2011, the Dodd-Frank Act also required that a bank holding company or bank be well capitalized and well managed (rather than simply adequately capitalized and adequately managed) in order to take advantage of these interstate banking and branching provisions.
Comerica has consolidated the majority of its banking business into one bank, Comerica Bank, with branches in Texas, Arizona, California, Florida and Michigan.
Dividends
Comerica is a legal entity separate and distinct from its banking and other subsidiaries. Most of Comerica's revenues result from dividends its bank subsidiaries pay it. There are statutory and regulatory requirements applicable to the payment of dividends by subsidiary banks to Comerica, as well as by Comerica to its shareholders. Certain, but not all, of these requirements are discussed below.
Comerica Bank and Comerica Bank & Trust, National Association are required by federal law to obtain the prior approval of the FRB and/or the OCC, as the case may be, for the declaration and payment of dividends, if the total of all dividends declared by the board of directors of such bank in any calendar year will exceed the total of (i) such bank's retained net income (as defined and interpreted by regulation) for that year plus (ii) the retained net income (as defined and interpreted by regulation) for the preceding two years, less any required transfers to surplus or to fund the retirement of preferred stock. At January 1, 2016, Comerica's subsidiary banks could declare aggregate dividends of approximately $398 million from retained net profits of the preceding two years. Comerica's subsidiary banks declared dividends of $437 million in 2015, $380 million in 2014 and $480 million in 2013.
Further, federal regulatory agencies can prohibit a banking institution or bank holding company from engaging in unsafe and unsound banking practices and could prohibit the payment of dividends under circumstances in which such payment could be deemed an unsafe and unsound banking practice. Under the Federal Deposit Insurance Corporation Improvement Act ("FDICIA"), "prompt corrective action" regime discussed below, which applies to each of Comerica Bank and Comerica Bank & Trust, National Association, a subject bank is specifically prohibited from paying dividends to its parent company if payment would result in the bank becoming "undercapitalized." In addition, Comerica Bank is also subject to limitations under Texas state law regarding the amount of earnings that may be paid out as dividends to its parent company, and requiring prior approval for payments of dividends that exceed certain levels.
Additionally, the payment of dividends by Comerica to its shareholders is subject to the non-objection of the FRB pursuant to the Comprehensive Capital Analysis and Review (CCAR) program. For more information, please see "The Dodd-Frank Wall Street Reform and Consumer Protection Act and Other Recent Legislative and Regulatory Developments" in this section.
Source of Strength and Cross-Guarantee Requirements
Federal law and FRB regulations require that bank holding companies serve as a source of strength to each subsidiary bank and commit resources to support each subsidiary bank. This support may be required at times when a bank holding company may not be able to provide such support without adversely affecting its ability to meet other obligations. Similarly, under the cross-guarantee provisions of the Federal Deposit Insurance Act, in the event of a loss suffered or anticipated by the FDIC (either as a result of the failure of a banking subsidiary or related to FDIC assistance provided to such a subsidiary in danger of failure), the other banking subsidiaries may be assessed for the FDIC's loss, subject to certain exceptions.
Federal Deposit Insurance Corporation Improvement Act
FDICIA requires, among other things, the federal banking agencies to take "prompt corrective action" in respect of depository institutions that do not meet minimum capital requirements. FDICIA establishes five capital tiers: "well capitalized," "adequately capitalized," "undercapitalized," "significantly undercapitalized" and "critically undercapitalized." A depository
institution's capital tier will depend upon where its capital levels are in relation to various relevant capital measures, which, among others, include a Tier 1 and total risk-based capital measure and a leverage ratio capital measure.
Regulations establishing the specific capital tiers provide that, for a depository institution to be well capitalized, it must have a total risk-based capital ratio of at least 10% and a Tier 1 risk-based capital ratio of at least 8%, a common equity Tier 1 risk-based capital measure of at least 6.5%, a Tier 1 leverage ratio of at least 5% and not be subject to any specific capital order or directive. For an institution to be adequately capitalized, it must have a total risk-based capital ratio of at least 8%, a Tier 1 risk-based capital ratio of at least 6%, a common equity Tier 1 risk-based capital measure of at least 4.5% and a Tier 1 leverage ratio of at least 4%. Under certain circumstances, the appropriate banking agency may treat a well capitalized, adequately capitalized or undercapitalized institution as if the institution were in the next lower capital category.
As of December 31, 2015, Comerica and its banking subsidiaries exceeded the ratios required for an institution to be considered "well capitalized" under these regulations.
FDICIA generally prohibits a depository institution from making any capital distribution (including payment of a dividend) or paying any management fee to its holding company if the depository institution would thereafter be undercapitalized. Undercapitalized depository institutions are subject to limitations on growth and certain activities and are required to submit an acceptable capital restoration plan. The federal banking agencies may not accept a capital plan without determining, among other things, that the plan is based on realistic assumptions and is likely to succeed in restoring the depository institution's capital. In addition, for a capital restoration plan to be acceptable, the institution's parent holding company must guarantee for a specific time period that the institution will comply with such capital restoration plan. The aggregate liability of the parent holding company under the guaranty is limited to the lesser of (i) an amount equal to 5% of the depository institution's total assets at the time it became undercapitalized, or (ii) the amount that is necessary (or would have been necessary) to bring the institution into compliance with all capital standards applicable with respect to such institution as of the time it fails to comply with the plan. If a depository institution fails to submit or implement an acceptable plan, it is treated as if it is significantly undercapitalized.
Significantly undercapitalized depository institutions are subject to a number of requirements and restrictions. Specifically, such a depository institution may be required to do one or more of the following, among other things: sell sufficient voting stock to become adequately capitalized, reduce the interest rates it pays on deposits, reduce its rate of asset growth, dismiss certain senior executive officers or directors, or stop accepting deposits from correspondent banks. Critically undercapitalized institutions are subject to the appointment of a receiver or conservator or such other action as the FDIC and the applicable federal banking agency shall determine appropriate.
As an additional means to identify problems in the financial management of depository institutions, FDICIA requires federal bank regulatory agencies to establish certain non-capital safety and soundness standards for institutions any such agency supervises. The standards relate generally to, among others, earnings, liquidity, operations and management, asset quality, various risk and management exposures (e.g., credit, operational, market, interest rate, etc.) and executive compensation. The agencies are authorized to take action against institutions that fail to meet such standards.
FDICIA also contains a variety of other provisions that may affect the operations of depository institutions including reporting requirements, regulatory standards for real estate lending, "truth in savings" provisions, the requirement that a depository institution give 90 days prior notice to customers and regulatory authorities before closing any branch, and a prohibition on the acceptance or renewal of brokered deposits by depository institutions that are not well capitalized or are adequately capitalized and have not received a waiver from the FDIC.
Capital Requirements
Comerica and its bank subsidiaries are subject to risk-based capital requirements and guidelines imposed by the FRB and/or the OCC.
For this purpose, a depository institution's or holding company's assets and certain specified off-balance sheet commitments are assigned to various risk categories defined by the FRB, each weighted differently based on the level of credit risk that is ascribed to such assets or commitments, based on counterparty type and asset class. A depository institution's or holding company's capital, in turn, is divided into three tiers: Common Equity Tier 1 ("CET1"), additional Tier 1, and Tier 2. CET1 capital predominantly includes common shareholders' equity, less certain deductions for goodwill, intangible assets and deferred tax assets that arise from net operating losses and tax credit carry-forwards, if any. Additionally, Comerica has made the election to permanently exclude accumulated other comprehensive income related to debt securities, cash flow hedges, and defined benefit postretirement plans from CET1 capital. Additional Tier 1 capital primarily includes noncumulative perpetual preferred stock and related surplus. Tier 2 capital primarily includes qualifying subordinated debt and qualifying allowance for credit losses. Certain deductions and adjustments to CET1 capital, Tier 1 capital and Tier 2 capital are subject to phase-in through December 31, 2017. Entities that engage in trading activities, whose trading activities exceed specified levels, also are required to maintain capital for market risk. Market risk includes changes in the market value of trading account, foreign exchange, and commodity positions, whether resulting from broad market movements (such as changes in the general level of interest rates, equity prices, foreign
exchange rates, or commodity prices) or from position specific factors. From time to time, Comerica's trading activities may exceed specified regulatory levels, in which case Comerica maintains additional capital for market risk as required.
Comerica, like other bank holding companies, currently is required to maintain CET1, Tier 1 (the sum of CET1 and additional Tier 1 capital) and "total capital" (the sum of Tier 1 and Tier 2 capital) equal to at least 4.5%, 6% and 8% of its total risk-weighted assets (including certain off-balance-sheet items, such as standby letters of credit), respectively. At December 31, 2015, Comerica met all requirements, with CET1, Tier 1 and total capital equal to 10.54%, 10.54% and 12.69% of its total risk-weighted assets, respectively.
Comerica is also required to maintain a minimum "leverage ratio" (Tier 1 capital to non-risk-adjusted total assets) of 4%. Comerica's leverage ratio of 10.22% at December 31, 2015 reflects the nature of Comerica's balance sheet and demonstrates a commitment to capital adequacy. At December 31, 2015, Comerica Bank had CET1, Tier 1 and total capital equal to 10.20%, 10.20% and 12.05% of its total risk-weighted assets, respectively, and a leverage ratio of 9.89%.
Additional information on the calculation of Comerica and its bank subsidiaries' CET1, Tier 1 capital, total capital and risk-weighted assets is set forth in Note 20 of the Notes to Consolidated Financial Statements located on pages F-99 through F-100 of the Financial Section of this report. Additional information on the timing and nature of the Basel III capital requirements is set forth below, under "Basel III: Regulatory Capital and Liquidity Regime."
FDIC Insurance Assessments
The FDIC Deposit Insurance Fund ("DIF") provides insurance coverage for certain deposits. Comerica's subsidiary banks are subject to FDIC deposit insurance assessments to maintain the DIF. The FDIC imposes a risk-based deposit premium assessment system, which was amended pursuant to the Federal Deposit Insurance Reform Act of 2005 and further amended by the Dodd-Frank Act. The Dodd-Frank Act also increased the DIF's minimum reserve ratio and permanently increased general deposit insurance coverage from $100,000 to $250,000. The final rule implementing revisions to the assessment system became effective April 1, 2011. Under the risk-based deposit premium assessment system, the assessment rates for an insured depository institution are determined by an assessment rate calculator, which is based on a number of elements to measure the risk each institution poses to the DIF. The assessment rate is applied to total average assets less tangible equity. Under the current system, premiums are assessed quarterly and could increase if, for example, criticized loans and/or other higher risk assets increase or balance sheet liquidity decreases. For 2015, Comerica's FDIC insurance expense totaled $37 million.
In November 2015, the FDIC issued a Notice of Proposed Rulemaking on Assessments in order to implement section 334 of the Dodd-Frank Act (§334), which requires the FDIC to (1) raise the minimum reserve ratio for the DIF to 1.35 percent, from 1.15 percent, (2) assess premiums on banks to reach the 1.35 percent goal by September 30, 2020, and (3) offset the effect of the increase in the minimum reserve ratio on insured depository institutions with assets of less than $10 billion. The FDIC proposed a surcharge on large banks, to be assessed over a period of eight quarters, to begin the quarter after the DIF reserve ratio first reaches or exceeds 1.15 percent, as a means to implement §334. As proposed, Comerica would be subject to the surcharge assessment. Management currently estimates that, based on the proposal, total FDIC expense would increase by approximately $10 million annually during the surcharge period, which could begin in either the first or second quarter 2016.
Enforcement Powers of Federal and State Banking Agencies
The FRB and other federal and state banking agencies have broad enforcement powers, including, without limitation, and as prescribed to each agency by applicable law, the power to terminate deposit insurance, impose substantial fines and other civil penalties and appoint a conservator or receiver. Failure to comply with applicable laws or regulations could subject Comerica or its banking subsidiaries, as well as officers and directors of these organizations, to administrative sanctions and potentially substantial civil and criminal penalties.
The Dodd-Frank Wall Street Reform and Consumer Protection Act and Other Recent Legislative and Regulatory Developments
The recent financial crisis has led to significant changes in the legislative and regulatory landscape of the financial services industry, including the overhaul of that landscape with the passage of the Dodd-Frank Act, which was signed into law on July 21, 2010. Provided below is an overview of key elements of the Dodd-Frank Act relevant to Comerica, as well as other recent legislative and regulatory developments. The estimates of the impact on Comerica discussed below are based on information currently available and, if applicable, are subject to change until final rulemaking is complete.
Incentive-Based Compensation. In June 2010, the FRB, OCC and FDIC issued comprehensive final guidance on incentive compensation policies intended to ensure that the incentive compensation policies of banking organizations do not undermine the safety and soundness of such organizations by encouraging excessive risk-taking. The guidance, which covers senior executives as well as other employees who, either individually or as part of a group, have the ability to expose the banking organization to material amounts of risk, is based upon the key principles that a banking organization's incentive compensation arrangements (i) should provide employees incentives that appropriately balance risk and financial results in a manner that does not encourage employees to expose their organizations to imprudent risk; (ii) should be compatible with effective controls and risk-management;
and (iii) should be supported by strong corporate governance, including active and effective oversight by the organization's board of directors. Banking organizations are expected to review regularly their incentive compensation arrangements based on these three principles. Where there are deficiencies in the incentive compensation arrangements, they should be promptly addressed. Enforcement actions may be taken against a banking organization if its incentive compensation arrangements, or related risk-management control or governance processes, pose a risk to the organization's safety and soundness, particularly if the organization is not taking prompt and effective measures to correct the deficiencies. Comerica is subject to this final guidance and, similar to other large banking organizations, has been subject to a continuing review of incentive compensation policies and practices by representatives of the FRB, the Federal Reserve Bank of Dallas and the Texas Department of Banking since 2011. As part of that review, Comerica has undertaken a thorough analysis of all the incentive compensation programs throughout the organization, the individuals covered by each plan and the risks inherent in each plan's design and implementation. Comerica has determined that risks arising from employee compensation plans are not reasonably likely to have a material adverse effect on Comerica. Further, it is the Company's intent to continue to evolve our processes going forward by monitoring regulations and best practices for sound incentive compensation.
On April 14, 2011, the FRB, OCC and several other federal financial regulators issued a joint proposed rulemaking to implement Section 956 of the Dodd-Frank Act. Section 956 directed regulators to jointly prescribe regulations or guidelines prohibiting incentive-based payment arrangements, or any feature of any such arrangement, at covered financial institutions that encourage inappropriate risks by providing excessive compensation or that could lead to a material financial loss. This proposal supplements the final guidance issued by the banking agencies in June 2010. Consistent with the Dodd-Frank Act, the proposed rule would not apply to institutions with total consolidated assets of less than $1 billion, and would impose heightened standards for institutions with $50 billion or more in total consolidated assets, which includes Comerica. For these larger institutions, the proposed rule would require that at least 50 percent of annual incentive-based payments be deferred over a period of at least three years for designated executives. Moreover, boards of directors of these larger institutions would be required to identify employees who individually have the ability to expose the institution to possible losses that are substantial in relation to the institution's size, capital or overall risk tolerance, and to determine that the incentive compensation for these employees appropriately balances risk and rewards according to enumerated standards. Comerica is monitoring the development of this rule.
Basel III: Regulatory Capital and Liquidity Regime. In December 2010, the Basel Committee on Banking Supervision (the "Basel Committee") issued a framework for strengthening international capital and liquidity regulation ("Basel III"). In July 2013, U.S. banking regulators issued a final rule for the U.S. adoption of the Basel III regulatory capital framework. Basel III includes a more stringent definition of capital and introduces a new common equity Tier 1 ("CET1") capital requirement; sets forth two comprehensive methodologies for calculating risk-weighted assets ("RWA"), a standardized approach and an advanced approach; introduces two new capital buffers, a conservation buffer and a countercyclical buffer (applicable to advanced approach entities); establishes a new supplemental leverage ratio (applicable to advanced approach entities); and sets out minimum capital ratios and overall capital adequacy standards. As a banking organization subject to the standardized approach, the rules were effective for Comerica on January 1, 2015. Certain deductions and adjustments to regulatory capital (primarily related to intangible assets and surplus Tier 2 capital minority interest) phase in starting January 1, 2015 and will be fully implemented on January 1, 2018. The capital conservation buffer phases in at 0.625 percent beginning on January 1, 2016 and ultimately increases to 2.5 percent on January 1, 2019. Comerica is not subject to the countercyclical buffer or the supplemental leverage ratio.
Comerica's December 31, 2015 CET1 and Tier 1 ratios were both 10.54 percent. Comerica's December 31, 2015 CET1 and Tier 1 capital ratios exceed the minimum required by the final rule (4.5 percent and 6 percent, respectively).
On September 3, 2014, U.S. banking regulators adopted the Liquidity Coverage Ratio ("LCR") rule, which set for U.S. banks the minimum liquidity measure established under the Basel III liquidity framework. Under the final rule, Comerica is subject to a modified LCR standard, which requires a financial institution to hold a minimum level of high-quality, liquid assets ("HQLA") to fully cover modified net cash outflows under a 30-day systematic liquidity stress scenario. The rule is effective for Comerica on January 1, 2016. During the transition year, 2016, Comerica will be required to maintain a minimum LCR of 90 percent. Beginning January 1, 2017, and thereafter, the minimum required LCR will be 100 percent. As of December 31, 2015, Comerica's LCR ratio meets the fully phased-in 2017 requirement.
The Basel III liquidity framework includes a second minimum liquidity measure, the Net Stable Funding Ratio ("NSFR"), which requires the amount of available longer-term, stable sources of funding to be at least 100 percent of the required amount of longer-term stable funding over a one-year period. On October 31, 2014, the Basel Committee on Banking Supervision issued its final NSFR rule, which was originally introduced in 2010 and revised in January 2014. U.S. banking regulators have announced that they expect to issue proposed rules to implement the NFSR in advance of its scheduled global implementation in 2018. While uncertainty exists in the final form and timing of the U.S. rule implementing the NSFR and whether or not Comerica will be subject to the full requirements, Comerica is closely monitoring the development of the rule.
Interchange Fees. On July 20, 2011, the FRB published final rules (Regulation II) pursuant to the Dodd-Frank Act establishing the maximum permissible interchange fee that an issuer may receive for an electronic debit transaction as the sum of 21 cents per transaction and 5 basis points multiplied by the value of the transaction and prohibiting network exclusivity
arrangements and routing restrictions. Comerica is subject to the final rules. In July 2013, a federal district court invalidated the FRB's interchange fee rules. The FRB's appeal of the court's ruling resulted in the U.S. Circuit Court of Appeals for the District of Columbia overruling the district court, reinstating the final rule as previously issued. On January 20, 2015, the U.S. Supreme Court denied a further appeal. Accordingly, Regulation II remains intact and its limits on interchange fees are now permanent.
Supervision and Regulation Assessment. Section 318 of the Dodd-Frank Act authorizes the federal banking agencies to assess fees against bank holding companies with total consolidated assets in excess of $50 billion equal to the expenses necessary or appropriate in order to carry out their supervision and regulation of those companies. Comerica accrued $1.6 million for 2015, which will be assessed in the first quarter 2016.
The Volcker Rule. The federal banking agencies and the SEC published approved joint final regulations to implement the Volcker Rule on December 10, 2013. The Volcker Rule generally prohibits banking entities from engaging in proprietary trading and from owning and sponsoring "covered funds" (e.g. hedge funds and private equity funds). The final regulations adopt a multi-faceted approach to implementing the Volcker Rule prohibitions that relies on: (i) detailed descriptions of prohibited and permitted activities; (ii) detailed compliance requirements; and (iii) for banking entities with large volumes of trading activity, detailed quantitative analysis and reporting obligations. In addition to rules implementing the core prohibitions and exemptions (e.g. underwriting, market-making related activities, risk-mitigating hedging and trading in certain government obligations) of the Volcker Rule, the regulations also include two appendices devoted to record-keeping and reporting requirements, including numerous quantitative data reporting obligations for banking entities with significant trading activities (Appendix A) and enhanced compliance requirements for banking entities with significant trading or covered fund activities (Appendix B). The final rule was effective April 1, 2014. The Volcker Rule generally required full compliance with the new restrictions by July 21, 2015; however, the FRB has extended the conformance period to July 21, 2017 for covered funds that were in place prior to December 31, 2013. Comerica is currently in compliance with the effective aspect of the Volcker Rule and expects to meet the final requirements adopted by regulators within the applicable regulatory timelines. Additional information on Comerica's portfolio of indirect (through funds) private equity and venture capital investments is set forth in Note 1 of the Notes to Consolidated Financial Statements located on page F-54 of the Financial Section of this report.
Annual Capital Plans and Stress Tests. Comerica is subject to the FRB's annual Comprehensive Capital Analysis and Review (CCAR) process, as well as the Dodd-Frank Act Stress Testing (DFAST) requirements. As part of the CCAR process, the FRB undertakes a supervisory assessment of the capital adequacy of bank holding companies (BHCs), including Comerica, that have $50 billion or more in total consolidated assets. This capital adequacy assessment is based on a review of a comprehensive capital plan submitted by each participating BHC to the FRB that describes the company's planned capital actions during the nine quarter review period, as well as the results of stress tests conducted by both the company and the FRB under different hypothetical macro-economic scenarios, including a supervisory baseline and an adverse and a severely adverse scenario provided by the FRB. After completing its review, the FRB may object or not object to the company's proposed capital actions, such as plans to pay or increase common stock dividends, reinstate or increase common equity repurchase programs, or issue or redeem preferred stock or other regulatory capital instruments. In connection with the 2015 CCAR, Comerica submitted its 2015 capital plan to the FRB on January 5, 2015; on March 5, 2015, Comerica and the FRB released the revenue, loss and capital results from the annual stress testing exercises and on March 11, 2015, Comerica announced that the FRB had completed its CCAR 2015 capital plan review and did not object to the capital plan or capital distributions contemplated in the plan. The 2015 capital plan submission extended over a period of five quarters, second quarter 2015 - second quarter 2016, due to a modification in timing by the FRB. Comerica plans to submit its CCAR 2016 capital plan to the FRB, consistent with new supervisory guidance (SR 15-19), in April 2016 and expects to receive the results of the FRB's review of the plan in June 2016 and to release its company-run stress tests results in June or July 2016.
FRB regulations also required that Comerica and other large bank holding companies conduct a separate mid-year stress test using financial data as of March 31st and three company-derived macro-economic scenarios (base, adverse and severely adverse) and publish a summary of the results under the severely adverse scenario. On July 23, 2015, Comerica released the results of its company-run mid-year stress tests. For 2016, the mid-year stress test will be moved to an October submission (instead of July). Stress test results are available in the Investor Relations section of Comerica's website at investor.comerica.com, on the "Regulatory Disclosures" page under "Financial Reports."
Enhanced Prudential Requirements. The Dodd-Frank Act created the Financial Stability Oversight Council ("FSOC") to coordinate efforts of the primary U.S. financial regulatory agencies in establishing regulations to address financial stability concerns and to make recommendations to the FRB as to enhanced prudential standards that must apply to large, interconnected bank holding companies and nonbank financial companies supervised by the FRB under the Dodd-Frank Act, including capital, leverage, liquidity and risk management requirements.
On February 18, 2014, the FRB issued its final regulations to implement the enhanced prudential and supervisory requirements mandated by the Dodd-Frank Act. The final regulations address enhanced risk-based capital and leverage requirements, enhanced liquidity requirements, enhanced risk management and risk committee requirements, single-counterparty credit limits, semiannual stress tests (as described above under "Annual Capital Plans and Stress Tests"), and a debt-to-equity limit
for companies determined to pose a grave threat to financial stability. They are intended to allow regulators to more effectively supervise large bank holding companies and nonbank financial firms whose failure could impact the stability of the US financial system, and generally build on existing US and international regulatory guidance. The rule also takes a multi-stage or phased approach to many of the requirements (such as the capital and liquidity requirements). Most of these requirements apply to Comerica because it has consolidated assets of more than $50 billion. Comerica has or will implement all requirements of the new rules within regulatory timelines.
Resolution (Living Will) Plans. Section 165(d) of the Dodd-Frank Act requires bank holding companies with total consolidated assets of $50 billion or more ("covered companies") to prepare and submit to the federal banking agencies (e.g., FRB and FDIC) a plan for their rapid and orderly resolution under the U.S. Bankruptcy Code. Covered companies, such as Comerica, with less than $100 billion in total nonbank assets were required to submit their initial plans by December 31, 2013. In addition, Section 165(d) requires FDIC-insured depository institutions (like Comerica Bank) with assets of $50 billion or more to develop, maintain, and periodically submit plans outlining how the FDIC would resolve it through the FDIC's resolution powers under the Federal Deposit Insurance Act. The federal banking agencies have issued rules to implement these requirements. In addition, those rules require the filing of annual updates to the plans. Both Comerica and Comerica Bank filed their respective initial and updated resolution plans by the required due dates. The 2015 resolution plan updates are currently under review by the FRB and FDIC.
Section 611 and Title VII of the Dodd-Frank Act. Section 611 of the Dodd-Frank Act prohibits a state bank from engaging in derivative transactions unless the lending limit laws of the state in which the bank is chartered take into consideration exposure to derivatives. Section 611 does not provide how state lending limit laws must factor in derivatives. The Texas Finance Commission has adopted an administrative rule meeting the requirements of Section 611. Accordingly, Comerica Bank may engage in derivative transactions, as permitted by applicable law.
Title VII of the Dodd-Frank Act establishes a comprehensive framework for over-the-counter ("OTC") derivatives transactions. The structure for derivatives set forth in the Dodd-Frank Act is intended to promote, among other things, exchange trading and centralized clearing of swaps and security-based swaps, as well as greater transparency in the derivatives markets and enhanced monitoring of the entities that use these markets. In this regard, the CFTC and SEC have issued several regulatory proposals, some of which are now effective or will become effective in 2016.
The SEC and CFTC have jointly adopted rules further defining the terms "swap," "security-based swap," "security-based swap agreement," and have also adopted final joint rules defining the terms "swap dealer," "security-based swap dealer," "major swap participant," and "major security-based swap participant." Comerica has determined that neither it, nor its subsidiaries, are within the definition of "swap dealer" or "major swap participant," but some portions of the Title VII regulations apply nonetheless. One of these regulations centers on limiting certain OTC transactions to "eligible contract participants." This regulation impacts Comerica's small business customers that do not qualify as eligible contract participants by making such customers ineligible for swap derivatives as hedging in their loan agreements.
Consumer Finance Regulations. The Dodd-Frank Act made several changes to consumer finance laws and regulations. It contained provisions that have weakened the federal preemption rules applicable for national banks and give state attorneys general the ability to enforce federal consumer protection laws. Additionally, the Dodd-Frank Act created the Consumer Financial Protection Bureau ("CFPB"), which has a broad rule-making authority for a wide range of consumer protection laws that apply to all banks and savings institutions, including the authority to prohibit "unfair, deceptive or abusive" acts and practices, and possesses examination and enforcement authority over all banks and savings institutions with more than $10 billion in assets. In this regard, the CFPB has commenced issuing several new rules to implement various provisions of the Dodd-Frank Act that were specifically identified as being enforced by the CFPB, as well as those specified for supervisory and enforcement authority for very large depository institutions and non-depository (nonbank) entities. Comerica is subject to CFPB foreign remittance rules and home mortgage lending rules, in addition to certain other CFPB rules.
The foreign remittance rules fall under Section 1073 of the Dodd-Frank Act. The CFPB issued new regulations amending Regulation E, which implements the Electronic Fund Transfer Act, effective October 28, 2013. The regulations were designed to provide protections to consumers who transfer funds to recipients located in countries outside the United States (customer foreign remittance transfers). In general, the regulation requires remittance transfer providers, such as Comerica, to disclose to a consumer the exchange rate, fees, and amount to be received by the recipient when the consumer sends a remittance transfer. Although Comerica had implemented the model disclosures provided in Appendix A to the final rule, on September 18, 2014, the CFPB extended the compliance exception period for the rule's new disclosure requirements to July 21, 2020.
On November 13, 2014, the CFPB issued a proposed regulation establishing new consumer protections and disclosure requirements on prepaid accounts, including (i) the provision of either periodic statements or free online account information access; (ii) new account error and unauthorized transaction rights; (iii) new "Know Before You Owe" prepaid account disclosures; (iv) public disclosure of account agreements for prepaid accounts and (v) credit protection for linked credit accounts.
Comerica has implemented these new rules and positioned itself to be in compliance with the new requirements.
Truth in Lending Act ("TILA") and Real Estate Settlement Procedures Act ("RESPA"). In November 2013, the CFPB issued a rule implementing new TILA RESPA Integrated Disclosures ("TRID") to replace the initial Truth-in-Lending disclosure and Good Faith Estimate for most closed-end consumer mortgage loans. The effective date was October 3, 2015. Significant changes in TRID include: (1) expansion of the scope of loans that require RESPA early disclosures, including bridge loans, vacant land loans, and construction loans; (2) changes and additions to "waiting period" requirements to close a loan; (3) reduced tolerances for estimated fees and (4) the lender, rather than the closing agent, is responsible for providing final disclosures. Although Comerica outsources most of its consumer mortgage loans, consumer construction financing has been suspended pending further clarification from the CFPB. This regulation has also resulted in a suspension of consumer bridge loan financing. Such financing has not been a significant business for Comerica.
The Truth in Lending Act (TILA) requires credit card issuers to post consumer credit card agreements to their websites and submit them quarterly to the CFPB commencing February 5, 2015. The CFPB implemented the rule on April 17, 2015. The CFPB delayed implementation of submissions of the agreements to the CFPB until the first week of April 2016. Comerica outsources its consumer credit cards, and does not anticipate any negative impact.
Home Mortgage Disclosure Act (HMDA). In July 2015 the CFPB implemented and expanded new HMDA rules. The final rule adopts a dwelling-secured standard for all loans or lines of credit that are for personal, family, or household purposes. Thus, most consumer-purpose transactions, including closed-end home-equity loans, home-equity lines of credit, and reverse mortgages, are subject to the regulation. Most commercial-purpose transactions (i.e., loans or lines of credit not for personal, family, or household purposes) are subject to the regulation only if they are for the purpose of home purchase, home improvement, or refinancing. The final rule excludes from coverage home improvement loans that are not secured by a dwelling (i.e., home improvement loans that are unsecured or that are secured by some other type of collateral) and all agricultural-purpose loans and lines of credit. Comerica is monitoring and implementing changes as required.
FDIC Guidance on Brokered Deposits. On January 5, 2015, the FDIC issued guidance in the form of "Frequently Asked Questions" to promote consistency by insured depository institutions in identifying, accepting, and reporting brokered deposits. On November 13, 2015, the FDIC issued proposed updates to the FAQs. All insured depository institutions (including those that are well capitalized) must report brokered deposits in their Consolidated Reports of Condition and Income (Call Reports). Comerica is currently evaluating the impact of these FAQs, including the proposed updates, to various business units throughout the organization, and believes they will only have a nominal impact.
Flood Insurance Reform. The Biggert-Waters Flood Insurance Reform Act of 2012 ("Biggert-Waters Act"), as amended by the Homeowner Flood Insurance Affordability Act of 2014, modified the National Flood Insurance Program by: (i) increasing the maximum civil penalty for Flood Disaster Protection Act violations to $2,000 and eliminating the annual penalty cap; (ii) requiring certain lenders (including Comerica) to escrow premiums and fees for flood insurance on residential improved real estate; (iii) directing lenders to accept private flood insurance and to notify borrowers of its availability; (iv) amending the force placement requirement provisions; and (v) permitting lenders to charge borrowers costs for lapses in or insufficient coverage. These requirements will impact Comerica loans and extensions of credit secured with residential improved real estate. The civil penalty and force placed insurance provisions were effective immediately.
On July 21, 2015, certain federal agencies issued a joint final rule exempting: (1) detached structures that are not used as a residence from the mandatory flood insurance purchase requirements and (2) HELOCs, business purpose loans, nonperforming loans, loans with terms of less than one year, loans for co-ops and condominiums, and subordinate loans on the same property from the mandatory escrow of flood insurance premium requirements. Additionally, the final rule requires Comerica to escrow flood insurance payments and offer the option to escrow flood insurance premiums on residential improved real estate securing a loan, effective January 1, 2016. The federal agencies will address the private flood insurance provisions of the Biggert-Waters Act in a separate rulemaking. Comerica will continue to monitor the development and implementation of the private flood insurance rules.
Future Legislation and Regulatory Measures
The environment in which financial institutions will operate after the recent financial crisis, including legislative and regulatory changes affecting capital, liquidity, supervision, permissible activities, corporate governance and compensation, and changes in fiscal policy, may have long-term effects on the business model and profitability of financial institutions that cannot be foreseen. Moreover, in light of recent events and current conditions in the U.S. financial markets and economy, Congress and regulators have continued to increase their focus on the regulation of the financial services industry. Comerica cannot accurately predict whether legislative changes will occur or, if they occur, the ultimate effect they would have upon the financial condition or results of operations of Comerica.
UNDERWRITING APPROACH
The loan portfolio is a primary source of profitability and risk, so proper loan underwriting is critical to Comerica's long-term financial success. Comerica extends credit to businesses, individuals and public entities based on sound lending principles
and consistent with prudent banking practice. During the loan underwriting process, a qualitative and quantitative analysis of potential credit facilities is performed, and the credit risks associated with each relationship are evaluated. Important factors considered as part of the underwriting process for new loans and loan renewals include:
| |
| • | People: Including the competence, integrity and succession planning of customers. |
| |
| • | Purpose: The legal, logical and productive purposes of the credit facility. |
| |
| • | Payment: Including the source, timing and probability of payment. |
| |
| • | Protection: Including obtaining alternative sources of repayment, securing the loan, as appropriate, with collateral and/or third-party guarantees and ensuring appropriate legal documentation is obtained. |
| |
| • | Perspective: The risk/reward relationship and pricing elements (cost of funds; servicing costs; time value of money; credit risk). |
Comerica prices credit facilities to reflect risk, the related costs and the expected return, while maintaining competitiveness with other financial institutions. Loans with variable and fixed rates are underwritten to achieve expected risk-adjusted returns on the credit facilities and for the full relationship including the borrower's ability to repay the principal and interest based on such rates.
Credit Administration
Comerica maintains a Credit Administration Department ("Credit Administration") which is responsible for the oversight and monitoring of our loan portfolio. Credit Administration assists with underwriting by providing objective financial analysis, including an assessment of the borrower's business model, balance sheet, cash flow and collateral. Each borrower relationship is assigned an internal risk rating by Credit Administration. Further, Credit Administration updates the assigned internal risk rating for every borrower relationship as new information becomes available, either as a result of periodic reviews of the credit quality or as a result of a change in borrower performance. The goal of the internal risk rating framework is to improve Comerica's risk management capability, including its ability to identify and manage changes in the credit risk profile of its portfolio, predict future losses and price the loans appropriately for risk.
Credit Policy
Comerica maintains a comprehensive set of credit policies. Comerica's credit policies provide individual relationship managers, as well as loan committees, approval authorities based on our internal risk rating system and establish maximum exposure limits based on risk ratings and Comerica's legal lending limit. Credit Administration, in conjunction with the businesses units, monitors compliance with the credit policies and modifies the existing policies as necessary. New or modified policies/guidelines require approval by the Strategic Credit Committee, chaired by Comerica's Chief Credit Officer and comprising senior credit, market and risk management executives.
Commercial Loan Portfolio
Commercial loans are underwritten using a comprehensive analysis of the borrower's operations. The underwriting process includes an analysis of some or all of the factors listed below:
| |
| • | The borrower's business model. |
| |
| • | Periodic review of financial statements including financial statements audited by an independent certified public accountant when appropriate. |
| |
| • | The pro-forma financial condition including financial projections. |
| |
| • | The borrower's sources and uses of funds. |
| |
| • | The borrower's debt service capacity. |
| |
| • | The guarantor's financial strength. |
| |
| • | A comprehensive review of the quality and value of collateral, including independent third-party appraisals of machinery and equipment and commercial real estate, as appropriate, to determine the advance rates. |
| |
| • | Physical inspection of collateral and audits of receivables, as appropriate. |
For additional information specific to our Energy loan portfolio, please see the caption, "Energy Lending" on pages F-31 through F-33 of the Financial Section of this report.
Commercial Real Estate (CRE) Loan Portfolio
Comerica's CRE loan portfolio consists of real estate construction and commercial mortgage loans and includes both loans to real estate developers and loans secured by owner-occupied real estate. Comerica's CRE loan underwriting policies are consistent with the approach described above and provide maximum loan-to-value ratios that limit the size of a loan to a maximum percentage of the value of the real estate collateral securing the loan. The loan-to-value percentage varies by the type of collateral and is limited by advance rates established by our regulators. Our loan-to-value limitations are, in certain cases, more restrictive than those required by regulators and are influenced by other risk factors such as the financial strength of the borrower or guarantor, the equity provided to the project and the viability of the project itself. CRE loans generally require cash equity. CRE loans are normally originated with full recourse or limited recourse to all principals and owners. There are limitations to the size of a single project loan and to the aggregate dollar exposure to a single guarantor.
Consumer and Residential Mortgage Loan Portfolios
Comerica's consumer and residential mortgage loans are originated consistent with the underwriting approach described above, but also includes an assessment of each borrower's personal financial condition, including a review of credit reports and related FICO scores (a type of credit score used to assess an applicant's credit risk) and verification of income and assets. Comerica does not originate subprime loan programs. Although a standard industry definition for subprime loans (including subprime mortgage loans) does not exist, Comerica defines subprime loans as specific product offerings for higher risk borrowers, including individuals with one or a combination of high credit risk factors. These credit factors include low FICO scores, poor patterns of payment history, high debt-to-income ratios and elevated loan-to-value. We generally consider subprime FICO scores to be those below 620 on a secured basis (excluding loans with cash or near-cash collateral and adequate income to make payments) and below 660 for unsecured loans. Residential mortgage loans retained in the portfolio are largely relationship based. The remaining loans are typically eligible to be sold on the secondary market. Adjustable rate loans are limited to standard conventional loan programs.
EMPLOYEES
As of December 31, 2015, Comerica and its subsidiaries had 8,533 full-time and 570 part-time employees.
AVAILABLE INFORMATION
Comerica maintains an Internet website at www.comerica.com where the Annual Report on Form 10-K, Quarterly Reports on Form 10-Q, Current Reports on Form 8-K and all amendments to those reports are available without charge, as soon as reasonably practicable after those reports are filed with or furnished to the SEC. The Code of Business Conduct and Ethics for Employees, the Code of Business Conduct and Ethics for Members of the Board of Directors and the Senior Financial Officer Code of Ethics adopted by Comerica are also available on the Internet website and are available in print to any shareholder who requests them. Such requests should be made in writing to the Corporate Secretary at Comerica Incorporated, Comerica Bank Tower, 1717 Main Street, MC 6404, Dallas, Texas 75201.
In addition, pursuant to regulations adopted by the FRB, Comerica makes additional regulatory capital-related disclosures. Under these regulations, Comerica satisfies a portion of these requirements through postings on its website, and Comerica has done so and expects to continue to do so without also providing disclosure of this information through filings with the SEC.
Where we have included web addresses in this report, such as our web address and the web address of the SEC, we have included those web addresses as inactive textual references only. Except as specifically incorporated by reference into this report, information on those websites is not part hereof.
Item 1A. Risk Factors.
This report includes forward-looking statements as defined in the Private Securities Litigation Reform Act of 1995. In addition, Comerica may make other written and oral communications from time to time that contain such statements. All statements regarding Comerica's expected financial position, strategies and growth prospects and general economic conditions Comerica expects to exist in the future are forward-looking statements. The words, "anticipates," "believes," "contemplates," "feels," "expects," "estimates," "seeks," "strives," "plans," "intends," "outlook," "forecast," "position," "target," "mission," "assume," "achievable," "potential," "strategy," "goal," "aspiration," "opportunity," "initiative," "outcome," "continue," "remain," "maintain," "on course," "trend," "objective," "looks forward," "projects," "models" and variations of such words and similar expressions, or future or conditional verbs such as "will," "would," "should," "could," "might," "can," "may" or similar expressions, as they relate to Comerica or its management, are intended to identify forward-looking statements.
Comerica cautions that forward-looking statements are subject to numerous assumptions, risks and uncertainties, which change over time. Forward-looking statements speak only as of the date the statement is made, and Comerica does not undertake to update forward-looking statements to reflect facts, circumstances, assumptions or events that occur after the date the forward-looking statements are made. Actual results could differ materially from those anticipated in forward-looking statements and future results could differ materially from historical performance.
In addition to factors mentioned elsewhere in this report or previously disclosed in Comerica's SEC reports (accessible on the SEC's website at www.sec.gov or on Comerica's website at www.comerica.com), the factors contained below, among others, could cause actual results to differ materially from forward-looking statements, and future results could differ materially from historical performance.
| |
| • | General political, economic or industry conditions, either domestically or internationally, may be less favorable than expected. |
Local, domestic, and international events including economic, financial market, political and industry specific conditions affect the financial services industry, directly and indirectly. Conditions such as or related to inflation, recession, unemployment, volatile interest rates, international conflicts and other factors, such as real estate values, energy prices, state and local municipal budget deficits, government spending and the U.S. national debt, outside of our control may, directly and indirectly, adversely affect Comerica. As was the case with the Great Recession of 2008 and 2009, economic downturns could result in the delinquency of outstanding loans, which could have a material adverse impact on Comerica's earnings.
| |
| • | Governmental monetary and fiscal policies may adversely affect the financial services industry, and therefore impact Comerica's financial condition and results of operations. |
Monetary and fiscal policies of various governmental and regulatory agencies, in particular the FRB, affect the financial services industry, directly and indirectly. The FRB regulates the supply of money and credit in the U.S. and its monetary and fiscal policies determine in a large part Comerica's cost of funds for lending and investing and the return that can be earned on such loans and investments. Changes in such policies, including changes in interest rates, will influence the origination of loans, the value of investments, the generation of deposits and the rates received on loans and investment securities and paid on deposits. Changes in monetary and fiscal policies are beyond Comerica's control and difficult to predict. Comerica's financial condition and results of operations could be materially adversely impacted by changes in governmental monetary and fiscal policies.
| |
| • | Changes in regulation or oversight may have a material adverse impact on Comerica's operations. |
Comerica is subject to extensive regulation, supervision and examination by the U.S. Treasury, the Texas Department of Banking, the FDIC, the FRB, the SEC, FINRA and other regulatory bodies. Such regulation and supervision governs the activities in which Comerica may engage. Regulatory authorities have extensive discretion in their supervisory and enforcement activities, including the imposition of restrictions on Comerica's operations, investigations and limitations related to Comerica's securities, the classification of Comerica's assets and determination of the level of Comerica's allowance for loan losses. Any change in such regulation and oversight, whether in the form of regulatory policy, regulations, legislation or supervisory action, may have a material adverse impact on Comerica's business, financial condition or results of operations.
In particular, Congress and other regulators have significantly increased their focus on the regulation of the financial services industry. Their actions include, but are not limited to, the passage of the Dodd-Frank Act, many parts of which are now in effect, and the adoption of the Basel III framework in the U.S. For additional information on these actions, please see "The Dodd-Frank Wall Street Reform and Consumer Protection Act and Other Recent Legislative and Regulatory Developments" section of the "Supervisory and Regulation" section of this report. Many provisions in the Dodd-Frank Act and the Basel III framework remain subject to regulatory rule-making and/or implementation, the effects of which are not yet known.
Additionally, Comerica may be subject to other regulatory actions that are currently under consideration, or may be under consideration in the future. For example, should U.S. banking regulators establish any additional capital buffers (for example, for banking organizations deemed systemically important to the U.S. financial system), Comerica may be subject to those additional requirements. Further, the current administration proposed in January 2010 a fee on those financial institutions that benefited from recent actions taken by the U.S. government to stabilize the financial system. Calls for that fee were renewed during the 2013 federal budget discussions. Most recently, the administration's 2015 budget proposal would impose a 7 basis point tax on U.S. financial firms with assets over $50 billion, with the goal of such proposal to penalize financial institutions for being overly leveraged. If such fee or another similar fee were implemented, Comerica would likely be subject to its terms.
The effects of such legislation and regulatory actions on Comerica cannot reliably be fully determined at this time. We can neither predict when or whether future regulatory or legislative reforms will be enacted nor what their contents will be. The impact of any future legislation or regulatory actions on Comerica's businesses or operations cannot be reliably determined at this time, and such impact may adversely affect Comerica.
| |
| • | Comerica must maintain adequate sources of funding and liquidity to meet regulatory expectations, support its operations and fund outstanding liabilities. |
Comerica's liquidity and ability to fund and run its business could be materially adversely affected by a variety of conditions and factors, including financial and credit market disruptions and volatility or a lack of market or customer confidence in financial markets in general, which may result in a loss of customer deposits or outflows of cash or collateral and/or ability to access capital markets on favorable terms.
Other conditions and factors that could materially adversely affect Comerica's liquidity and funding include a lack of market or customer confidence in, or negative news about, Comerica or the financial services industry generally which also may result in a loss of deposits and/or negatively affect the ability to access the capital markets; the loss of customer deposits to alternative investments; counterparty availability; interest rate fluctuations; general economic conditions; and the legal, regulatory, accounting and tax environments governing our funding transactions. Many of the above conditions and factors may be caused by events over which Comerica has little or no control. There can be no assurance that significant disruption and volatility in the financial markets will not occur in the future. Further, Comerica's customers may be adversely impacted by such conditions, which could have a negative impact on Comerica's business, financial condition and results of operations.
In September 2014, U.S. banking regulators issued a final rule implementing a quantitative liquidity requirement in the U.S. generally consistent with the Liquidity Coverage Ratio ("LCR") minimum liquidity measure established under the Basel III liquidity framework. Under the final rule, Comerica is subject to a modified LCR standard, which requires a financial institution to hold a minimum level of high-quality, liquid assets ("HQLA") to fully cover modified net cash outflows under a 30-day systematic liquidity stress scenario. The rule is effective for Comerica on January 1, 2016. During the transition year, 2016, Comerica will be required to maintain a minimum LCR of 90 percent. Beginning January 1, 2017, and thereafter, the minimum required LCR will be 100 percent. For more information regarding the LCR, please see the "Supervision and Regulation" section of this report. The inability to access capital markets funding sources as needed could adversely impact our level of regulatory-qualifying capital and ability to continue to comply with the LCR framework.
Further, if Comerica is unable to continue to fund assets through customer bank deposits or access funding sources on favorable terms, or if Comerica suffers an increase in borrowing costs or otherwise fails to manage liquidity effectively, Comerica's liquidity, operating margins, financial condition and results of operations may be materially adversely affected.
| |
| • | Compliance with more stringent capital and liquidity requirements may adversely affect Comerica. |
While new capital and liquidity requirements in connection with Basel III and the requirements of the Dodd-Frank Act have been largely implemented, continued compliance by Comerica and its subsidiary banks with these restrictions will have an effect on Comerica. Additional information on the regulatory capital and liquidity requirements currently applicable to Comerica is set forth in the "Supervision and Regulation" section of this report. In light of these or other new legal and regulatory requirements, Comerica and our subsidiary banks are, and will be in the future, required to satisfy additional, more stringent capital and liquidity standards, including annual and mid-year stress testing and quantitative standards for liquidity management. These requirements, and any other new laws or regulations related to capital and liquidity, could adversely affect Comerica's ability to pay dividends or make equity repurchases, or could require Comerica to reduce business levels or to raise capital, including in ways that may adversely affect its results of operations or financial condition and/or existing shareholders.
Further, our regulators may also require us to satisfy additional, more stringent capital adequacy and liquidity standards than those specified as part of the Dodd-Frank Act and the FRB's proposed and final rules implementing Basel III.
Maintaining higher levels of capital and liquidity may reduce Comerica's profitability and otherwise adversely affect its business, financial condition, or results of operations.
| |
| • | Declines in the businesses or industries of Comerica's customers - in particular, the energy industry - could cause increased credit losses or decreased loan balances, which could adversely affect Comerica. |
Comerica's business customer base consists, in part, of customers in volatile businesses and industries such as the energy industry, the automotive production industry and the real estate business. These industries are sensitive to global economic conditions, supply chain factors and/or commodities prices. Any decline in one of those customers' businesses or industries could cause increased credit losses, which in turn could adversely affect Comerica. Further, any decline in these businesses or industries could cause decreased borrowings, either due to reduced demand or reductions in the borrowing base available for each customer loan.
In particular, oil and gas prices have fallen sharply since mid-2014. Loans in the Middle Market - Energy business line were $3.1 billion, or approximately 6 percent of total loans, at December 31, 2015. At December 31, 2015, the reserve
allocation for energy and energy-related loans was over 4 percent of total energy and energy-related loans. Subsequent to December 31, 2015, oil and gas prices dropped significantly, and Comerica saw additional negative migration into criticized loans. If oil and gas prices continue to remain depressed for a prolonged period of time, Comerica's energy portfolio could experience increased credit losses, which could adversely affect Comerica's financial results. Furthermore, a prolonged period of low oil prices could also have a negative impact on the Texas economy, which could have a material adverse effect on Comerica's business, financial condition and results of operations. For more information regarding Comerica's energy portfolio, please see "Energy Lending" beginning on page F-31 of the Financial Section of this report.
| |
| • | Unfavorable developments concerning credit quality could adversely affect Comerica's financial results. |
Although Comerica regularly reviews credit exposure related to its customers and various industry sectors in which it has business relationships, default risk may arise from events or circumstances that are difficult to detect or foresee. Under such circumstances, Comerica could experience an increase in the level of provision for credit losses, nonperforming assets, net charge-offs and reserve for credit losses, which could adversely affect Comerica's financial results.
| |
| • | Operational difficulties, failure of technology infrastructure or information security incidents could adversely affect Comerica's business and operations. |
Comerica is exposed to many types of operational risk, including legal risk, the risk of fraud or theft by employees or outsiders, failure of Comerica's controls and procedures and unauthorized transactions by employees or operational errors, including clerical or recordkeeping errors or those resulting from computer or telecommunications systems malfunctions. Given the high volume of transactions at Comerica, certain errors may be repeated or compounded before they are identified and resolved. The occurrence of such operational risks can lead to other types of risks including reputational and compliance risks that may amplify the adverse impact to Comerica.
In particular, Comerica's operations rely on the secure processing, storage and transmission of confidential and other information on its technology systems and networks. Any failure, interruption or breach in security of these systems could result in failures or disruptions in Comerica's customer relationship management, general ledger, deposit, loan and other systems.
Comerica may also be subject to disruptions of its operating systems arising from events that are wholly or partially beyond its control, which may include, for example, computer viruses, cyber attacks (including cyber attacks resulting in the destruction or exfiltration of data and systems), spikes in transaction volume and/or customer activity, electrical or telecommunications outages, or natural disasters. Although Comerica has programs in place related to business continuity, disaster recovery and information security to maintain the confidentiality, integrity, and availability of its systems, business applications and customer information, such disruptions may give rise to interruptions in service to customers and loss or liability to Comerica. While Comerica's website, www.comerica.com, has been subject to denial of service attacks in the last few years, these events did not result in a breach of Comerica's client data, and account information remained secure. However, future cyber attacks could be more disruptive and damaging, and Comerica may not be able to anticipate or prevent all such attacks.
The occurrence of any failure or interruption in Comerica's operations or information systems, or any security breach, could cause reputational damage, jeopardize the confidentiality of customer information, result in a loss of customer business, subject Comerica to regulatory intervention or expose it to civil litigation and financial loss or liability, any of which could have a material adverse effect on Comerica.
| |
| • | Comerica relies on other companies to provide certain key components of its business infrastructure, and certain failures could materially adversely affect operations. |
Comerica faces the risk of operational disruption, failure or capacity constraints due to its dependency on third party vendors for components of its business infrastructure. Third party vendors provide certain key components of Comerica's business infrastructure, such as data processing and storage, payment processing services, recording and monitoring transactions, internet connections and network access, clearing agency and card processing services. While Comerica conducts due diligence prior to engaging with third party vendors, it does not control their operations. Further, while Comerica has enhanced its vendor management policies and practices to facilitate Comerica's compliance with recently updated vendor regulations, these policies and practices cannot eliminate this risk. In this context, any vendor failure to properly deliver these services could adversely affect Comerica's business operations, and result in financial loss, reputational harm, and/or regulatory action.
| |
| • | Noninterest expenses are important to our profitability, but are subject to a number of factors, some of which are not in our control. |
Many factors can influence the amount of noninterest expenses, including changing regulations, pension and health care costs, technology and cybersecurity investments, outside processing expenses and litigation. The importance of managing expenses has been amplified in the current slow growth, low net interest margin business environment. Comerica's noninterest expenses may increase more than anticipated, which could result in an adverse impact on net income.
| |
| • | Changes in the financial markets, including fluctuations in interest rates and their impact on deposit pricing, could adversely affect Comerica's net interest income and balance sheet. |
The operations of financial institutions such as Comerica are dependent to a large degree on net interest income, which is the difference between interest income from loans and investments and interest expense on deposits and borrowings. Prevailing economic conditions, the trade, fiscal and monetary policies of the federal government and the policies of various regulatory agencies all affect market rates of interest and the availability and cost of credit, which in turn significantly affect financial institutions' net interest income. Interest rates over the past several years have remained at low levels, even following the Federal Open Market Committee's 25 basis point rate rise in December. A continued low interest rate environment may continue to adversely affect the interest income Comerica earns on loans and investments. For a discussion of Comerica's interest rate sensitivity, please see, "Market and Liquidity Risk" beginning on page F-33 of the Financial Section of this report.
Volatility in interest rates can also result in disintermediation, which is the flow of funds away from financial institutions into direct investments, such as federal government and corporate securities and other investment vehicles, which, because of the absence of federal insurance premiums and reserve requirements, generally pay higher rates of return than financial institutions. Comerica's financial results could be materially adversely impacted by changes in financial market conditions.
| |
| • | Reduction in our credit ratings could adversely affect Comerica and/or the holders of its securities. |
Rating agencies regularly evaluate Comerica, and their ratings are based on a number of factors, including Comerica's financial strength as well as factors not entirely within its control, including conditions affecting the financial services industry generally. There can be no assurance that Comerica will maintain its current ratings. In February 2016, Standard & Poor's downgraded Comerica's long-term senior credit ratings one notch to BBB+ and Comerica Bank's long and short-term credit ratings one notch to A- and A-2, respectively, and maintained its "Negative" outlook. In March 2015, Moody's Investors Service put global bank ratings on review following the publication of revised bank rating methodology and in May 2015, it downgraded Comerica Bank's long-term senior credit ratings one notch to A3. In February 2016, Moody's revised its outlook to "Negative." While recent credit rating actions have had little to no detrimental impact on Comerica's profitability, borrowing costs, or ability to access the capital markets, future downgrades to Comerica's or its subsidiaries' credit ratings could adversely affect Comerica's profitability, borrowing costs, or ability to access the capital markets or otherwise have a negative effect on Comerica's results of operations or financial condition. If such a reduction placed Comerica's or its subsidiaries' credit ratings below investment grade, it could also create obligations or liabilities under the terms of existing arrangements that could increase Comerica's costs under such arrangements. Additionally, a downgrade of the credit rating of any particular security issued by Comerica or its subsidiaries could negatively affect the ability of the holders of that security to sell the securities and the prices at which any such securities may be sold.
| |
| • | The soundness of other financial institutions could adversely affect Comerica. |
Comerica's ability to engage in routine funding transactions could be adversely affected by the actions and commercial soundness of other financial institutions. Financial services institutions are interrelated as a result of trading, clearing, counterparty or other relationships. Comerica has exposure to many different industries and counterparties, and it routinely executes transactions with counterparties in the financial industry, including brokers and dealers, commercial banks, investment banks, mutual and hedge funds, and other institutional clients. As a result, defaults by, or even rumors or questions about, one or more financial services institutions, or the financial services industry generally, have led, and may further lead, to market-wide liquidity problems and could lead to losses or defaults by us or by other institutions. Many of these transactions could expose Comerica to credit risk in the event of default of its counterparty or client. In addition, Comerica's credit risk may be impacted when the collateral held by it cannot be realized upon or is liquidated at prices not sufficient to recover the full amount of the financial instrument exposure due to Comerica. There is no assurance that any such losses would not adversely affect, possible materially in nature, Comerica.
| |
| • | The introduction, implementation, withdrawal, success and timing of business initiatives and strategies may be less successful or may be different than anticipated, which could adversely affect Comerica's business. |
Comerica makes certain projections and develops plans and strategies for its banking and financial products. If Comerica does not accurately determine demand for its banking and financial product needs, it could result in Comerica incurring
significant expenses without the anticipated increases in revenue, which could result in a material adverse effect on its business.
| |
| • | Damage to Comerica's reputation could damage its businesses. |
With consumers increasingly interested in doing business with companies they admire and trust, reputational risk is an increasing concern for business. Such risks include compliance issues, operational challenges, or a strategic, high profile event. Comerica's business is based on the trust of its customers, communities, and entire value chain, which makes managing reputational risk extremely important. News or other publicity that impairs Comerica's reputation, or the reputation of the financial services industry generally, can therefore cause significant harm to Comerica's business and prospects. Further, adverse publicity or negative information posted on social media websites regarding Comerica, whether or not true, may result in harm to Comerica's prospects.
| |
| • | Comerica may not be able to utilize technology to efficiently and effectively develop, market, and deliver new products and services to its customers. |
The financial services industry experiences rapid technological change with regular introductions of new technology-driven products and services. The efficient and effective utilization of technology enables financial institutions to better serve customers and to reduce costs. Comerica's future success depends, in part, upon its ability to address the needs of its customers by using technology to market and deliver products and services that will satisfy customer demands, meet regulatory requirements, and create additional efficiencies in Comerica's operations. Comerica may not be able to effectively develop new technology-driven products and services or be successful in marketing or supporting these products and services to its customers, which could have a material adverse impact on Comerica's financial condition and results of operations.
| |
| • | Competitive product and pricing pressures among financial institutions within Comerica's markets may change. |
Comerica operates in a very competitive environment, which is characterized by competition from a number of other financial institutions in each market in which it operates. Comerica competes in terms of products and pricing with large national and regional financial institutions and with smaller financial institutions. Some of Comerica's larger competitors, including certain nationwide banks that have a significant presence in Comerica's market area, may make available to their customers a broader array of product, pricing and structure alternatives and, due to their asset size, may more easily absorb credit losses in a larger overall portfolio. Some of Comerica's competitors (larger or smaller) may have more liberal lending policies and processes.
Additionally, the financial services industry has recently been subject to increasing regulation. For more information, see the "Supervision and Regulation" section of this report. Such regulations may require significant additional investments in technology, personnel or other resources or place limitations on the ability of financial institutions, including Comerica, to engage in certain activities. Comerica's competitors may be subject to a significantly different or reduced degree of regulation due to their asset size or types of products offered. They may also have the ability to more efficiently utilize resources to comply with regulations or may be able to more effectively absorb the costs of regulations into their existing cost structure.
If Comerica is unable to compete effectively in products and pricing in its markets, business could decline, which could have a material adverse effect on Comerica's business, financial condition or results of operations.
| |
| • | Changes in customer behavior may adversely impact Comerica's business, financial condition and results of operations. |
Comerica uses a variety of financial tools, models and other methods to anticipate customer behavior as a part of its strategic planning and to meet certain regulatory requirements. Individual, economic, political, industry-specific conditions and other factors outside of Comerica's control, such as fuel prices, energy costs, real estate values or other factors that affect customer income levels, could alter predicted customer borrowing, repayment, investment and deposit practices. Such a change in these practices could materially adversely affect Comerica's ability to anticipate business needs and meet regulatory requirements.
Further, difficult economic conditions may negatively affect consumer confidence levels. A decrease in consumer confidence levels would likely aggravate the adverse effects of these difficult market conditions on Comerica, Comerica's customers and others in the financial institutions industry.
| |
| • | Any future strategic acquisitions or divestitures may present certain risks to Comerica's business and operations. |
Difficulties in capitalizing on the opportunities presented by a future acquisition may prevent Comerica from fully achieving the expected benefits from the acquisition, or may cause the achievement of such expectations to take longer to realize than expected.
Further, the assimilation of the acquired entity's customers and markets could result in higher than expected deposit attrition, loss of key employees, disruption of Comerica's businesses or the businesses of the acquired entity or otherwise adversely affect Comerica's ability to maintain relationships with customers and employees or achieve the anticipated benefits of the acquisition. These matters could have an adverse effect on Comerica for an undetermined period. Comerica will be subject to similar risks and difficulties in connection with any future decisions to downsize, sell or close units or otherwise change the business mix of Comerica.
| |
| • | Management's ability to maintain and expand customer relationships may differ from expectations. |
The financial services industry is very competitive. Comerica not only vies for business opportunities with new customers, but also competes to maintain and expand the relationships it has with its existing customers. While management believes that it can continue to grow many of these relationships, Comerica will continue to experience pressures to maintain these relationships as its competitors attempt to capture its customers. Failure to create new customer relationships and to maintain and expand existing customer relationships to the extent anticipated may adversely impact Comerica's earnings.
| |
| • | Management's ability to retain key officers and employees may change. |
Comerica's future operating results depend substantially upon the continued service of its executive officers and key personnel. Comerica's future operating results also depend in significant part upon its ability to attract and retain qualified management, financial, technical, marketing, sales and support personnel. Competition for qualified personnel is intense, and Comerica cannot ensure success in attracting or retaining qualified personnel. There may be only a limited number of persons with the requisite skills to serve in these positions, and it may be increasingly difficult for Comerica to hire personnel over time.
Further, Comerica's ability to retain key officers and employees may be impacted by legislation and regulation affecting the financial services industry. On April 14, 2011, FRB, OCC and several other federal financial regulators issued a joint proposed rulemaking to implement Section 956 of the Dodd-Frank Act. Section 956 requires the regulators to issue regulations that prohibit incentive-based compensation arrangements that encourage inappropriate risk taking by covered financial institutions and are deemed to be excessive, or that may lead to material losses. Consistent with the Dodd-Frank Act, the proposed rule would not apply to institutions with total consolidated assets of less than $1 billion, and would impose heightened standards for institutions with $50 billion or more in total consolidated assets, which includes Comerica. For these larger institutions, the proposed rule would require that at least 50 percent of incentive-based payments be deferred over a minimum period of three years for designated executives. Moreover, boards of directors of these larger institutions would be required to identify employees who have the ability to expose the institution to possible losses that are substantial in relation to the institution's size, capital or overall risk tolerance, and to determine that the incentive compensation for these employees appropriately balances risk and rewards according to enumerated standards. Accordingly, Comerica may be at a disadvantage to offer competitive compensation compared to other financial institutions (as referenced above) or companies in other industries, which may not be subject to the same requirements.
Comerica's business, financial condition or results of operations could be materially adversely affected by the loss of any of its key employees, or Comerica's inability to attract and retain skilled employees.
| |
| • | Legal and regulatory proceedings and related matters with respect to the financial services industry, including those directly involving Comerica and its subsidiaries, could adversely affect Comerica or the financial services industry in general. |
Comerica has been, and may in the future be, subject to various legal and regulatory proceedings. It is inherently difficult to assess the outcome of these matters, and there can be no assurance that Comerica will prevail in any proceeding or litigation. Any such matter could result in substantial cost and diversion of Comerica's efforts, which by itself could have a material adverse effect on Comerica's financial condition and operating results. Further, adverse determinations in such matters could result in actions by Comerica's regulators that could materially adversely affect Comerica's business, financial condition or results of operations.
Comerica establishes reserves for legal claims when payments associated with the claims become probable and the costs can be reasonably estimated. Comerica may still incur legal costs for a matter even if it has not established a reserve. In addition, due to the inherent subjectivity of the assessments and unpredictability of the outcome of legal proceedings, the actual cost of resolving a legal claim may be substantially higher than any amounts reserved for that matter. The ultimate resolution of a pending legal proceeding, depending on the remedy sought and granted, could adversely affect Comerica's results of operations and financial condition.
| |
| • | Methods of reducing risk exposures might not be effective. |
Instruments, systems and strategies used to hedge or otherwise manage exposure to various types of credit, market, liquidity, operational, compliance, financial reporting and strategic risks could be less effective than anticipated. As a
result, Comerica may not be able to effectively mitigate its risk exposures in particular market environments or against particular types of risk, which could have a material adverse impact on Comerica's business, financial condition or results of operations.
| |
| • | Terrorist activities or other hostilities may adversely affect the general economy, financial and capital markets, specific industries, and Comerica. |
Terrorist attacks or other hostilities may disrupt Comerica's operations or those of its customers. In addition, these events have had and may continue to have an adverse impact on the U.S. and world economy in general and consumer confidence and spending in particular, which could harm Comerica's operations. Any of these events could increase volatility in the U.S. and world financial markets, which could harm Comerica's stock price and may limit the capital resources available to Comerica and its customers. This could have a material adverse impact on Comerica's operating results, revenues and costs and may result in increased volatility in the market price of Comerica's common stock.
| |
| • | Catastrophic events, including, but not limited to, hurricanes, tornadoes, earthquakes, fires, droughts and floods, may adversely affect the general economy, financial and capital markets, specific industries, and Comerica. |
Comerica has significant operations and a significant customer base in California, Texas, Florida and other regions where natural and other disasters may occur. These regions are known for being vulnerable to natural disasters and other risks, such as tornadoes, hurricanes, earthquakes, fires, droughts and floods. These types of natural catastrophic events at times have disrupted the local economy, Comerica's business and customers and have posed physical risks to Comerica's property. In addition, catastrophic events occurring in other regions of the world may have an impact on Comerica's customers and in turn, on Comerica. A significant catastrophic event could materially adversely affect Comerica's operating results.
| |
| • | Changes in accounting standards could materially impact Comerica's financial statements. |
From time to time accounting standards setters change the financial accounting and reporting standards that govern the preparation of Comerica's financial statements. These changes can be difficult to predict and can materially impact how Comerica records and reports its financial condition and results of operations. In some cases, Comerica could be required to apply a new or revised standard retroactively, resulting in changes to previously reported financial results, or a cumulative charge to retained earnings.
| |
| • | Comerica's accounting policies and processes are critical to the reporting of financial condition and results of operations. They require management to make estimates about matters that are uncertain. |
Accounting policies and processes are fundamental to how Comerica records and reports the financial condition and results of operations. Management must exercise judgment in selecting and applying many of these accounting policies and processes so they comply with U.S. GAAP. In some cases, management must select the accounting policy or method to apply from two or more alternatives, any of which may be reasonable under the circumstances, yet may result in the Company reporting materially different results than would have been reported under a different alternative.
Management has identified certain accounting policies as being critical because they require management's judgment to make difficult, subjective or complex judgments about matters that are uncertain. Materially different amounts could be reported under different conditions or using different assumptions or estimates. Comerica has established detailed policies and control procedures that are intended to ensure these critical accounting estimates and judgments are well controlled and applied consistently. In addition, the policies and procedures are intended to ensure that the process for changing methodologies occurs in an appropriate manner. Because of the uncertainty surrounding management's judgments and the estimates pertaining to these matters, Comerica cannot guarantee that it will not be required to adjust accounting policies or restate prior period financial statements. See "Critical Accounting Policies" on pages F-40 through F-43 of the Financial Section of this report and Note 1 of the Notes to Consolidated Financial Statements located on pages F-51 through F-63 of the Financial Section of this report.
Item 1B. Unresolved Staff Comments.
None.
Item 2. Properties.
The executive offices of Comerica are located in the Comerica Bank Tower, 1717 Main Street, Dallas, Texas 75201. Comerica Bank occupies six floors of the building, plus additional space on the building's lower level. Comerica does not own the Comerica Bank Tower space, but has naming rights to the building and leases the space from an unaffiliated third party. The lease for such space used by Comerica and its subsidiaries extends through September 2023. Comerica's Michigan headquarters are located in a 10-story building in the central business district of Detroit, Michigan at 411 W. Lafayette, Detroit, Michigan 48226. Such building is owned by Comerica Bank. As of December 31, 2015, Comerica, through its banking affiliates, operated at a total of 604 locations. This includes banking centers, trust services locations, and/or loan production or other financial services offices, primarily in the States of Texas, Michigan, California, Florida and Arizona. Of the 604 locations, 236 were owned and 368 were leased. As of December 31, 2015, affiliates also operated from leased spaces in Denver, Colorado; Wilmington, Delaware; Oakbrook Terrace, Illinois; Boston, Massachusetts; Minneapolis, Minnesota; Morristown, New Jersey; New York, New York; Rocky Mount and Cary, North Carolina; Memphis, Tennessee; McLean, Virginia; Bellevue and Seattle, Washington; Monterrey, Mexico; Toronto, Ontario, Canada and Windsor, Ontario, Canada. Comerica and its subsidiaries own, among other properties, a check processing center in Livonia, Michigan, and three buildings in Auburn Hills, Michigan, used mainly for lending functions and operations.
Item 3. Legal Proceedings.
Please see Note 21 of the Notes to Consolidated Financial Statements located on pages F-102 through F-103 of the Financial Section of this report.
Item 4. Mine Safety Disclosures.
Not applicable.
PART II
Item 5. Market for Registrant's Common Equity, Related Stockholder Matters and Issuer Purchases of Equity Securities.
Market Information and Holders of Common Stock
The common stock of Comerica Incorporated is traded on the New York Stock Exchange (NYSE Trading Symbol: CMA). At February 17, 2016, there were approximately 10,070 record holders of Comerica's common stock.
Sales Prices and Dividends
Quarterly cash dividends were declared during 2015 and 2014 totaling $0.83 and $0.79 per common share per year, respectively. The following table sets forth, for the periods indicated, the high and low sale prices per share of Comerica's common stock as reported on the NYSE Composite Transactions Tape for all quarters of 2015 and 2014, as well as dividend information.
|
| | | | | | | | | | | | | | | |
| Quarter | | High | | Low | | Dividends Per Share | | Dividend Yield* |
| 2015 | | | | | | | | |
| Fourth | | $ | 47.44 |
| | $ | 39.52 |
| | $ | 0.21 |
| | 1.9 | % |
| Third | | 52.93 |
| | 40.01 |
| | 0.21 |
| | 1.8 |
|
| Second | | 53.45 |
| | 44.38 |
| | 0.21 |
| | 1.7 |
|
| First | | 47.94 |
| | 40.09 |
| | 0.20 |
| | 1.8 |
|
| 2014 | | | | | | | | |
| Fourth | | $ | 50.14 |
| | $ | 42.73 |
| | $ | 0.20 |
| | 1.7 | % |
| Third | | 52.72 |
| | 48.33 |
| | 0.20 |
| | 1.6 |
|
| Second | | 52.60 |
| | 45.34 |
| | 0.20 |
| | 1.6 |
|
| First | | 53.50 |
| | 43.96 |
| | 0.19 |
| | 1.6 |
|
| * Dividend yield is calculated by annualizing the quarterly dividend per share and dividing by an average of the high and low price in the quarter. |
A discussion of dividend restrictions is set forth in Note 20 of the Notes to Consolidated Financial Statements located on pages F-101 through F-102 of the Financial Section of this report, in the "Capital" section on pages F-21 through F-23 of the Financial Section of this report and in the "Supervision and Regulation" section of this report.
Performance Graph
Our performance graph is available under the caption "Performance Graph" on page F-2 of the Financial Section of this report.
Purchases of Equity Securities by the Issuer and Affiliated Purchasers
On April 28, 2015, the Board of Directors of Comerica authorized the repurchase of up to an additional 10.0 million shares of Comerica Incorporated outstanding common stock, in addition to the 2.1 million shares remaining at March 31, 2015 under the Board's prior authorizations for the equity repurchase program initially approved in November 2010. Including the April 28, 2015 authorization, a total of 40.3 million shares has been authorized for repurchase under the equity repurchase program since its inception in 2010. In November 2010, the Board authorized the purchase of up to all 11.5 million of Comerica's original outstanding warrants and on April 28, 2015, the Board also authorized the repurchase of up to an additional 2.6 million warrants. There is no expiration date for Comerica's equity repurchase program.
The following table summarizes Comerica's equity repurchase activity for the year ended December 31, 2015.
|
| | | | | | | | | | | | | | | | |
| (shares in thousands) | Total Number of Shares and Warrants Purchased as Part of Publicly Announced Repurchase Plans or Programs | | Remaining Repurchase Authorization (a) | | Total Number of Shares Purchased (b) | | Average Price Paid Per Share | | Average Price Paid Per Warrant (c) |
| Total first quarter 2015 | 1,354 |
| | 12,728 |
| | 1,517 |
| | $ | 43.38 |
| | $ | — |
|
| Total second quarter 2015 | 1,513 |
| | 19,608 |
| (d) | 1,523 |
| | 48.00 |
| | 20.70 |
|
| Total third quarter 2015 | 1,234 |
| | 18,374 |
| | 1,260 |
| | 47.75 |
| | — |
|
| October 2015 | 649 |
| | 17,725 |
| | 652 |
| | 42.52 |
| | — |
|
| November 2015 | 629 |
| | 17,096 |
| | 632 |
| | 45.73 |
| | — |
|
| December 2015 | 192 |
| | 16,904 |
| | 192 |
| | 44.74 |
| | — |
|
| Total fourth quarter 2015 | 1,470 |
| | 16,904 |
| | 1,476 |
| | 44.19 |
| | — |
|
| Total 2015 | 5,571 |
| | 16,904 |
| | 5,776 |
| | 45.54 |
| | 20.70 |
|
| |
| (a) | Maximum number of shares and warrants that may yet be purchased under the publicly announced plans or programs. |
| |
| (b) | Includes approximately 205,000 shares (including 6,000 shares in the quarter ended December 31, 2015) purchased pursuant to deferred compensation plans and shares purchased from employees to pay for required minimum tax withholding related to restricted stock vesting under the terms of an employee share-based compensation plan during the year ended December 31, 2015. These transactions are not considered part of Comerica's repurchase program. |
| |
| (c) | Comerica repurchased 500,000 warrants under the repurchase program during the year ended December 31, 2015. Upon exercise of a warrant, the number of shares with a value equal to the aggregate exercise price is withheld from an exercising warrant holder as payment (known as a "net exercise provision"). During the year ended December 31, 2015, Comerica withheld the equivalent of approximately 1,291,000 shares to cover an aggregate of $65.7 million in exercise price and issued approximately 934,000 shares to the exercising warrant holders. Shares withheld in connection with the net exercise provision are not included in the total number of shares or warrants purchased in the above table. |
| |
| (d) | Includes April 28, 2015 equity repurchase authorization for up to an additional 10.6 million shares and share-equivalents. |
Item 6. Selected Financial Data.
Reference is made to the caption "Selected Financial Data" on page F-3 of the Financial Section of this report.
Item 7. Management's Discussion and Analysis of Financial Condition and Results of Operations.
Reference is made to the sections entitled "2015 Overview and 2016 Outlook," "Results of Operations," "Strategic Lines of Business," "Balance Sheet and Capital Funds Analysis," "Risk Management," "Critical Accounting Policies," "Supplemental Financial Data" and "Forward-Looking Statements" on pages F-4 through F-45 of the Financial Section of this report.
Item 7A. Quantitative and Qualitative Disclosures About Market Risk.
Reference is made to the subheadings entitled "Market and Liquidity Risk," "Operational Risk," "Compliance Risk" and "Strategic Risk" on pages F-33 through F-39 of the Financial Section of this report.
Item 8. Financial Statements and Supplementary Data.
Reference is made to the sections entitled "Consolidated Balance Sheets," "Consolidated Statements of Income," "Consolidated Statements of Comprehensive Income," "Consolidated Statements of Changes in Shareholders' Equity," "Consolidated Statements of Cash Flows," "Notes to Consolidated Financial Statements," "Report of Management," "Reports of Independent Registered Public Accounting Firm," and "Historical Review" on pages F-46 through F-116 of the Financial Section of this report.
Item 9. Changes in and Disagreements with Accountants on Accounting and Financial Disclosure.
None.
Item 9A. Controls and Procedures.
Disclosure Controls and Procedures
As required by Rule 13a-15(b) of the Exchange Act, management, including the Chief Executive Officer and Chief Financial Officer, conducted an evaluation as of the end of the period covered by this Annual Report on Form 10-K, of the effectiveness of our disclosure controls and procedures as defined in Exchange Act Rule 13a-15(e). Based on that evaluation, the Chief Executive Officer and Chief Financial Officer concluded that Comerica's disclosure controls and procedures were effective as of the end of the period covered by this Annual Report on Form 10-K.
Internal Control over Financial Reporting
Management's annual report on internal control over financial reporting and the related attestation report of Comerica's registered public accounting firm are included on pages F-111 and F-112 in the Financial Section of this report.
As required by Rule 13a-15(d) of the Exchange Act, management, including the Chief Executive Officer and Chief Financial Officer, conducted an evaluation of our internal control over financial reporting to determine whether any changes occurred during the period covered by this Annual Report on Form 10-K that have materially affected, or are reasonably likely to materially affect, Comerica's internal control over financial reporting. Based on that evaluation, the Chief Executive Officer and Chief Financial Officer concluded that there has been no such change during the last quarter of the fiscal year covered by this Annual Report on Form 10-K that has materially affected, or is reasonably likely to materially affect, Comerica's internal control over financial reporting.
Item 9B. Other Information.
None.
PART III
Item 10. Directors, Executive Officers and Corporate Governance.
Comerica has a Senior Financial Officer Code of Ethics that applies to the Chief Executive Officer, the Chief Financial Officer, the Chief Accounting Officer and the Treasurer. The Senior Financial Officer Code of Ethics is available on Comerica's website at www.comerica.com. If any substantive amendments are made to the Senior Financial Officer Code of Ethics or if Comerica grants any waiver, including any implicit waiver, from a provision of the Senior Financial Officer Code of Ethics to the Chief Executive Officer, the Chief Financial Officer, the Chief Accounting Officer or the Treasurer, we will disclose the nature of such amendment or waiver on our website.
The remainder of the response to this item will be included under the sections captioned "Information About Nominees," "Committees and Meetings of Directors," "Committee Assignments," "Executive Officers" and "Section 16(a) Beneficial Ownership Reporting Compliance" of Comerica's definitive Proxy Statement relating to the Annual Meeting of Shareholders to be held on April 26, 2016, which sections are hereby incorporated by reference.
Item 11. Executive Compensation.
The response to this item will be included under the sections captioned "Compensation Committee Interlocks and Insider Participation," "Compensation Discussion and Analysis," "Compensation of Directors," "Governance, Compensation and Nominating Committee Report," "2015 Summary Compensation Table," "2015 Grants of Plan-Based Awards," "Outstanding Equity Awards at Fiscal Year-End 2015," "2015 Option Exercises and Stock Vested," "Pension Benefits at Fiscal Year-End 2015," "2015 Nonqualified Deferred Compensation," and "Potential Payments upon Termination or Change of Control at Fiscal Year-End 2015" of Comerica's definitive Proxy Statement relating to the Annual Meeting of Shareholders to be held on April 26, 2016, which sections are hereby incorporated by reference.
Item 12. Security Ownership of Certain Beneficial Owners and Management and Related Stockholder Matters.
The response to this item will be included under the sections captioned "Security Ownership of Certain Beneficial Owners," "Security Ownership of Management" and "Securities Authorized for Issuance Under Equity Compensation Plans" of Comerica's definitive Proxy Statement relating to the Annual Meeting of Shareholders to be held on April 26, 2016, which sections are hereby incorporated by reference.
Item 13. Certain Relationships and Related Transactions, and Director Independence.
The response to this item will be included under the sections captioned "Director Independence and Transactions of Directors with Comerica," "Transactions of Related Parties with Comerica," and "Information about Nominees" of Comerica's definitive Proxy Statement relating to the Annual Meeting of Shareholders to be held on April 26, 2016, which sections are hereby incorporated by reference.
Item 14. Principal Accountant Fees and Services.
The response to this item will be included under the section captioned "Independent Registered Public Accounting Firm" of Comerica's definitive Proxy Statement relating to the Annual Meeting of Shareholders to be held on April 26, 2016, which section is hereby incorporated by reference.
PART IV
Item 15. Exhibits and Financial Statement Schedules
The following documents are filed as a part of this report:
|
| | |
| 1. | | Financial Statements: The financial statements that are filed as part of this report are included in the Financial Section on pages F-46 through F-113. |
| | | |
| 2. | | All of the schedules for which provision is made in the applicable accounting regulations of the SEC are either not required under the related instruction, the required information is contained elsewhere in the Form 10-K, or the schedules are inapplicable and therefore have been omitted. |
| | | |
| 3. | | Exhibits: The exhibits listed on the Exhibit Index on pages E-1 through E-5 of this Form 10-K are filed with this report or are incorporated herein by reference. |
FINANCIAL REVIEW AND REPORTS
Comerica Incorporated and Subsidiaries
PERFORMANCE GRAPH
The graph shown below compares the total returns (assuming reinvestment of dividends) of Comerica Incorporated common stock, the S&P 500 Index, and the KBW Bank Index. The graph assumes $100 invested in Comerica Incorporated common stock (returns based on stock prices per the NYSE) and each of the indices on December 31, 2010 and the reinvestment of all dividends during the periods presented.
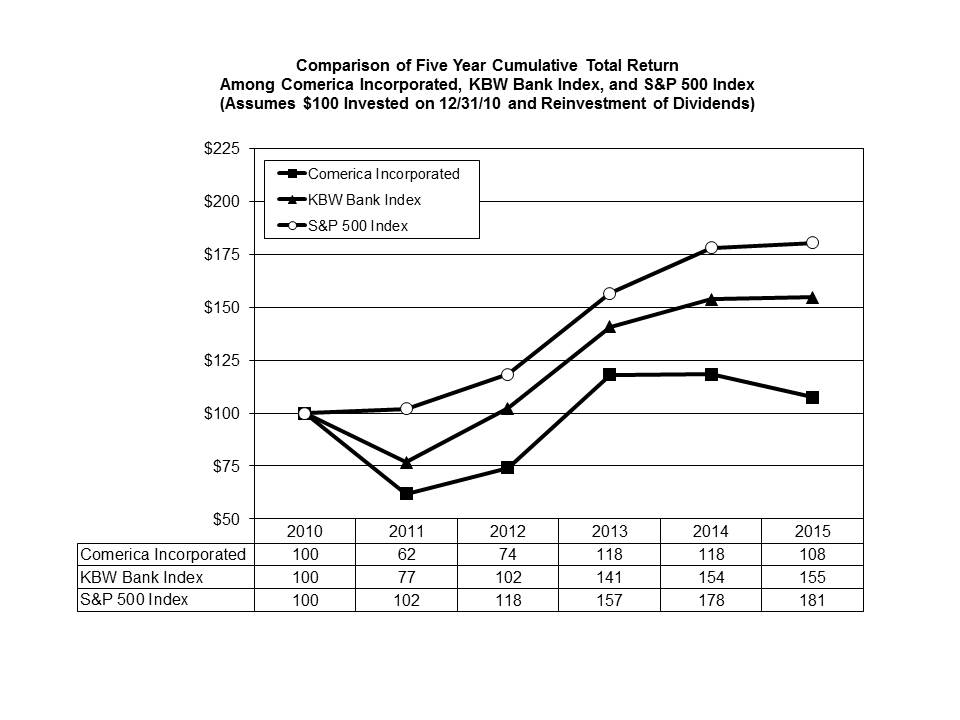 The performance shown on the graph is not necessarily indicative of future performance.
SELECTED FINANCIAL DATA
|
| | | | | | | | | | | | | | | | | | | |
| (dollar amounts in millions, except per share data) | | | | | | | | | |
| Years Ended December 31 | 2015 | | 2014 | | 2013 | | 2012 | | 2011 |
| EARNINGS SUMMARY | | | | | | | | | |
| Net interest income | $ | 1,689 |
| | $ | 1,655 |
| | $ | 1,672 |
| | $ | 1,728 |
| | $ | 1,653 |
|
| Provision for credit losses | 147 |
| | 27 |
| | 46 |
| | 79 |
| | 144 |
|
| Noninterest income (a) | 1,050 |
| | 868 |
| | 882 |
| | 870 |
| | 843 |
|
| Noninterest expenses (a) | 1,842 |
| | 1,626 |
| | 1,722 |
| | 1,757 |
| | 1,771 |
|
| Provision for income taxes | 229 |
| | 277 |
| | 245 |
| | 241 |
| | 188 |
|
| Net income | 521 |
| | 593 |
| | 541 |
| | 521 |
| | 393 |
|
| Net income attributable to common shares | 515 |
| | 586 |
| | 533 |
| | 515 |
| | 389 |
|
| PER SHARE OF COMMON STOCK | | | | | | | | | |
| Diluted earnings per common share | $ | 2.84 |
| | $ | 3.16 |
| | $ | 2.85 |
| | $ | 2.67 |
| | $ | 2.09 |
|
| Cash dividends declared | 0.83 |
| | 0.79 |
| | 0.68 |
| | 0.55 |
| | 0.40 |
|
| Common shareholders' equity | 43.03 |
| | 41.35 |
| | 39.22 |
| | 36.86 |
| | 34.79 |
|
| Tangible common equity (b) | 39.33 |
| | 37.72 |
| | 35.64 |
| | 33.36 |
| | 31.40 |
|
| Market value | 41.83 |
| | 46.84 |
| | 47.54 |
| | 30.34 |
| | 25.80 |
|
| Average diluted shares (in millions) | 181 |
| | 185 |
| | 187 |
| | 192 |
| | 186 |
|
| YEAR-END BALANCES | | | | | | | | | |
| Total assets | $ | 71,877 |
| | $ | 69,186 |
| | $ | 65,224 |
| | $ | 65,066 |
| | $ | 61,005 |
|
| Total earning assets | 66,687 |
| | 63,788 |
| | 60,200 |
| | 59,618 |
| | 55,506 |
|
| Total loans | 49,084 |
| | 48,593 |
| | 45,470 |
| | 46,057 |
| | 42,679 |
|
| Total deposits | 59,853 |
| | 57,486 |
| | 53,292 |
| | 52,191 |
| | 47,755 |
|
| Total medium- and long-term debt | 3,058 |
| | 2,675 |
| | 3,543 |
| | 4,720 |
| | 4,944 |
|
| Total common shareholders' equity | 7,560 |
| | 7,402 |
| | 7,150 |
| | 6,939 |
| | 6,865 |
|
| AVERAGE BALANCES | | | | | | | | | |
| Total assets | $ | 70,247 |
| | $ | 66,336 |
| | $ | 63,933 |
| | $ | 62,569 |
| | $ | 56,914 |
|
| Total earning assets | 65,129 |
| | 61,560 |
| | 59,091 |
| | 57,483 |
| | 52,121 |
|
| Total loans | 48,628 |
| | 46,588 |
| | 44,412 |
| | 43,306 |
| | 40,075 |
|
| Total deposits | 58,326 |
| | 54,784 |
| | 51,711 |
| | 49,533 |
| | 43,762 |
|
| Total medium- and long-term debt | 2,905 |
| | 2,963 |
| | 3,972 |
| | 4,818 |
| | 5,519 |
|
| Total common shareholders' equity | 7,534 |
| | 7,373 |
| | 6,965 |
| | 7,009 |
| | 6,348 |
|
| CREDIT QUALITY | | | | | | | | | |
| Total allowance for credit losses | $ | 679 |
| | $ | 635 |
| | $ | 634 |
| | $ | 661 |
| | $ | 752 |
|
| Total nonperforming loans | 379 |
| | 290 |
| | 374 |
| | 541 |
| | 887 |
|
| Foreclosed property | 12 |
| | 10 |
| | 9 |
| | 54 |
| | 94 |
|
| Total nonperforming assets | 391 |
| | 300 |
| | 383 |
| | 595 |
| | 981 |
|
| Net credit-related charge-offs | 101 |
| | 25 |
| | 73 |
| | 170 |
| | 328 |
|
| Net credit-related charge-offs as a percentage of average total loans | 0.21 | % | | 0.05 | % | | 0.16 | % | | 0.39 | % | | 0.82 | % |
| Allowance for loan losses as a percentage of total period-end loans | 1.29 |
| | 1.22 |
| | 1.32 |
| | 1.37 |
| | 1.70 |
|
| Allowance for loan losses as a percentage of total nonperforming loans | 167 |
| | 205 |
| | 160 |
| | 116 |
| | 82 |
|
| RATIOS | | | | | | | | | |
| Net interest margin (fully taxable equivalent) | 2.60 | % | | 2.70 | % | | 2.84 | % | | 3.03 | % | | 3.19 | % |
| Return on average assets | 0.74 |
| | 0.89 |
| | 0.85 |
| | 0.83 |
| | 0.69 |
|
| Return on average common shareholders' equity | 6.91 |
| | 8.05 |
| | 7.76 |
| | 7.43 |
| | 6.18 |
|
| Dividend payout ratio | 28.33 |
| | 24.09 |
| | 23.29 |
| | 20.52 |
| | 18.96 |
|
| Average common shareholders' equity as a percentage of average assets | 10.73 |
| | 11.11 |
| | 10.90 |
| | 11.21 |
| | 11.16 |
|
| Common equity tier 1 capital as a percentage of risk-weighted assets (c) | 10.54 |
| | n/a |
| | n/a |
| | n/a |
| | n/a |
|
| Tier 1 common capital as a percentage of risk-weighted assets (b) | n/a |
| | 10.50 |
| | 10.64 |
| | 10.14 |
| | 10.37 |
|
| Tier 1 capital as a percentage of risk-weighted assets (c) | 10.54 |
| | 10.50 |
| | 10.64 |
| | 10.14 |
| | 10.41 |
|
| Tangible common equity as a percentage of tangible assets (b) | 9.70 |
| | 9.85 |
| | 10.07 |
| | 9.76 |
| | 10.27 |
|
| |
| (a) | Effective January 1, 2015, contractual changes to a card program resulted in a change to the accounting presentation of the related revenues and expenses. The effect of this change was an increase of $181 million to both noninterest income and noninterest expenses in 2015. |
| |
| (b) | See Supplemental Financial Data section for reconcilements of non-GAAP financial measures. |
| |
| (c) | Ratios calculated based on the risk-based capital requirements in effect at the time. The U.S. implementation of the Basel III regulatory capital framework became effective on January 1, 2015, with transitional provisions. |
n/a - not applicable.
2015 OVERVIEW AND 2016 OUTLOOK
Comerica Incorporated (the Corporation) is a financial holding company headquartered in Dallas, Texas. The Corporation's major business segments are the Business Bank, the Retail Bank and Wealth Management. The core businesses are tailored to each of the Corporation's three primary geographic markets: Michigan, California and Texas. Information about the activities of the Corporation's business segments is provided in Note 22 to the consolidated financial statements.
As a financial institution, the Corporation's principal activity is lending to and accepting deposits from businesses and individuals. The primary source of revenue is net interest income, which is principally derived from the difference between interest earned on loans and investment securities and interest paid on deposits and other funding sources. The Corporation also provides other products and services that meet the financial needs of customers which generate noninterest income, the Corporation's secondary source of revenue. Growth in loans, deposits and noninterest income is affected by many factors, including economic conditions in the markets the Corporation serves, the financial requirements and economic health of customers, and the ability to add new customers and/or increase the number of products used by current customers. Success in providing products and services depends on the financial needs of customers and the types of products desired.
The accounting and reporting policies of the Corporation and its subsidiaries conform to generally accepted accounting principles (GAAP) in the United States (U.S.). The Corporation's consolidated financial statements are prepared based on the application of accounting policies, the most significant of which are described in Note 1 to the consolidated financial statements. The most critical of these significant accounting policies are discussed in the "Critical Accounting Policies" section of this financial review.
OVERVIEW
| |
| • | Net income was $521 million in 2015, a decrease of $72 million, or 12 percent, compared to $593 million in 2014. Net income per diluted common share was $2.84 in 2015, compared to $3.16 in 2014. The most significant items contributing to the decrease in net income are described below. |
| |
| • | Average loans were $48.6 billion in 2015, an increase of $2.0 billion, or 4 percent, compared to 2014. The increase in average loans primarily reflected an increase of $1.8 billion, or 6 percent, in commercial loans, $174 million, or 8 percent, in consumer loans and $100 million, or 6 percent in residential mortgage loans. The increase in commercial loans primarily reflected increases in Mortgage Banker Finance, Technology and Life Sciences, National Dealer Services and Small Business, partially offset by a decrease in Corporate Banking. |
| |
| • | Average deposits increased $3.5 billion, or 6 percent, to $58.3 billion in 2015, compared to 2014. The increase in average deposits reflected increases of $3.1 billion, or 12 percent, in average noninterest-bearing deposits and $1.2 billion, or 5 percent, in money market and interest-bearing checking deposits, partially offset by a decrease of $660 million, or 14 percent, in customer certificates of deposit. The increase in average deposits reflected increases in almost all lines of business and in all geographic markets. |
| |
| • | Net interest income was $1.7 billion in 2015, an increase of $34 million, or 2 percent, compared to 2014. The increase in net interest income resulted primarily from an increase in average earning assets of $3.6 billion, partially offset by a $27 million decrease in the accretion of the purchase discount on the acquired loan portfolio, continued pressure on yields from the low-rate environment and loan portfolio dynamics. |
| |
| • | The provision for credit losses was $147 million in 2015, an increase of $120 million compared to 2014, primarily reflecting increased provisions for Energy and energy-related loans, Technology and Life Sciences, Corporate Banking and Small Business, partially offset by improved credit quality in the remainder of the portfolio. Net loan charge-offs were $100 million, or 0.21 percent of average loans, for 2015, an increase of $75 million compared to 2014, primarily reflecting increases in Energy, general Middle Market (largely due to an increase in charge-offs on energy-related loans), Small Business, Corporate Banking and Technology and Life Sciences, partially offset by a decrease in Private Banking. |
| |
| • | Noninterest income increased $182 million or 21 percent, in 2015, compared to 2014. Excluding a $181 million impact from a change in accounting presentation for a card program, noninterest income increased $1 million. Increases in card fees, service charges on deposit accounts and fiduciary income were largely offset by lower investment banking income, lower fee income on certain categories impacted by regulatory changes and decreases in several non-fee categories. |
| |
| • | Noninterest expenses increased $216 million, or 13 percent, in 2015, compared to 2014. Excluding the $181 million impact from a change in accounting presentation for a card program and the benefit to 2015 from the release of $33 million of litigation reserves in the second and third quarters, noninterest expenses increased $68 million, or 4 percent, primarily due to increases in technology and regulatory expenses, outside processing fees and pension expense, partially offset by cost savings realized in 2015 from certain actions taken in the second half of 2014. |
| |
| • | The quarterly dividend was increased to 21 cents per share, or 5 percent, in April 2015. |
| |
| • | The Corporation repurchased approximately 5.1 million shares and 500,000 warrants in 2015 under the equity repurchase program. Together with dividends of $0.83 per share, $389 million, or 75 percent of 2015 net income, was returned to shareholders. |
2016 OUTLOOK
Management expectations for 2016, compared to 2015, assuming a continuation of the current economic and low-rate environment, are as follows:
| |
| • | Average loans modestly higher, in line with Gross Domestic Product growth, reflecting a continued decline in Energy more than offset by increases in most other lines of business. |
| |
| • | Net interest income higher, reflecting the benefits from the December 2015 short-term rate increase, loan growth and a larger securities portfolio more than offsetting higher funding costs. |
| |
| ◦ | Full-year benefit from the December rise in short-term rates expected to be more than $90 million if deposit prices remain at current levels. |
| |
| • | Provision for credit losses higher, with an estimated impact of $75 million to $125 million for energy and energy-related exposure, recognized primarily in the first quarter. Continued improvements in the remainder of the portfolio provide a partial offset. |
| |
| ◦ | Net charge-offs in line with historical normal levels. |
| |
| • | Noninterest income modestly higher, primarily due to growth in card fees from merchant processing services, government card and commercial card. Continued focus on cross-sell opportunities, including wealth management products such as fiduciary and brokerage services. |
| |
| • | Noninterest expenses higher, reflecting continued increases in technology costs and regulatory expenses, increased outside processing in line with growing revenue, higher FDIC insurance expense due to recent regulatory proposal, and typical inflationary pressures. Additionally, 2015 benefited from a $33 million legal reserve release, which is offset by lower pension expense in 2016. |
| |
| • | Income tax expense to approximate 32 percent of pre-tax income. |
RESULTS OF OPERATIONS
The following provides a comparative discussion of the Corporation's consolidated results of operations for 2015 compared to 2014. A comparative discussion of results for 2014 compared to 2013 is provided at the end of this section. For a discussion of the Critical Accounting Policies that affect the Consolidated Results of Operations, see the "Critical Accounting Policies" section of this Financial Review.
ANALYSIS OF NET INTEREST INCOME - Fully Taxable Equivalent (FTE)
|
| | | | | | | | | | | | | | | | | | | | | | | | | | |
| (dollar amounts in millions) | | | | | | | |
| Years Ended December 31 | 2015 | | 2014 | | 2013 |
| | Average Balance | Interest | Average Rate | | Average Balance | Interest | Average Rate | | Average Balance | Interest | Average Rate |
| Commercial loans | $ | 31,501 |
| $ | 966 |
| 3.07 | % | | $ | 29,715 |
| $ | 927 |
| 3.12 | % | | $ | 27,971 |
| $ | 917 |
| 3.28 | % |
| Real estate construction loans | 1,884 |
| 66 |
| 3.48 |
| | 1,909 |
| 65 |
| 3.41 |
| | 1,486 |
| 57 |
| 3.85 |
|
| Commercial mortgage loans | 8,697 |
| 296 |
| 3.41 |
| | 8,706 |
| 327 |
| 3.75 |
| | 9,060 |
| 372 |
| 4.11 |
|
| Lease financing | 783 |
| 25 |
| 3.17 |
| | 834 |
| 19 |
| 2.33 |
| | 847 |
| 27 |
| 3.23 |
|
| International loans | 1,441 |
| 51 |
| 3.58 |
| | 1,376 |
| 50 |
| 3.65 |
| | 1,275 |
| 48 |
| 3.74 |
|
| Residential mortgage loans | 1,878 |
| 71 |
| 3.77 |
| | 1,778 |
| 68 |
| 3.82 |
| | 1,620 |
| 66 |
| 4.09 |
|
| Consumer loans | 2,444 |
| 80 |
| 3.26 |
| | 2,270 |
| 73 |
| 3.20 |
| | 2,153 |
| 71 |
| 3.30 |
|
| Total loans (a) (b) | 48,628 |
| 1,555 |
| 3.20 |
| | 46,588 |
| 1,529 |
| 3.28 |
| | 44,412 |
| 1,558 |
| 3.51 |
|
| | | | | | | | | | | | |
| Mortgage-backed securities | 9,113 |
| 202 |
| 2.24 |
| | 8,970 |
| 209 |
| 2.33 |
| | 9,246 |
| 213 |
| 2.33 |
|
| Other investment securities | 1,124 |
| 14 |
| 1.25 |
| | 380 |
| 2 |
| 0.45 |
| | 391 |
| 2 |
| 0.48 |
|
| Total investment securities (c) | 10,237 |
| 216 |
| 2.13 |
| | 9,350 |
| 211 |
| 2.26 |
| | 9,637 |
| 215 |
| 2.25 |
|
| | | | | | | | | | | | |
| Interest-bearing deposits with banks | 6,158 |
| 16 |
| 0.26 |
| | 5,513 |
| 14 |
| 0.26 |
| | 4,930 |
| 13 |
| 0.26 |
|
| Other short-term investments | 106 |
| 1 |
| 0.81 |
| | 109 |
| — |
| 0.57 |
| | 112 |
| 1 |
| 1.22 |
|
| Total earning assets | 65,129 |
| 1,788 |
| 2.75 |
| | 61,560 |
| 1,754 |
| 2.85 |
| | 59,091 |
| 1,787 |
| 3.03 |
|
| | | | | | | | | | | | |
| Cash and due from banks | 1,059 |
| | | | 934 |
| | | | 987 |
| | |
| Allowance for loan losses | (621 | ) | | | | (601 | ) | | | | (622 | ) | | |
| Accrued income and other assets | 4,680 |
| | | | 4,443 |
| | | | 4,480 |
| | |
| Total assets | $ | 70,247 |
| | | | $ | 66,336 |
| | | | $ | 63,936 |
| | |
| | | | | | | | | | | | |
| Money market and interest-bearing checking deposits | $ | 24,073 |
| 26 |
| 0.11 |
| | $ | 22,891 |
| 24 |
| 0.11 |
| | $ | 21,704 |
| 28 |
| 0.13 |
|
| Savings deposits | 1,841 |
| — |
| 0.02 |
| | 1,744 |
| 1 |
| 0.03 |
| | 1,657 |
| 1 |
| 0.03 |
|
| Customer certificates of deposit | 4,209 |
| 16 |
| 0.37 |
| | 4,869 |
| 18 |
| 0.36 |
| | 5,471 |
| 23 |
| 0.42 |
|
| Foreign office time deposits (d) | 116 |
| 1 |
| 1.02 |
| | 261 |
| 2 |
| 0.82 |
| | 500 |
| 3 |
| 0.52 |
|
| Total interest-bearing deposits | 30,239 |
| 43 |
| 0.14 |
| | 29,765 |
| 45 |
| 0.15 |
| | 29,332 |
| 55 |
| 0.19 |
|
| Short-term borrowings | 93 |
| — |
| 0.05 |
| | 200 |
| — |
| 0.04 |
| | 211 |
| — |
| 0.07 |
|
| Medium- and long-term debt (e) | 2,905 |
| 52 |
| 1.80 |
| | 2,963 |
| 50 |
| 1.68 |
| | 3,972 |
| 57 |
| 1.45 |
|
| Total interest-bearing sources | 33,237 |
| 95 |
| 0.29 |
| | 32,928 |
| 95 |
| 0.29 |
| | 33,515 |
| 112 |
| 0.33 |
|
| | | | | | | | | | | | |
| Noninterest-bearing deposits | 28,087 |
| | | | 25,019 |
| | | | 22,379 |
| | |
| Accrued expenses and other liabilities | 1,389 |
| | | | 1,016 |
| | | | 1,074 |
| | |
| Total shareholders' equity | 7,534 |
| | | | 7,373 |
| | | | 6,968 |
| | |
| Total liabilities and shareholders' equity | $ | 70,247 |
| | | | $ | 66,336 |
| | | | $ | 63,936 |
| | |
| | | | | | | | | | | | |
| Net interest income/rate spread (FTE) | | $ | 1,693 |
| 2.46 |
| | | $ | 1,659 |
| 2.56 |
| | | $ | 1,675 |
| 2.70 |
|
| | | | | | | | | | | | |
| FTE adjustment (f) | | $ | 4 |
| | | | $ | 4 |
| | | | $ | 3 |
| |
| | | | | | | | | | | | |
| Impact of net noninterest-bearing sources of funds | | | 0.14 |
| | | | 0.14 |
| | | | 0.14 |
|
| Net interest margin (as a percentage of average earning assets) (FTE) (a) (c) | | | 2.60 | % | | | | 2.70 | % | | | | 2.84 | % |
| |
| (a) | Accretion of the purchase discount on the acquired loan portfolio of $7 million, $34 million and $49 million increased the net interest margin by 1 basis point, 6 basis points and 8 basis points in 2015, 2014 and 2013, respectively. |
| |
| (b) | Nonaccrual loans are included in average balances reported and in the calculation of average rates. |
| |
| (c) | Includes investment securities available-for-sale and investment securities held-to-maturity. Average rate based on average historical cost. Carrying value exceeded average historical cost by $100 million, $12 million and $92 million in 2015, 2014 and 2013, respectively. |
| |
| (d) | Includes substantially all deposits by foreign depositors; deposits are primarily in excess of $100,000. |
| |
| (e) | Medium- and long-term debt average balances included $160 million, $192 million and $274 million in 2015, 2014 and 2013, respectively, for the gain attributed to the risk hedged with interest rate swaps. Interest expense on medium-and long-term debt was reduced by $70 million in 2015 and $72 million in both 2014 and 2013, for the net gains on these fair value hedge relationships. |
| |
| (f) | The FTE adjustment is computed using a federal tax rate of 35%. |
RATE/VOLUME ANALYSIS - FTE
|
| | | | | | | | | | | | | | | | | | | | | | | | | |
| (in millions) | | | | | | | |
| Years Ended December 31 | 2015/2014 | | 2014/2013 |
| | Increase (Decrease) Due to Rate | Increase (Decrease) Due to Volume (a) | Net Increase (Decrease) | | Increase (Decrease) Due to Rate | Increase (Decrease) Due to Volume (a) | Net Increase (Decrease) |
| Interest Income (FTE): | | | | | | | | | | | | | |
| Commercial loans | $ | (15 | ) | | $ | 54 |
| | $ | 39 |
| | | $ | (45 | ) | | $ | 55 |
| | $ | 10 |
| |
| Real estate construction loans | 2 |
| | (1 | ) | | 1 |
| | | (6 | ) | | 14 |
| | 8 |
| |
| Commercial mortgage loans | (31 | ) | | — |
| | (31 | ) | | | (32 | ) | | (13 | ) | | (45 | ) | |
| Lease financing | 8 |
| | (2 | ) | | 6 |
| | | (8 | ) | | — |
| | (8 | ) | |
| International loans | (1 | ) | | 2 |
| | 1 |
| | | (1 | ) | | 3 |
| | 2 |
| |
| Residential mortgage loans | (1 | ) | | 4 |
| | 3 |
| | | (4 | ) | | 6 |
| | 2 |
| |
| Consumer loans | 1 |
| | 6 |
| | 7 |
| | | (2 | ) | | 4 |
| | 2 |
| |
| Total loans | (37 | ) | (b) | 63 |
| | 26 |
| (b) | | (98 | ) | (b) | 69 |
| | (29 | ) | (b) |
| | | | | | | | | | | | | | |
| Mortgage-backed securities | (8 | ) | | 1 |
| | (7 | ) | | | — |
| | (4 | ) | | (4 | ) | |
| Other investment securities | 3 |
| | 9 |
| | 12 |
| | | — |
| | — |
| | — |
| |
| Total investment securities (c) | (5 | ) | | 10 |
| | 5 |
| | | — |
| | (4 | ) | | (4 | ) | |
| | | | | | | | | | | | | | |
| Interest-bearing deposits with banks | — |
| | 2 |
| | 2 |
| | | — |
| | 1 |
| | 1 |
| |
| Other short-term investments | — |
| | 1 |
| | 1 |
| | | (1 | ) | | — |
| | (1 | ) | |
| Total interest income (FTE) | (42 | ) | | 76 |
| | 34 |
| | | (99 | ) | | 66 |
| | (33 | ) | |
| | | | | | | | | | | | | | |
| Interest Expense: | | | | | | | | | | | | | |
| Money market and interest-bearing checking deposits | — |
| | 2 |
| | 2 |
| | | (5 | ) | | 1 |
| | (4 | ) | |
| Savings deposits | (1 | ) | | — |
| | (1 | ) | | | — |
| | — |
| | — |
| |
| Customer certificates of deposit | 1 |
| | (3 | ) | | (2 | ) | | | (3 | ) | | (2 | ) | | (5 | ) | |
| Foreign office time deposits | 1 |
| | (2 | ) | | (1 | ) | | | 1 |
| | (2 | ) | | (1 | ) | |
| Total interest-bearing deposits | 1 |
| | (3 | ) | | (2 | ) | | | (7 | ) | | (3 | ) | | (10 | ) | |
| | | | | | | | | | | | | | |
| Medium- and long-term debt | 3 |
| | (1 | ) | | 2 |
| | | 9 |
| | (16 | ) | | (7 | ) | |
| Total interest expense | 4 |
| | (4 | ) | | — |
| | | 2 |
| | (19 | ) | | (17 | ) | |
| | | | | | | | | | | | | | |
| Net interest income (FTE) | $ | (46 | ) | | $ | 80 |
| | $ | 34 |
| | | $ | (101 | ) | | $ | 85 |
| | $ | (16 | ) | |
| |
| (a) | Rate/volume variances are allocated to variances due to volume. |
| |
| (b) | Reflected decreases of $27 million and $15 million in accretion of the purchase discount on the acquired loan portfolio in 2015 and 2014, respectively. |
| |
| (c) | Includes investment securities available-for-sale and investment securities held-to-maturity. |
NET INTEREST INCOME
Net interest income is the difference between interest earned on assets and interest paid on liabilities. FTE adjustments are made to the yields on tax-exempt assets in order to present tax-exempt income and fully taxable income on a comparable basis. FTE adjustments totaled $4 million in both 2015 and 2014 and $3 million in 2013. Gains and losses related to the effective portion of risk management interest rate swaps that qualify as hedges are included with the interest expense of the hedged item. Net interest income on a FTE basis comprised 62 percent of total revenues in 2015 and 66 percent in both 2014 and 2013. The decrease in 2015 is due to an increase in noninterest income as described under the "Noninterest Income" subheading below. The "Analysis of Net Interest Income-Fully Taxable Equivalent" table of this financial review provides an analysis of net interest income for the years ended December 31, 2015, 2014, and 2013. The rate-volume analysis in the table above details the components of the change in net interest income on a FTE basis for 2015 compared to 2014 and 2014 compared to 2013.
Net interest income was $1.7 billion in 2015, an increase of $34 million compared to 2014. The increase in net interest income resulted primarily from higher earning asset volume, partially offset by lower loan and investment yields, in part due to a $27 million decrease in the accretion of the purchase discount on the acquired loan portfolio and continued pressure on yields from the low-rate environment and changing loan portfolio dynamics. Average earning assets increased $3.6 billion, or 6 percent, primarily reflecting increases of $2.0 billion in average loans, $887 million in average investment securities and $645 million in average interest-bearing deposits with banks. Funding costs remained unchanged with lower interest expense on deposits, primarily due to lower time deposit balances, offset by an increase in interest expense on debt, primarily due to an increase in the portfolio average rate, largely as a result of the impact of maturities and new issues.
The net interest margin (FTE) in 2015 decreased 10 basis points to 2.60 percent, from 2.70 percent in 2014, primarily due to lower loan yields and an increase in average balances deposited with the Federal Reserve Bank (FRB), partially offset by higher average loan balances. The decrease in loan yields primarily reflected unfavorable portfolio dynamics and a decrease in
accretion on the acquired loan portfolio, shifts in the average loan portfolio mix and the impact of a competitive low-rate environment, partially offset by a benefit from an increase in LIBOR rates. Accretion of the purchase discount on the acquired loan portfolio increased the net interest margin by 1 basis point in 2015, compared to 6 basis points in 2014. Average balances deposited with the FRB were $6.0 billion and $5.4 billion in 2015 and 2014, respectively, and are included in "interest-bearing deposits with banks" on the consolidated balance sheets.
The Corporation utilizes various asset and liability management strategies to manage net interest income exposure to interest rate risk. Refer to the "Market and Liquidity Risk" section of this financial review for additional information regarding the Corporation's asset and liability management policies.
PROVISION FOR CREDIT LOSSES
The provision for credit losses was $147 million in 2015, compared to $27 million in 2014. The provision for credit losses includes both the provision for loan losses and the provision for credit losses on lending-related commitments.
The provision for loan losses is recorded to maintain the allowance for loan losses at the level deemed appropriate by the Corporation to cover probable credit losses inherent in the portfolio. The provision for loan losses was $142 million in 2015, an increase of $120 million compared to $22 million in 2014, primarily reflecting increased provisions for Energy and energy-related loans, Technology and Life Sciences, Corporate Banking and Small Business.
Net loan charge-offs in 2015 increased $75 million to $100 million, or 0.21 percent of average total loans, compared to $25 million, or 0.05 percent, in 2014. The increase primarily reflected increases in Energy, general Middle Market (largely due to an increase in charge-offs on energy-related loans), Small Business (primarily due to the charge-off of a single large credit in 2015), Corporate Banking and Technology and Life Sciences, partially offset by an increase in net recoveries in Private Banking.
The provision for credit losses on lending-related commitments is recorded to maintain the allowance for credit losses on lending-related commitments at the level deemed appropriate by the Corporation to cover probable credit losses inherent in lending-related commitments. The provision for credit losses on lending-related commitments was $5 million in both 2015 and 2014. Lending-related commitment charge-offs were $1 million in 2015 and insignificant in 2014.
For further discussion of the allowance for loan losses and the allowance for credit losses on lending-related commitments, including the methodology used in the determination of the allowances and an analysis of the changes in the allowances, refer to Note 1 to the consolidated financial statements and the "Credit Risk" section of this financial review.
NONINTEREST INCOME
|
| | | | | | | | | | | |
| (in millions) | |
| Years Ended December 31 | 2015 | | 2014 | | 2013 |
| Card fees | $ | 290 |
| | $ | 92 |
| | $ | 86 |
|
| Card fees excluding presentation change (a) | 109 |
| | 92 |
| | 86 |
|
| Service charges on deposit accounts | 223 |
| | 215 |
| | 214 |
|
| Fiduciary income | 187 |
| | 180 |
| | 171 |
|
| Commercial lending fees | 99 |
| | 98 |
| | 99 |
|
| Letter of credit fees | 53 |
| | 57 |
| | 64 |
|
| Bank-owned life insurance | 40 |
| | 39 |
| | 40 |
|
| Foreign exchange income | 40 |
| | 40 |
| | 36 |
|
| Brokerage fees | 17 |
| | 17 |
| | 17 |
|
| Net securities losses | (2 | ) | | — |
| | (1 | ) |
| Other noninterest income (b) | 103 |
| | 130 |
| | 156 |
|
| Total noninterest income | $ | 1,050 |
| | $ | 868 |
| | $ | 882 |
|
| Total noninterest income excluding presentation change (a) | $ | 869 |
| | $ | 868 |
| | $ | 882 |
|
| |
| (a) | Effective January 1, 2015, contractual changes to a card program resulted in a change to the accounting presentation of the related revenues and expenses. The effect of this change was an increase of $181 million to card fees in 2015. The Corporation believes that this information will assist investors, regulators, management and others in comparing results to prior periods. |
| |
| (b) | The table below provides further details on certain categories included in other noninterest income. |
Noninterest income increased $182 million to $1.1 billion in 2015, compared to $868 million in 2014. Excluding the $181 million impact of the change in accounting presentation on card fees as described in footnote (a) to the above table, noninterest income increased $1 million. An analysis of significant year over year changes by individual line item follows.
Card fees consist primarily of interchange and other fees earned on government card programs, commercial cards and debit/ATM cards, as well as, beginning in 2015, fees from providing merchant payment processing services. Card fees increased $198 million to $290 million in 2015, compared to $92 million in 2014. Two significant developments impacted the comparability of card fees between 2014 and 2015. First, as referenced in footnote (a) to the table above, the Corporation entered into a new
contract for an existing government card program effective January 1, 2015. Changes to the terms of the contract resulted in a change to the presentation of the related revenue and expenses. In 2015, under the current contract, total revenue before related expenses was recorded in card fees, and related expenses were recorded in outside processing fee expense; whereas in 2014, under the terms of the prior contract, revenue was recorded in card fees net of the related expenses. The impact of this presentation change was a $181 million increase to card fees in 2015. Second, the Corporation changed its business model for providing merchant payment processing services. Previously, the Corporation's merchant payment processing revenue was earned through a joint venture, and the revenue was recorded in other noninterest income net of related expenses. The Corporation's participation in the joint venture concluded in the second quarter 2015. The net revenue from the joint venture included in other noninterest income was $3 million in 2015, compared to $14 million in 2014. The Corporation now directly enters into agreements with its merchant customers and records merchant services revenue in card fees ($17 million in 2015, zero in 2014) before the related expenses. A third party processes the transactions, and such processing expenses are recorded in outside processing fee expense ($16 million in 2015, $1 million in 2014, both years include start-up expenses). After adjusting for the $181 million impact of the contractual change to a government card program and the $17 million impact from the change to the Corporation's business model for providing merchant payment processing services, card fees were stable. For further information about the impact of the change to the merchant payment processing business model, refer to the "other noninterest income" discussion below and the "outside processing fee expense" discussion under the "Noninterest Expenses" subheading that follows.
Service charges on deposit accounts increased $8 million, or 4 percent, to $223 million in 2015, compared to $215 million in 2014. The increase in 2015 was primarily due to an increase in commercial service charges.
Fiduciary income increased $7 million, or 4 percent, to $187 million in 2015, compared to $180 million in 2014. Personal trust fees, institutional trust fees and investment advisory fees are the three major components of fiduciary income. These fees are based on services provided, assets under management and assets under administration. Fluctuations in the market values of the underlying assets managed or administered, which include both equity and fixed income securities, and net asset flows within client accounts, impact fiduciary income. The increase in 2015 was primarily due to an increase in investment advisory fees, largely driven by net asset inflows, as brokerage clients continue to transition from transactional services to investment advisory services, and the favorable impact on fees from market value increases.
Letter of credit fees decreased $4 million, or 7 percent, to $53 million in 2015, compared to $57 million in 2014. The decrease in 2015 was primarily due to regulatory-driven decreases in the volume of letters of credit outstanding.
Other noninterest income decreased $27 million, or 21 percent, to $103 million in 2015, compared to $130 million in 2014. The following table illustrates certain categories included in "other noninterest income" on the consolidated statements of income.
|
| | | | | | | | | | | | |
| (in millions) | | | | |
| Years Ended December 31 | | 2015 | | 2014 | | 2013 |
| Customer derivative income | | $ | 18 |
| | $ | 22 |
| | $ | 25 |
|
| Investment banking fees | | 12 |
| | 18 |
| | 19 |
|
| Insurance commissions | | 10 |
| | 13 |
| | 14 |
|
| Securities trading income | | 9 |
| | 9 |
| | 14 |
|
| Income from principal investing and warrants | | 6 |
| | 10 |
| | 14 |
|
| Income from unconsolidated subsidiaries | | 2 |
| | 8 |
| | 10 |
|
| Deferred compensation asset returns (a) | | — |
| | 6 |
| | 13 |
|
| All other noninterest income | | 46 |
| | 44 |
| | 47 |
|
| Other noninterest income | | $ | 103 |
| | $ | 130 |
| | $ | 156 |
|
| |
| (a) | Compensation deferred by the Corporation's officers and directors is invested based on investment selections of the officers and directors. Income earned on these assets is reported in noninterest income and the offsetting change in liability is reported in salaries and benefits expense. |
The decrease in other noninterest income primarily reflected decreases in investment banking fees, income from unconsolidated subsidiaries and deferred compensation plan asset returns. The decline in investment banking fees was largely due to decreased activity in the energy markets. Income from unconsolidated subsidiaries reflected the decrease of $11 million in income from the merchant payment processing joint venture that concluded in the second quarter 2015, as described further in the discussion of "card fees" above, partially offset by a decrease in tax credit investment amortization expense. The decrease in deferred compensation asset returns was offset by a decrease in deferred compensation expense in salaries and benefits expense.
NONINTEREST EXPENSES
|
| | | | | | | | | | | |
| (in millions) | |
| Years Ended December 31 | 2015 | | 2014 | | 2013 |
| Salaries and benefits expense | 1,009 |
| | 980 |
| | 1,009 |
|
| Outside processing fee expense | 332 |
| | 122 |
| | 119 |
|
| Outside processing fee expense excluding presentation change (a) | 151 |
| | 122 |
| | 119 |
|
| Net occupancy expense | 159 |
| | 171 |
| | 160 |
|
| Equipment expense | 53 |
| | 57 |
| | 60 |
|
| Software expense | 99 |
| | 95 |
| | 90 |
|
| FDIC insurance expense | 37 |
| | 33 |
| | 33 |
|
| Advertising expense | 24 |
| | 23 |
| | 21 |
|
| Litigation-related expense | (32 | ) | | 4 |
| | 52 |
|
| Gain on debt redemption | — |
| | (32 | ) | | (1 | ) |
| Other noninterest expenses | 161 |
| | 173 |
| | 179 |
|
| Total noninterest expenses | $ | 1,842 |
| | $ | 1,626 |
| | $ | 1,722 |
|
| Total noninterest expenses excluding presentation change (a) | $ | 1,661 |
| | $ | 1,626 |
| | $ | 1,722 |
|
| |
| (a) | Effective January 1, 2015, contractual changes to a card program resulted in a change to the accounting presentation of the related revenues and expenses. The effect of this change was an increase of $181 million to outside processing fee expense in 2015. The Corporation believes that this information will assist investors, regulators, management and others in comparing results to prior periods. |
Noninterest expenses increased $216 million to $1.8 billion in 2015, compared to $1.6 billion in 2014. Excluding the $181 million impact of the change in accounting presentation on outside processing fees as described in footnote (a) to the above table, noninterest expenses increased $35 million, or 2 percent, in 2015. Included in the $35 million increase was a $15 million increase in outside processing expense associated with the change in the Corporation's business model for providing merchant payment processing services, as previously described under the "Noninterest Income" subheading above and further discussed below. An analysis of significant increases and decreases by individual line item is presented below.
Salaries and benefits expense increased $29 million, or 3 percent, to $1.0 billion in 2015, compared to $980 million in 2014. The increase in salaries and benefits expense primarily reflected an increase in technology-related contract labor expenses, the impact of merit increases and higher defined benefit pension expense, partially offset by decreases in deferred compensation plan expense and lower severance and executive incentive compensation expense. An $8 million increase in pension expense was primarily due to the impact of changes to plan assumptions, including a decrease in the discount rate and a change in mortality assumptions, partially offset by the benefit of a $350 million contribution to the pension plan in the December 2014. The Corporation's incentive programs are designed to reward performance and provide market competitive total compensation opportunity. Business unit incentives are tied to various financial and strategic business objectives, while executive incentives are tied to the Corporation's overall performance and peer-based comparisons of results.
Outside processing fee expense increased $210 million to $332 million in 2015, compared to $122 million in 2014. Excluding the $181 million impact of the above-described change in accounting presentation, outside processing fee expense increased $29 million, or 24 percent, compared to 2014. The increase was primarily due to a $15 million increase in third-party processing expenses associated with the change in the Corporation's business model for providing merchant payment processing services, including up-front costs incurred for converting customers to the new vendor providing the services, as well as an increase associated with a retirement savings program and smaller increases in other outside processing expenses related to revenue-generating activities. Under the previous joint venture business model for merchant services, revenue was recorded net of related expenses, whereas under the new business model, expenses are recorded in outside processing fees.
Net occupancy and equipment expense decreased $16 million, or 7 percent, to $212 million in 2015, compared to $228 million in 2014. The decrease was primarily the result of lease termination charges of $10 million taken in 2014 as well as the 2015 benefit from those real estate optimization actions.
Litigation-related expense decreased $36 million in 2015, reflecting the release of $33 million of litigation reserves in the second and third quarters of 2015. For further information about legal proceedings, refer to Note 21 to the consolidated financial statements.
The Corporation recognized a gain on debt redemption of $32 million in 2014, on the early redemption of a $150 million subordinated note in the third quarter 2014, primarily from the recognition of the unamortized value of a related, previously terminated interest rate swap.
Other noninterest expenses decreased $12 million, or 7 percent, to $161 million in 2015, from $173 million in 2014, primarily reflecting a decrease in contributions to the Comerica Charitable Foundation in 2015.
INCOME TAXES AND RELATED ITEMS
The provision for income taxes was $229 million in 2015, compared to $277 million in 2014. The $48 million decrease in the provision for income taxes in 2015, compared to 2014, was due primarily to the decrease in pretax income as well as a $5 million tax benefit from the early termination of certain leveraged leases.
Net deferred tax assets were $199 million at December 31, 2015, compared to $130 million at December 31, 2014. The increase of $69 million resulted primarily from decreases in deferred tax liabilities related to lease financing transactions and net unrealized gains on investment securities available-for-sale, as well as an increase deferred tax assets related to the allowance for loan losses. Deferred tax assets of $429 million were evaluated for realization and it was determined that a valuation allowance of $3 million, related to state net operating loss carryforwards, was needed at December 31, 2015. There was no valuation allowance at December 31, 2014. These conclusions were based on available evidence of loss carryback capacity, projected future reversals of existing taxable temporary differences and assumptions made regarding future events.
2014 RESULTS OF OPERATIONS COMPARED TO 2013
Net interest income was $1.7 billion in 2014, a decrease of $17 million compared to 2013. The decrease in net interest income in 2014 resulted primarily from a $15 million decrease in the accretion of the purchase discount on the acquired loan portfolio. The benefits from a $2.5 billion, or 4 percent, increase in average earning assets and lower funding costs were offset by lower loan yields. The increase in average earning assets primarily reflected increases of $2.2 billion in average loans and $583 million in average interest-bearing deposits with banks, partially offset by a decrease of $287 million in average investment securities.
The net interest margin (FTE) in 2014 decreased 14 basis points to 2.70 percent, from 2.84 percent in 2013, primarily from decreased yields on loans and an increase in lower yielding FRB deposits, partially offset by lower deposit rates. The decrease in loan yields reflected the impact of a competitive rate environment, a decrease in accretion on the acquired loan portfolio, positive credit quality migration throughout the portfolio, lower LIBOR rates and the impact of a $9 million residual value adjustment to assets in the leasing portfolio. Accretion of the purchase discount on the acquired loan portfolio increased the net interest margin by 6 basis points in 2014, compared to 8 basis points in 2013. Average balances deposited with the FRB were $5.4 billion and $4.8 billion in 2014 and 2013, respectively, and are included in "interest-bearing deposits with banks" on the consolidated balance sheets. The "Analysis of Net Interest Income - Fully Taxable Equivalent (FTE)" and "Rate/Volume Analysis - FTE" tables under the "Net Interest Income" subheading in this section above provide an analysis of net interest income (FTE) for 2014 and 2013 and details the components of the change in net interest income on a FTE basis for 2014 compared to 2013.
The provision for credit losses, which includes both the provision for loan losses and the provision for credit losses on lending-related commitments, was $27 million in 2014, compared to $46 million in 2013. The provision for loan losses was $22 million in 2014 compared to $42 million in 2013. Credit quality in the loan portfolio continued to improve in 2014, compared to 2013. Improvements in credit quality included a decline of $367 million in the Corporation's criticized loan list from 2013 to 2014. Reflected in the decline in criticized loans was a decrease in nonaccrual loans of $77 million. Net loan charge-offs in 2014 decreased $48 million to $25 million, or 0.05 percent of average total loans, compared to $73 million, or 0.16 percent, in 2013. The $48 million decrease in net loan charge-offs in 2014, compared to 2013, reflected decreases in almost all business lines, with the largest decreases in Commercial Real Estate and general Middle Market, partially offset by an increase in Technology and Life Sciences. The provision for credit losses on lending-related commitments was $5 million in 2014, compared to $4 million in 2013. Lending-related commitment charge-offs were insignificant in 2014 and 2013.
Noninterest income decreased $14 million to $868 million in 2014, compared to $882 million in 2013. Fiduciary income increased $9 million, or 6 percent in 2014, primarily due to an increase in personal trust fees, largely driven by an increase in the volume of fiduciary services sold and the favorable impact on fees of market value increases. Card fees increased $6 million, or 6 percent in 2014, primarily reflecting a volume-driven increase in commercial charge card interchange revenue. Letter of credit fees decreased $7 million, or 12 percent in 2014, primarily due to regulatory-driven decreases in the volume of letters of credit outstanding. Foreign exchange income increased $4 million, or 9 percent, in 2014, primarily due to an increase in customer trading volume throughout the year. Other noninterest income decreased $26 million, or 16 percent, in 2014, compared to 2013. The decrease primarily reflected decreases in deferred compensation plan asset returns, income recognized from the Corporation's third-party credit card provider, securities trading income and income from principal investing and warrants. The decrease in deferred compensation plan asset returns was offset by a decrease in deferred compensation expense in salaries and benefits expense. The decrease in income from the Corporation's third-party credit card provider was primarily the result of a change in the timing of the recognition of incentives from annually to quarterly in 2013. Refer to the table provided under the "Noninterest Income" subheading previously in this section for the details of certain categories included in other noninterest income.
Noninterest expenses decreased $96 million, or 2 percent, in 2014, compared to 2013. Salaries and benefits expense decreased $29 million, or 3 percent, in 2014, primarily due to decreases in pension and deferred compensation expense, partially offset by the impact of merit increases and an increase in technology-related contract labor expense. Net occupancy and equipment
expense increased $8 million, or 4 percent, in 2014, primarily the result of lease termination charges of $10 million taken in 2014 related to real estate optimization. Software expense increased $5 million, or 6 percent, in 2014, primarily due to an increase in amortization expense as a result of the completion of technology projects throughout the year. Litigation-related expenses decreased $48 million in 2014, primarily as a result of the recognition of a $52 million unfavorable jury verdict on a lender liability case in 2013. The Corporation recognized a gain on debt redemption of $32 million in 2014 on the early redemption of a $150 million subordinated note, primarily from the recognition of the unamortized value of a related, previously terminated interest rate swap. Other noninterest expenses decreased $6 million, or 4 percent, in 2014, primarily reflecting decreases of $5 million in other real estate expense and $5 million in losses on other foreclosed property, partially offset by an increase of $9 million in charitable contributions to the Comerica Charitable Foundation in 2014.
The provision for income taxes increased $32 million to $277 million in 2014, primarily due to an increase in pretax income.
STRATEGIC LINES OF BUSINESS
The Corporation's operations are strategically aligned into three major business segments: the Business Bank, the Retail Bank and Wealth Management. These business segments are differentiated based upon the products and services provided. In addition to the three major business segments, Finance is also reported as a segment. The Other category includes items not directly associated with these business segments or the Finance segment. The performance of the business segments is not comparable with the Corporation's consolidated results and is not necessarily comparable with similar information for any other financial institution. Additionally, because of the interrelationships of the various segments, the information presented is not indicative of how the segments would perform if they operated as independent entities. Market segment results are also provided for the Corporation's three primary geographic markets: Michigan, California and Texas. In addition to the three primary geographic markets, Other Markets is also reported as a market segment. Note 22 to the consolidated financial statements describes the Corporation's segment reporting methodology as well as the business activities of each business segment and presents financial results of these business segments for the years ended December 31, 2015, 2014 and 2013.
The Corporation's management accounting system assigns balance sheet and income statement items to each segment using certain methodologies, which are regularly reviewed and refined. These methodologies may be modified as the management accounting system is enhanced and changes occur in the organizational structure and/or product lines.
In the second quarter 2014, the Corporation enhanced the approach used to determine the standard reserve factors used in estimating the allowance for credit losses, which had the effect of capturing certain elements in the standard reserve component that had formerly been included in the qualitative assessment. The impact of the change was largely neutral to the total allowance for loan losses. However, because standard reserves are allocated to the segments at the loan level, while qualitative reserves are allocated at the portfolio level, the impact of the methodology change on the allowance of each segment reflected the characteristics of the individual loans within each segment's portfolio, causing segment reserves to increase or decrease accordingly. As a result, the current year provision for credit losses within each segment is not comparable to prior year amounts.
BUSINESS SEGMENTS
The following table presents net income (loss) by business segment.
|
| | | | | | | | | | | | | | | | | | | | |
| (dollar amounts in millions) | | | | | |
| Years Ended December 31 | 2015 | | 2014 | | 2013 |
| Business Bank | $ | 765 |
| | 85 | % | | $ | 822 |
| | 86 | % | | $ | 799 |
| | 87 | % |
| Retail Bank | 47 |
| | 5 |
| | 44 |
| | 5 |
| | 36 |
| | 4 |
|
| Wealth Management | 85 |
| | 10 |
| | 84 |
| | 9 |
| | 79 |
| | 9 |
|
| | 897 |
| | 100 | % | | 950 |
| | 100 | % | | 914 |
| | 100 | % |
| Finance | (375 | ) | | | | (357 | ) | | | | (376 | ) | | |
| Other (a) | (1 | ) | | | | — |
| | | | 3 |
| | |
| Total | $ | 521 |
| | | | $ | 593 |
| | | | $ | 541 |
| | |
(a) Includes items not directly associated with the three major business segments or the Finance Division.
The Business Bank's net income of $765 million in 2015 decreased $57 million, compared to $822 million in 2014. Net interest income (FTE) of $1.5 billion increased $4 million in 2015, primarily the result of the benefit from an increase in average loans of $1.7 billion and the funds transfer pricing (FTP) benefit from a $2.4 billion increase in average deposits, partially offset by a decrease in accretion of the purchase discount on the acquired loan portfolio, lower loan yields and a lower FTP crediting rate. The increase in average loans primarily reflected increases in Technology and Life Sciences, Mortgage Banker Finance, National Dealer Services and Commercial Real Estate, partially offset by a decrease in Corporate Banking. Average deposits increased in nearly all lines of business, with the largest increases in general Middle Market, Technology and Life Sciences, Corporate Banking and Commercial Real Estate. The provision for credit losses increased $102 million, to $158 million in 2015, compared to the prior year. The increase in the provision primarily reflected increased reserves for loans related to energy, as a result of stress in the energy and energy-related portfolio as a result of sustained lower energy prices. Corporate Banking and Technology and Life Sciences also contributed to the increase in the provision. These increases were partially offset by improvements in credit quality in the remainder of the portfolio. Net loan charge-offs of $89 million increased $73 million in 2015, compared to 2014, primarily reflecting increases in Energy, general Middle Market (largely due to an increase in charge-offs on energy-related loans), Corporate Banking and Technology and Life Sciences. Excluding the $181 million impact of the change in accounting presentation on card fees as described under the "Noninterest Income" subheading in the "Results of Operations" section of this financial review, noninterest income of $393 million in 2015 increased $1 million from the prior year, primarily reflecting a $13 million increase in card fees, partially offset by a $6 million decrease in income from unconsolidated subsidiaries and a $6 million decrease in investment banking fees, largely for the same reasons as previously discussed under the "Noninterest Income" subheading in the "Results of Operations" section of this financial review. Also excluding the impact of the change in accounting presentation for a card program, noninterest expenses of $605 million in 2015 increased $16 million compared to the prior year, primarily due to a $17 million increase in outside processing expenses, largely due to the increase in third-party
processing expenses associated with the change to the Corporation's business model for providing merchant payment processing services, a $22 million increase in corporate overhead and a $4 million increase in salaries and benefits expense, primarily reflecting the impact of merit increases, largely offset by a $31 million decrease in litigation-related expense. The increase in corporate overhead expense was largely the result of increases in technology costs and regulatory expenses. Refer to the "Noninterest Expenses" subheading in the "Results of Operations" section of this financial review for further discussion of the change to the Corporation's business model for providing merchant payment processing services.
Net income for the Retail Bank of $47 million in 2015 increased $3 million, compared to $44 million in 2014. Net interest income (FTE) of $626 million increased $20 million in 2015, primarily due to the benefit provided by a $207 million increase in average loans, the FTP benefit provided by a $909 million increase in average deposits and lower deposit rates, partially offset by a lower FTP crediting rate and a decrease in accretion of the purchase discount on the acquired loan portfolio. The provision for credit losses was $8 million in 2015, compared to a benefit of $7 million in 2014, primarily reflecting a large provision in 2015 for a single credit in Small Business. Net loan charge-offs of $28 million in 2015 increased $18 million, compared to $10 million in 2014, mostly due to a charge-off of the same single credit in Small Business. The provision and charge-off in Small Business resulted from irregularities associated with a single customer loan relationship discovered in the first quarter 2016. Noninterest income of $185 million in 2015 increased $16 million compared to 2014, primarily due to a $9 million increase in revenue related to a retirement savings program and smaller increases in several other fee categories. The increase in revenue related to a retirement savings program was offset by a related $9 million increase in outside processing fees in noninterest expense. Noninterest expenses of $734 million in 2015 increased $19 million from the prior year, primarily due to a $13 million increase in outside processing expenses, mostly related to the retirement savings program and smaller increases related to other revenue-generating activities; and a $4 million increase in salaries and benefits expense, primarily reflecting the impact of merit increases.
Wealth Management's net income of $85 million in 2015 increased $1 million, compared to $84 million in 2014. Net interest income (FTE) of $179 million in 2015 decreased $2 million compared to 2014, primarily reflecting an increase in FTP funding charges and lower loan yields, partially offset by the benefit from a $148 million increase in average loans and the FTE benefit provided by a $346 million increase in average deposits. The provision for credit losses was a benefit of $20 million in 2015, compared to a benefit of $21 million in 2014. Net loan recoveries were $17 million in 2015, compared to net recoveries of $1 million in 2014. Noninterest income of $235 million decreased $6 million from the prior year, primarily reflecting a $4 million decrease resulting from securities losses of $2 million in 2015 compared to securities gains of $2 million in 2014, and small decreases in several other categories of noninterest income, partially offset by a $7 million increase in fiduciary income. Noninterest expenses of $305 million in 2015 decreased $5 million from the prior year, primarily due to a $5 million decrease in litigation-related expenses.
The net loss in the Finance segment was $375 million in 2015, compared to a net loss of $357 million in 2014. Net interest expense (FTE) of $632 million in 2015 decreased $30 million, compared to 2014, primarily reflecting a decrease in net FTP expense as a result of lower net rates paid to the business segments under the Corporation's internal FTP methodology. Noninterest income of $57 million in 2015 decreased $3 million compared to 2014, primarily due to a $4 million decrease in customer derivative income. An increase in noninterest expenses of $30 million in 2015 was primarily the result of the third quarter 2014 gain of $32 million on the early redemption of debt.
MARKET SEGMENTS
The table and narrative below present the market segment results, including prior periods, based on the structure and methodologies in effect at December 31, 2015. Note 22 to these consolidated financial statements presents a description of each of these market segments as well as the financial results for the years ended December 31, 2015, 2014 and 2013.
The following table presents net income (loss) by market segment.
|
| | | | | | | | | | | | | | | | | | | | |
| (dollar amounts in millions) | | | | | |
| Years Ended December 31 | 2015 | | 2014 | | 2013 |
| Michigan | $ | 325 |
| | 36 | % | | $ | 288 |
| | 30 | % | | $ | 252 |
| | 28 | % |
| California | 297 |
| | 33 |
| | 274 |
| | 29 |
| | 270 |
| | 29 |
|
| Texas | 79 |
| | 9 |
| | 168 |
| | 18 |
| | 183 |
| | 20 |
|
| Other Markets | 196 |
| | 22 |
| | 220 |
| | 23 |
| | 209 |
| | 23 |
|
| | 897 |
| | 100 | % | | 950 |
| | 100 | % | | 914 |
| | 100 | % |
| Finance & Other (a) | (376 | ) | | | | (357 | ) | | | | (373 | ) | | |
| Total | $ | 521 |
| | | | $ | 593 |
| | | | $ | 541 |
| | |
The Michigan market's net income of $325 million in 2015 increased $37 million, compared to net income of $288 million in 2014. Net interest income (FTE) of $720 million in 2015 increased $2 million, primarily due to the FTP benefit provided by a $849 million increase in average deposits and lower deposit rates, partially offset by lower loan yields, the impact of a $156 million
decrease in average loans and a lower FTP crediting rate. The increase in average deposits primarily reflected increases in general Middle Market, Personal Banking and Small Business. The decrease in average loans resulted primarily from decreases in general Middle Market, Corporate Banking and Private Banking, partially offset by an increase in National Dealer Services. The provision for credit losses was a benefit of $27 million in 2015, an increase of $5 million compared to a benefit of $32 million in the prior year. Net loan charge-offs of $8 million for 2015 were unchanged from the prior year, primarily reflecting increases in general Middle Market and Corporate Banking, offset by decreases in Commercial Real Estate, Small Business and Private Banking. Noninterest income of $333 million in 2015 decreased $12 million from 2014, primarily reflecting decreases of $5 million in income from unconsolidated subsidiaries, $4 million in letter of credit fees, $4 million in customer derivative income and small decreases in several other noninterest income categories, partially offset by an $8 million increase in card fees. The changes in income from unconsolidated subsidiaries and card fees were primarily driven by the change to the Corporation's business model for providing merchant payment processing services. For further information about the business model change, refer to the "Noninterest Income" subheading in the "Results of Operations" section of this financial review. Noninterest expenses of $598 million in 2015 decreased $45 million from the prior year, primarily reflecting a $34 million decrease in litigation-related expenses, a $5 million gain on the disposal of fixed assets and small decreases in several noninterest expense categories, partially offset by an $8 million increase in outside processing expense, largely due to an increase in third-party processing expenses associated with the change to the Corporation's business model for providing merchant payment processing services. Refer to the "Noninterest Expenses" subheading in the "Results of Operations" section of this financial review for further discussion of the change to the Corporation's business model for providing merchant payment processing services.
The California market's net income of $297 million increased $23 million in 2015, compared to $274 million in 2014. Net interest income (FTE) of $736 million for 2015 increased $14 million from the prior year, primarily due to the benefit provided by a $1.2 billion increase in average loans and the FTP benefit provided by a $1.6 billion increase in average deposits, partially offset by a lower FTP crediting rate and lower loan yields. The increase in average loans and deposits both reflected increases in nearly all lines of business, with the largest increases in Technology and Life Sciences, National Dealer Services, and Commercial Real Estate. The provision for credit losses of $17 million in 2015 decreased $11 million from the prior year. An increase in the provision related to an increase in reserves for Technology and Life Sciences was more than offset by improvements in credit quality in the remainder of the portfolio. Net loan charge-offs of $18 million in 2015 decreased $4 million compared to 2014, primarily reflecting decreases in Private Banking and Corporate Banking. Noninterest income of $153 million in 2015 increased $6 million from the prior year, primarily due to a $4 million increase in card fees, which was largely driven by the change to the Corporation's business model for providing merchant payment processing services, and a $4 million increase in service charges on deposits, partially offset by a $5 million decrease in warrant income. For further information about the merchant services business model change, refer to the "Noninterest Income" subheading in the "Results of Operations" section of this financial review. Noninterest expenses of $408 million in 2015 increased $10 million from the prior year, primarily reflecting a $4 million increase in corporate overhead expenses and small increases in several other categories of noninterest expense. See the Business Bank discussion for an explanation of the increase in corporate overhead expense.
The Texas market's net income decreased $89 million to $79 million in 2015, compared to $168 million in 2014. Net interest income (FTE) of $521 million in 2015 decreased $21 million from the prior year, primarily due to a decrease in accretion of the purchase discount on the acquired loan portfolio, lower loan yields and a decrease in net FTP credits due to a lower FTP crediting rate, partially offset by the benefit provided by a $214 million increase in average loans and the FTP benefit provided by a $118 million increase in average deposits. The increase in average loans primarily reflected increases in Energy, Small Business and Private Banking, partially offset by decreases in Corporate Banking and Technology and Life Sciences. The increase in average deposits resulted primarily from increases in Personal Banking, Energy and Small Business, partially offset by decreases in general Middle Market and Technology and Life Sciences. The provision for credit losses of $131 million in 2015 increased $81 million from the prior year, primarily reflecting increased reserves for loans related to energy, partially offset by credit quality improvements in the remainder of the portfolio. Refer to the "Allowance for Credit Losses" and "Energy Lending" subheadings in the Risk Management section of this financial review for a discussion of the impact of sustained low oil and gas prices on the Corporation's portfolio of energy-related loans. Net loan charge-offs of $45 million for 2015 increased $36 million from the prior year, primarily reflecting increases in Energy and general Middle Market (largely due to an increase in charge-offs on energy-related loans). Noninterest income of $133 million in 2015 decreased $9 million from the prior year, primarily due to a $5 million decrease in investment banking fees and small decreases in several other noninterest income categories. Noninterest expenses of $389 million in 2015 increased $19 million from 2014, primarily due to a $9 million increase in corporate overhead expenses and small increases in several other categories of noninterest expense. See the Business Bank discussion for an explanation of the increase in corporate overhead expense.
Net income in Other Markets of $196 million in 2015 decreased $24 million compared to $220 million in 2014. Net interest income (FTE) of $339 million in 2015 increased $27 million from the prior year, primarily due to the benefit from an increase in average loans of $759 million and the FTP benefit provided by a $1.0 billion increase in average deposits, partially offset by the impact of a lower FTP crediting rate. The increase in average loans primarily reflected increases in Mortgage Banker Finance and Technology and Life Sciences. Average deposits increased in nearly all business lines, with the largest increases in
Corporate Banking, Technology and Life Sciences and general Middle Market. The provision for credit losses was $25 million in 2015, an increase of $43 million compared to a benefit of $18 million in the prior year, primarily reflecting increases in Small Business, Corporate Banking, Commercial Real Estate and general Middle Market. Net loan charge-offs were $29 million in 2015, compared to net recoveries of $14 million in 2014, primarily reflecting increases in Small Business, Commercial Real Estate, Corporate Banking and general Middle Market. See the Retail Bank discussion for an explanation of the increase in Small Business provision and net charge-offs. Excluding the $181 million impact of the change in accounting presentation for a card program, noninterest income of $194 million in 2015 increased $26 million from the prior year, primarily reflecting a $9 million increase in income related to a retirement savings program and small increases in several other noninterest income categories. Excluding the impact of the change in accounting presentation for a card program, noninterest expenses of $249 million in 2015 increased $46 million compared to the prior year, primarily due to a $17 million increase in outside processing expense, largely due to third-party processing expense associated with the retirement savings program and merchant payment processing services associated with the change to the Corporation's business model for providing merchant payment processing services, as well as a $9 million increase in corporate overhead expense and small increases in several other categories of noninterest expense. See the Business Bank discussion for an explanation of the increase in corporate overhead expense. Refer to the "Noninterest Expenses" subheading in the "Results of Operations" section of this financial review for further discussion of the change to the Corporation's business model for providing merchant payment processing services.
The net loss for the Finance & Other category of $376 million in 2015 increased $19 million compared to 2014, primarily reflecting the after tax impact of a $30 million increase in noninterest expense in the Finance segment, largely due to the $32 million gain in 2014 on the early redemption of debt as previously discussed under the "Business Segments" subheading above.
The following table lists the Corporation's banking centers by geographic market segment.
|
| | | | | | | | |
| December 31 | 2015 | | 2014 | | 2013 |
| Michigan | 214 |
| | 214 |
| | 216 |
|
| Texas | 133 |
| | 135 |
| | 140 |
|
| California | 103 |
| | 104 |
| | 105 |
|
| Other Markets: | | | | | |
| Arizona | 19 |
| | 18 |
| | 18 |
|
| Florida | 7 |
| | 9 |
| | 10 |
|
| Canada | 1 |
| | 1 |
| | 1 |
|
| Total Other Markets | 27 |
| | 28 |
| | 29 |
|
| Total | 477 |
| | 481 |
| | 490 |
|
BALANCE SHEET AND CAPITAL FUNDS ANALYSIS
ANALYSIS OF INVESTMENT SECURITIES AND LOANS
|
| | | | | | | | | | | | | | | | | | | |
(in millions) | | | | | | | | | |
| December 31 | 2015 | | 2014 | | 2013 | | 2012 | | 2011 |
| Investment securities available-for-sale: | | | | | | | | | |
| U.S. Treasury and other U.S. government agency securities | $ | 2,763 |
| | $ | 526 |
| | $ | 45 |
| | $ | 35 |
| | $ | 40 |
|
| Residential mortgage-backed securities (a) | 7,545 |
| | 7,274 |
| (b) | 8,926 |
| | 9,920 |
| | 9,492 |
|
| State and municipal securities | 9 |
| | 23 |
| | 22 |
| | 23 |
| | 24 |
|
| Corporate debt securities | 1 |
| | 51 |
| | 56 |
| | 58 |
| | 47 |
|
| Equity and other non-debt securities | 201 |
| | 242 |
| | 258 |
| | 261 |
| | 501 |
|
| Total investment securities available-for-sale | 10,519 |
| | 8,116 |
| | 9,307 |
| | 10,297 |
| | 10,104 |
|
| Investment securities held to maturity: | | | | | | | | | |
| Residential mortgage-backed securities (a) | 1,981 |
| | 1,935 |
| (b) | — |
| | — |
| | — |
|
| Total investment securities | $ | 12,500 |
| | $ | 10,051 |
| | $ | 9,307 |
| | $ | 10,297 |
| | $ | 10,104 |
|
| Commercial loans | $ | 31,659 |
| | $ | 31,520 |
| | $ | 28,815 |
| | $ | 29,513 |
| | $ | 24,996 |
|
| Real estate construction loans | 2,001 |
| | 1,955 |
| | 1,762 |
| | 1,240 |
| | 1,533 |
|
| Commercial mortgage loans | 8,977 |
| | 8,604 |
| | 8,787 |
| | 9,472 |
| | 10,264 |
|
| Lease financing | 724 |
| | 805 |
| | 845 |
| | 859 |
| | 905 |
|
| International loans: | | | | | | | | | |
| Banks and other financial institutions | — |
| | 31 |
| | 4 |
| | 2 |
| | 18 |
|
| Commercial and industrial | 1,368 |
| | 1,465 |
| | 1,323 |
| | 1,291 |
| | 1,152 |
|
| Total international loans | 1,368 |
| | 1,496 |
| | 1,327 |
| | 1,293 |
| | 1,170 |
|
| Residential mortgage loans | 1,870 |
| | 1,831 |
| | 1,697 |
| | 1,527 |
| | 1,526 |
|
| Consumer loans: | | | | | | | | | |
| Home equity | 1,720 |
| | 1,658 |
| | 1,517 |
| | 1,537 |
| | 1,655 |
|
| Other consumer | 765 |
| | 724 |
| | 720 |
| | 616 |
| | 630 |
|
| Total consumer loans | 2,485 |
| | 2,382 |
| | 2,237 |
| | 2,153 |
| | 2,285 |
|
| Total loans | $ | 49,084 |
| | $ | 48,593 |
| | $ | 45,470 |
| | $ | 46,057 |
| | $ | 42,679 |
|
| |
| (a) | Issued and/or guaranteed by U.S. government agencies or U.S. government-sponsored enterprises. |
| |
| (b) | During the fourth quarter 2014, the Corporation transferred residential mortgage-backed securities from available-for sale to held-to-maturity. |
EARNING ASSETS
Loans
Average total loans increased $2.0 billion, or 4 percent, to $48.6 billion in 2015, compared to $46.6 billion in 2014, primarily reflecting an increase of $1.8 billion, or 6 percent, in commercial loans. The following tables provide information about the changes in the Corporation's average loan portfolio in 2015, compared to 2014.
|
| | | | | | | | | | | | | | |
| (dollar amounts in millions) | | | | | Percent Change |
| Years Ended December 31 | 2015 | | 2014 | | Change | |
| Average Loans: | | | | | | | |
| Commercial loans by business line: | | | | | | | |
| General Middle Market | $ | 10,289 |
| | $ | 10,185 |
| | $ | 104 |
| | 1 | % |
| National Dealer Services | 4,333 |
| | 4,012 |
| | 321 |
| | 8 |
|
| Energy | 3,365 |
| | 3,211 |
| | 154 |
| | 5 |
|
| Technology and Life Sciences | 2,933 |
| | 2,395 |
| | 538 |
| | 22 |
|
| Environmental Services | 845 |
| | 865 |
| | (20 | ) | | (2 | ) |
| Entertainment | 618 |
| | 536 |
| | 82 |
| | 15 |
|
| Total Middle Market | 22,383 |
| | 21,204 |
| | 1,179 |
| | 6 |
|
| Corporate Banking | 3,088 |
| | 3,324 |
| | (236 | ) | | (7 | ) |
| Mortgage Banker Finance | 1,843 |
| | 1,301 |
| | 542 |
| | 42 |
|
| Commercial Real Estate | 884 |
| | 788 |
| | 96 |
| | 12 |
|
| Total Business Bank commercial loans | 28,198 |
|
| 26,617 |
| | 1,581 |
| | 6 |
|
| Total Retail Bank commercial loans | 1,931 |
| | 1,706 |
| | 225 |
| | 13 |
|
| Total Wealth Management commercial loans | 1,372 |
| | 1,392 |
| | (20 | ) | | (1 | ) |
| Total commercial loans | 31,501 |
| | 29,715 |
| | 1,786 |
| | 6 |
|
| Real estate construction loans | 1,884 |
| | 1,909 |
| | (25 | ) | | (1 | ) |
| Commercial mortgage loans | 8,697 |
| | 8,706 |
| | (9 | ) | | — |
|
| Lease financing | 783 |
| | 834 |
| | (51 | ) | | (6 | ) |
| International loans | 1,441 |
| | 1,376 |
| | 65 |
| | 5 |
|
| Residential mortgage loans | 1,878 |
| | 1,778 |
| | 100 |
| | 6 |
|
| Consumer loans: | | | | | | | |
| Home equity | 1,693 |
| | 1,583 |
| | 110 |
| | 7 |
|
| Other consumer | 751 |
| | 687 |
| | 64 |
| | 9 |
|
| Consumer loans | 2,444 |
| | 2,270 |
| | 174 |
| | 8 |
|
| Total loans | $ | 48,628 |
| | $ | 46,588 |
| | $ | 2,040 |
| | 4 | % |
| Average Loans By Geographic Market: | | | | | | | |
| Michigan | $ | 13,180 |
| | $ | 13,336 |
| | $ | (156 | ) | | (1 | )% |
| California | 16,613 |
| | 15,390 |
| | 1,223 |
| | 8 |
|
| Texas | 11,168 |
| | 10,954 |
| | 214 |
| | 2 |
|
| Other Markets | 7,667 |
| | 6,908 |
| | 759 |
| | 11 |
|
| Total loans | $ | 48,628 |
| | $ | 46,588 |
| | $ | 2,040 |
| | 4 | % |
Middle Market business lines generally serve customers with annual revenue between $20 million and $500 million. National Dealer Services primarily provides floor plan inventory financing to auto dealerships, and the $321 million increase in average National Dealer Services commercial loans largely reflected the increased volume of new car sales activity in 2015. Customers in the Energy business line are engaged in three segments of the oil and gas business: exploration and production (E&P), midstream and energy services. While average Energy commercial loans increased $154 million in 2015, compared to 2014, period-end Energy commercial loan balances decreased $488 million from December 31, 2014 to December 31, 2015, reflecting the impact of sustained lower oil and gas prices over the past six quarters. For more information on Energy and related loans, refer to "Energy Lending" in the "Risk Management section of this financial review. The Technology and Life Sciences business line serves two segments: (1) private equity and venture capital firms, referred to as equity fund services, and (2) companies that are typically owned by venture-capital firms, where significant equity is invested to create products and build companies around new intellectual property. The $538 million increase in average Technology and Life Sciences commercial loans primarily reflected growth of $471 million in equity fund services, where the line of business provides capital call or subscription lines, along with other financial services. Corporate Banking generally serves customers with revenue over $500 million, and the $236 million decrease in average Corporate Banking commercial loan balances generally reflected the Corporation's continued pricing
and structure discipline in the competitive environment. Mortgage Banker Finance provides short-term, revolving lines of credit to independent mortgage banking companies and therefore balances tend to reflect the level of home sales and refinancing activity in the market as a whole. The $542 million increase in average Mortgage Banker Finance commercial loans reflected higher average home sales volume and increased refinancing activity in 2015, compared to 2014, as well as new and expanded relationships. Commercial real estate loans comprise real estate construction loans and commercial mortgage loans. Real estate construction loans primarily include loans in the Commercial Real Estate business line, which generally serves commercial real estate developers. Commercial mortgage loans are loans where the primary collateral is a lien on any real property and are primarily loans secured by owner occupied real estate. Real property is generally considered primary collateral if the value of that collateral represents more than 50 percent of the commitment at loan approval.
On a period-end basis, total loans were $49.1 billion at December 31, 2015, an increase of $491 million from December 31, 2014, primarily reflecting increases of $419 million, or 4 percent, in commercial real estate loans and $139 million in commercial loans. The increase in period-end commercial loans primarily reflected increases in Mortgage Banker Finance ($674 million) and Technology and Life Sciences ($496 million), partially offset by decreases in Energy ($488 million), general Middle Market ($487 million) and Corporate Banking ($459 million). The $419 million increase in period-end commercial real estate loans was primarily driven by an increase in commercial mortgage loans in the Commercial Real Estate business line. For more information on commercial real estate loans, refer to "Commercial Real Estate Lending" in the "Risk Management" section of this financial review.
ANALYSIS OF INVESTMENT SECURITIES PORTFOLIO (FTE)
|
| | | | | | | | | | | | | | | | | | | | | | | | | | | | | | | | |
| | Maturity (a) | | Weighted Average Maturity |
| (dollar amounts in millions) | Within 1 Year | | 1 - 5 Years | | 5 - 10 Years | | After 10 Years | | Total | |
| December 31, 2015 | Amount | Yield | | Amount | Yield | | Amount | Yield | | Amount | Yield | | Amount | Yield | | Years |
| U.S. Treasury and other U.S. government agency securities | $ | 10 |
| 0.28 | % | | $ | 2,753 |
| 1.58 | % | | $ | — |
| — | % | | $ | — |
| — | % | | $ | 2,763 |
| 1.58 | % | | 4.0 |
|
| Residential mortgage-backed securities (b) | — |
| — |
| | 96 |
| 2.13 |
| | 1,306 |
| 3.02 |
| | 8,124 |
| 2.07 |
| | 9,526 |
| 2.20 |
| | 16.9 |
|
| State and municipal securities (c) | — |
| — |
| | 2 |
| 0.58 |
| | 2 |
| 0.58 |
| | 5 |
| 0.58 |
| | 9 |
| 0.58 |
| | 11.4 |
|
| Auction-rate debt securities | — |
| — |
| | — |
| — |
| | — |
| — |
| | 1 |
| — |
| | 1 |
| — |
| | 22.0 |
|
| Equity and other non-debt securities: | | | | | | | | | | | | | | | | |
| Auction-rate preferred securities (d) | — |
| — |
| | — |
| — |
| | — |
| — |
| | 67 |
| 0.44 |
| | 67 |
| 0.44 |
| | — |
|
| Money market and other mutual funds (e) | — |
| — |
| | — |
| — |
| | — |
| — |
| | 134 |
| — |
| | 134 |
| — |
| | — |
|
| Total investment securities | $ | 10 |
| 0.28 | % | | $ | 2,851 |
| 1.60 | % | | $ | 1,308 |
| 3.01 | % | | $ | 8,331 |
| 2.06 | % | | $ | 12,500 |
| 2.05 | % | | 14.0 |
|
(a)Based on final contractual maturity.
(b)Issued and/or guaranteed by U.S. government agencies or U.S. government-sponsored enterprises.
(c)Auction-rate securities.
(d)Auction-rate preferred securities have no contractual maturity; balances are excluded from the calculation of total weighted average maturity.
(e)Balances are excluded from the calculation of total yield and weighted average maturity.
Investment Securities
Investment securities increased $2.4 billion to $12.5 billion at December 31, 2015, from $10.1 billion at December 31, 2014, primarily reflecting the purchase of approximately $2.2 billion of U.S. Treasury securities, resulting from the reinvestment of excess Federal Reserve Bank deposits into higher yielding securities in the fourth quarter 2015. Net unrealized gains on investment securities available-for-sale were $28 million at December 31, 2015, compared to net unrealized gains of $81 million at December 31, 2014. At December 31, 2015, the weighted-average expected life of the Corporation's residential mortgage-backed securities portfolio was approximately 3.8 years. On an average basis, investment securities increased $887 million to $10.2 billion in 2015, compared to $9.4 billion in 2014.
The Corporation has been purchasing U.S. Treasury securities and reinvesting paydowns on residential mortgage-backed securities (RMBS) issued by the Federal National Mortgage Association and the Federal Home Loan Mortgage Corporation (government-sponsored enterprises, or GSEs) with RMBS issued by the Government National Mortgage Association (GNMA), as U.S. Treasury and GNMA securities receive more favorable treatment under Liquidity Coverage Ratio (LCR) rules. The following table provides a summary of securities issued and/or guaranteed by the U.S. government, its agencies and GSEs.
|
| | | | | | | |
| | December 31, 2015 | | December 31, 2014 |
| (dollar amounts in millions) | Amount | | Amount |
| U.S. Treasury and other U.S. government agency securities | 2,763 |
| | 526 |
|
| RMBS issued by GNMA | 3,806 |
| | 2,111 |
|
| RMBS issued by government-sponsored enterprises | 5,720 |
| | 7,098 |
|
| Total RMBS | 9,526 |
| | 9,209 |
|
| Total | $ | 12,289 |
| | $ | 9,735 |
|
As of December 31, 2015, the Corporation's auction-rate securities portfolio was carried at an estimated fair value of $77 million, compared to $136 million at December 31, 2014. During 2015, auction-rate securities with a par value of $63 million were redeemed or sold, resulting in net securities losses of $2 million. As of December 31, 2015, approximately 94 percent of the aggregate auction-rate securities par value had been redeemed or sold since the portfolio was acquired in 2008, for a cumulative net gain of $52 million.
Interest-Bearing Deposits with Banks and Other Short-Term Investments
Interest-bearing deposits with banks primarily include deposits with the FRB and also include deposits with banks in developed countries or international banking facilities of foreign banks located in the United States. Other short-term investments include federal funds sold, trading securities and loans held-for-sale. Substantially all trading securities are deferred compensation plan assets. Loans held-for-sale typically represent residential mortgage loans originated with management's intention to sell and, from time to time, other loans that are transferred to held-for-sale. Federal funds sold offer supplemental earnings opportunities and serve correspondent banks. Interest-bearing deposits with banks and federal funds sold provide a range of maturities of less than one year and are mostly used to manage liquidity requirements of the Corporation. Interest-bearing deposits with banks decreased $55 million to $5.0 billion at December 31, 2015. Other short-term investments increased $14 million to $113 million at December 31, 2015. On an average basis, interest-bearing deposits increased $645 million to $6.2 billion in 2015, compared to $5.5 billion in 2014, primarily reflecting a $622 million increase in average deposits with the FRB.
DEPOSITS AND BORROWED FUNDS
The Corporation's average deposits and borrowed funds balances are detailed in the following table.
|
| | | | | | | | | | | | | | |
| (dollar amounts in millions) | | | | | | | Percent Change |
| Years Ended December 31 | 2015 | | 2014 | | Change | |
| Noninterest-bearing deposits | $ | 28,087 |
| | $ | 25,019 |
| | $ | 3,068 |
| | 12 | % |
| Money market and interest-bearing checking deposits | 24,073 |
| | 22,891 |
| | 1,182 |
| | 5 |
|
| Savings deposits | 1,841 |
| | 1,744 |
| | 97 |
| | 6 |
|
| Customer certificates of deposit | 4,209 |
| | 4,869 |
| | (660 | ) | | (14 | ) |
| Foreign office and other time deposits | 116 |
| | 261 |
| | (145 | ) | | (55 | ) |
| Total deposits | $ | 58,326 |
| | $ | 54,784 |
| | $ | 3,542 |
| | 6 | % |
| Short-term borrowings | $ | 93 |
| | $ | 200 |
| | $ | (107 | ) | | (53 | )% |
| Medium- and long-term debt | 2,905 |
| | 2,963 |
| | (58 | ) | | (2 | ) |
| Total borrowed funds | $ | 2,998 |
| | $ | 3,163 |
| | $ | (165 | ) | | (5 | )% |
Average deposits increased $3.5 billion, or 6 percent, to $58.3 billion in 2015, compared to $54.8 billion in 2014. Average deposits increased in almost all business lines from 2014 to 2015, with the largest increases in general Middle Market ($1.0 billion), Personal Banking ($645 million), Technology and Life Sciences ($494 million), Corporate Banking ($396 million), Private Banking ($315 million) and Small Business Banking ($264 million). Average deposits increased in all geographic markets from 2014 to 2015, including increases in California ($1.6 billion), Michigan ($849 million), Texas ($118 million) and Other Markets ($1.0 billion). Average noninterest-bearing deposits increased $3.1 billion, or 12 percent, to $28.1 billion in 2015, compared to $25.0 billion in 2014. At December 31, 2015, total deposits were $59.9 billion, an increase of $2.4 billion, or 4 percent, compared to $57.5 billion at December 31, 2014. Noninterest-bearing deposits were $30.8 billion at December 31, 2015, an increase of $3.6 billion, or 13 percent, compared to $27.2 billion at December 31, 2014. The growth in deposits generally reflects the significant liquidity of the Corporation's customers.
Short-term borrowings primarily include federal funds purchased and securities sold under agreements to repurchase. Average short-term borrowings decreased $107 million, to $93 million in 2015, compared to $200 million in 2014, primarily reflecting a decrease in securities sold under agreements to repurchase. Total short-term borrowings at December 31, 2015 were $23 million, a decrease of $93 million compared to $116 million at December 31, 2014.
Average medium- and long-term debt decreased $58 million, or 2 percent, to $2.9 billion in 2015, compared to $3.0 billion in 2014. The Corporation uses medium- and long-term debt to provide funding to support earning assets, liquidity and regulatory capital. Total medium- and long-term debt at December 31, 2015 increased $383 million to $3.1 billion, compared to $2.7 billion at December 31, 2014. The net increase resulted from issuances of a total of $675 million of medium-term notes in the second and third quarters and $350 million of subordinated notes in the third quarter, partially offset by the maturities of $300 million of subordinated notes in the second quarter and $300 million of medium-term notes in the third quarter.
Further information on medium- and long-term debt is provided in Note 12 to the consolidated financial statements.
CAPITAL
Total shareholders' equity increased $158 million to $7.6 billion at December 31, 2015, compared to $7.4 billion at December 31, 2014. The following table presents a summary of changes in total shareholders' equity in 2015.
|
| | | | | | | |
| (in millions) | | | |
| Balance at January 1, 2015 | | | $ | 7,402 |
|
| Net income | | | 521 |
|
| Cash dividends declared on common stock | | | (148 | ) |
| Purchase of common stock | | | (240 | ) |
| Purchase and retirement of warrants | | | (10 | ) |
| Other comprehensive income (loss): | | | |
| Investment securities available-for-sale | $ | (28 | ) | | |
| Defined benefit and other postretirement plans | 11 |
| | |
| Total other comprehensive income (loss) | | | (17 | ) |
| Issuance of common stock under employee stock plans | | | 14 |
|
| Share-based compensation | | | 38 |
|
| Balance at December 31, 2015 | | | $ | 7,560 |
|
Further information about other comprehensive income (loss) is provided in the consolidated statements of comprehensive income and Note 14 to the consolidated financial statements.
The Federal Reserve completed its 2015 Comprehensive Capital Analysis and Review (CCAR) in March 2015 and did not object to the Corporation's 2015/2016 capital plan and the capital distributions contemplated in the plan. The plan provides for up to $393 million in equity repurchases for the five-quarter period ending June 30, 2016. At December 31, 2015, up to $210 million remained available for equity repurchases under the plan. Share repurchases totaled $232 million (5.1 million shares) and warrant repurchases totaled $10 million (500,000 warrants) in 2015. The pace of future equity repurchases will be linked to the Corporation's overall capital position and financial condition. The 2016 capital plan will be submitted to the Federal Reserve for review in April 2016 and a response is expected in June 2016.
The following table summarizes the Corporation's equity repurchase activity for the year ended December 31, 2015.
|
| | | | | | | | | | | | | | | | |
| (shares in thousands) | Total Number of Shares and Warrants Purchased as Part of Publicly Announced Repurchase Plans or Programs | | Remaining Repurchase Authorization (a) | | Total Number of Shares Purchased (b) | | Average Price Paid Per Share | | Average Price Paid Per Warrant (c) |
| Total first quarter 2015 | 1,354 |
| | 12,728 |
| | 1,517 |
| | 43.38 |
| | — |
|
| Total second quarter 2015 | 1,513 |
| | 19,608 |
| (d) | 1,523 |
| | 48.00 |
| | 20.70 |
|
| Total third quarter 2015 | 1,234 |
| | 18,374 |
| | 1,260 |
| | 47.75 |
| | — |
|
| October 2015 | 649 |
| | 17,725 |
| | 652 |
| | 42.52 |
| | — |
|
| November 2015 | 629 |
| | 17,096 |
| | 632 |
| | 45.73 |
| | — |
|
| December 2015 | 192 |
| | 16,904 |
| | 192 |
| | 44.74 |
| | — |
|
| Total fourth quarter 2015 | 1,470 |
| | 16,904 |
| | 1,476 |
| | 44.19 |
| | — |
|
| Total 2015 | 5,571 |
| | 16,904 |
| | 5,776 |
| | $ | 45.54 |
| | $ | 20.70 |
|
| |
| (a) | Maximum number of shares and warrants that may yet be purchased under the publicly announced plans or programs. |
| |
| (b) | Includes approximately 205,000 shares (including 6,000 shares for the quarter ended December 31, 2015) purchased pursuant to deferred compensation plans and shares purchased from employees to pay for required minimum tax withholding related to restricted stock vesting under the terms of an employee share-based compensation plan during the year ended December 31, 2015. These transactions are not considered part of the Corporation's repurchase program. |
| |
| (c) | The Corporation repurchased 500,000 warrants under the repurchase program during the year ended December 31, 2015. Upon exercise of a warrant, the number of shares with a value equal to the aggregate exercise price is withheld from an exercising warrant holder as payment (known as a "net exercise provision"). During the year ended December 31, 2015, the Corporation withheld the equivalent of approximately 1,291,000 shares to cover an aggregate of $65.7 million in exercise price and issued approximately 934,000 shares to the exercising warrant holders. Shares withheld in connection with the net exercise provision are not included in the total number of shares or warrants purchased in the above table. |
| |
| (d) | Includes April 28, 2015 equity repurchase authorization for up to an additional 10.6 million shares and share-equivalents. |
In April 2015, the Board of Directors of the Corporation (the Board) authorized the repurchase of up to an additional 10.0 million shares of Comerica Incorporated outstanding common stock, in addition to the 2.1 million shares remaining at March 31, 2015 under the Board's prior authorizations for the equity repurchase program initially approved in November 2010. Including the April 2015 authorization, a total of 40.3 million shares has been authorized for repurchase under the equity repurchase program since its inception in 2010. In April 2015, the Board also authorized the repurchase of up to an additional 2.6 million
warrants, in addition to the 10.6 million warrants remaining at March 31, 2015 under an authorization initially approved in November 2010. There is no expiration date for the Corporation's equity repurchase program.
In April 2015, the Board approved a 1-cent increase in the quarterly common dividend, to $0.21 per share. The 2015 dividend increase was contemplated in the Corporation's 2015/2016 capital plan. The Corporation declared common dividends in 2015 totaling $148 million, or $0.83 per share, on net income of $521 million, compared to common dividends totaling $0.79 per share in 2014. The dividend payout ratio, calculated on a per share basis, was 28 percent in 2015, compared to 24 percent in 2014. Including share repurchases under the equity repurchase program, the total payout to shareholders was 75 percent in 2015, compared to 66 percent in 2014.
The Corporation periodically conducts stress tests to evaluate potential impacts to the Corporation's forecasted financial condition under various economic scenarios and business conditions. These stress tests are a normal part of the Corporation's overall risk management and capital planning process and are part of the forecasting process used by the Corporation to conduct the enterprise-wide stress test that was part of CCAR. For additional information about risk management processes, refer to the "Risk Management" section of this financial review.
The U.S. adoption of the Basel III regulatory capital framework (Basel III) became effective for the Corporation on January 1, 2015. Basel III includes a more stringent definition of capital and introduces a new common equity Tier 1 (CET1) capital requirement; sets forth two comprehensive methodologies for calculating risk-weighted assets (RWA), a standardized approach and an advanced approach; introduces two new capital buffers, a conservation buffer and a countercyclical buffer (applicable to advanced approach entities); establishes a new supplemental leverage ratio (applicable to advanced approach entities); and sets out minimum capital ratios and overall capital adequacy standards. Certain deductions and adjustments to regulatory capital phase in and will be fully implemented on January 1, 2018. The capital conservation buffer phases in beginning January 1, 2016 and will be fully implemented on January 1, 2019.
Under Basel III, CET1 capital predominantly includes common shareholders' equity, less certain deductions for goodwill, intangible assets and deferred tax assets that arise from net operating losses and tax credit carry-forwards. Additionally, the Corporation has elected to permanently exclude capital in accumulated other comprehensive income (AOCI) related to debt and equity securities classified as available-for-sale as well as for defined benefit postretirement plans from CET1, an option available to standardized approach entities under Basel III. Tier 1 capital incrementally includes noncumulative perpetual preferred stock. Tier 2 capital includes Tier 1 capital as well as subordinated debt qualifying as tier 2 and qualifying allowance for credit losses. Certain deductions and adjustments to CET1 capital, Tier 1 capital and Tier 2 capital are subject to phase-in through December 31, 2017.
The Corporation computes RWA using the standardized approach. Under the standardized approach, RWA is generally based on supervisory risk-weightings which vary by counterparty type and asset class. Under the Basel III standardized approach, capital is required for credit risk RWA, to cover the risk of unexpected losses due to failure of a customer or counterparty to meet its financial obligations in accordance with contractual terms; and if trading assets and liabilities exceed certain thresholds, capital is also required for market risk RWA, to cover the risk of losses due to adverse market movements or from position-specific factors.
The following table presents the minimum ratios required to be considered "adequately capitalized" as of December 31, 2015 and December 31, 2014.
|
| | | | | | | | |
| | 2015 | 2014 |
| December 31 | Basel III Rules | Basel I Rules |
| Common equity tier 1 capital to risk-weighted assets | | 4.5 | % | (a) | | n/a |
| |
| Tier 1 capital to risk-weighed assets | | 6.0 |
| (a) | | 4.0 | % | |
| Total capital to risk-weighted assets | | 8.0 |
| (a) | | 8.0 |
| |
| Tier 1 capital to adjusted average assets (leverage ratio) | | 4.0 |
| | | 3.0 |
| |
| |
| (a) | In order to avoid restrictions on capital distributions and discretionary bonuses, the Corporation will also be required to maintain a minimum capital conservation buffer, which phases in at 0.625% beginning on January 1, 2016 and ultimately increases to 2.5% on January 1, 2019. |
n/a - not applicable.
The Corporation's capital ratios exceeded minimum regulatory requirements as follows:
|
| | | | | | | | | | | | | |
| | 2015 | | 2014 |
| December 31 | (Basel III Rules) | | (Basel I Rules) |
| (dollar amounts in millions) | Capital/Assets | | Ratio | | Capital/Assets | | Ratio |
| Common equity tier 1 | $ | 7,350 |
| | 10.54 | % | | n/a |
| | n/a |
|
| Tier 1 common (a) | n/a |
| | n/a |
| | $ | 7,169 |
| | 10.50 | % |
| Tier 1 risk-based | 7,350 |
| | 10.54 |
| | 7,169 |
| | 10.50 |
|
| Total risk-based | 8,852 |
| | 12.69 |
| | 8,543 |
| | 12.51 |
|
| Leverage | 7,350 |
| | 10.22 |
| | 7,169 |
| | 10.35 |
|
| Tangible common equity (a) | 6,911 |
| | 9.70 |
| | 6,752 |
| | 9.85 |
|
| Risk-weighted assets | 69,731 |
| | | | 68,273 |
| | |
| |
| (a) | See Supplemental Financial Data section for reconcilements of non-GAAP financial measures. |
n/a - not applicable.
At December 31, 2015, the Corporation and its U.S. banking subsidiaries exceeded the capital ratios required for an institution to be considered "well capitalized" by the standards developed under the Federal Deposit Insurance Corporation Improvement Act of 1991. Refer to Note 20 to the consolidated financial statements for further discussion of regulatory capital requirements and capital ratio calculations.
RISK MANAGEMENT
As a result of conducting business in the normal course, the Corporation assumes various types of risk. The Corporation's enterprise risk framework provides a process for identifying, measuring, controlling and managing these risks. This framework incorporates a risk assessment process, a collection of risk committees that manage the Corporation's major risk elements, and a risk appetite statement that outlines the levels and types of risks the Corporation accepts. The Corporation continuously enhances its enterprise risk framework with additional processes, tools and systems designed to not only provide management with deeper insight into the Corporation's various existing and emerging risks in accordance with its appetite for risk, but also to improve the Corporation's ability to control those risks and ensure that appropriate consideration is received for the risks taken.
The Corporation's front line employees, the first line of defense, are responsible for the day to day management of risks including the identification, assessment, measurement and control of risks encountered as a part of the normal course of business. Risks are further monitored, measured and controlled by the second line of defense, specialized risk managers for each of the major risk categories who aid in the identification, measurement, and control of organizational risks. The majority of these risk managers report into the Office of Enterprise Risk. The Office of Enterprise Risk, led by the Chief Risk Officer, is responsible for designing and managing the Corporation's enterprise risk framework and ensures effective risk management oversight. Risk management committees serve as a point of review and escalation for those risks which may have risk interdependencies or where risk levels may be nearing the limits outlined in the Corporation's risk appetite statement. These committees comprise senior and executive management that represent views from both the lines of business and risk management. Internal Audit, the third line of defense, monitors and assesses the overall effectiveness of the risk management framework on an ongoing basis and provides an independent assessment of the Corporation's ability to manage and control risk to management and the Audit Committee of the Board.
The Enterprise-Wide Risk Management Committee, established by the Enterprise Risk Committee of the Board, is responsible for governance over the risk management framework, providing oversight in managing the Corporation's aggregate risk position and reporting on the comprehensive portfolio of risks as well as the potential impact these risks can have on the Corporation's risk profile and resulting capital level. The Enterprise-Wide Risk Management Committee is principally composed of senior officers and executives representing the different risk areas and business units who are appointed by the Chairman and Chief Executive Officer of the Corporation.
The Board's Enterprise Risk Committee meets quarterly and is chartered to assist the Board in promoting the best interests of the Corporation by overseeing policies, procedures and risk practices relating to enterprise-wide risk and ensuring compliance with bank regulatory obligations. Members of the Enterprise Risk Committee are selected such that the committee comprises individuals whose experiences and qualifications can lead to broad and informed views on risk matters facing the Corporation and the financial services industry. These include, but are not limited to, existing and emerging risk matters related to credit, market, liquidity, operational, compliance and strategic conditions. A comprehensive risk report is submitted to the Enterprise Risk Committee each quarter providing management's view of the Corporation's aggregate risk position.
Further discussion and analyses of each major risk area are included in the following sub-sections of the Risk Management section in this financial review.
CREDIT RISK
Credit risk represents the risk of loss due to failure of a customer or counterparty to meet its financial obligations in accordance with contractual terms. The governance structure is administered through the Strategic Credit Committee. The Strategic Credit Committee is chaired by the Chief Credit Officer and approves recommendations to address credit risk matters through credit policy, credit risk management practices, and required credit risk actions. The Strategic Credit Committee also ensures a comprehensive reporting of credit risk levels and trends, including exception levels, along with identification and mitigation of emerging risks. In order to facilitate the corporate credit risk management process, various other corporate functions provide the resources for the Strategic Credit Committee to carry out its responsibilities. The Corporation manages credit risk through underwriting, periodically reviewing and approving its credit exposures using approved credit policies and guidelines. Additionally, the Corporation manages credit risk through loan portfolio diversification, limiting exposure to any single industry, customer or guarantor, and selling participations and/or syndicating credit exposures above those levels it deems prudent to third parties.
Credit Administration manages credit policy and provides the resources to manage the line of business transactional credit risk, assuring that all exposure is risk rated according to the requirements of the credit risk rating policy and providing business segment reporting support as necessary. The Corporation's Asset Quality Review function, a division of Internal Audit, audits the accuracy of internal risk ratings that are assigned by the lending and credit groups. The Special Assets Group is responsible for managing the recovery process on distressed or defaulted loans and loan sales.
Portfolio Risk Analytics, within the Office of Enterprise Risk, provides comprehensive reporting on portfolio credit risk levels and trends, continuous assessment and verification of risk rating models, quarterly calculation of the allowance for loan losses and the allowance for credit losses on lending-related commitments, and calculation of economic credit risk capital.
ANALYSIS OF THE ALLOWANCE FOR LOAN LOSSES
|
| | | | | | | | | | | | | | | | | | | |
| (dollar amounts in millions) | | | | | | | | | |
| Years Ended December 31 | 2015 | | 2014 | | 2013 | | 2012 | | 2011 |
| Balance at beginning of year | $ | 594 |
| | $ | 598 |
| | $ | 629 |
| | $ | 726 |
| | $ | 901 |
|
| Loan charge-offs: | | | | | | | | | |
| Commercial | 139 |
| | 59 |
| | 91 |
| | 112 |
| | 192 |
|
| Real estate construction | — |
| | — |
| | 3 |
| | 8 |
| | 37 |
|
| Commercial mortgage | 3 |
| | 22 |
| | 36 |
| | 89 |
| | 139 |
|
| Lease financing | 1 |
| | — |
| | — |
| | — |
| | — |
|
| International | 14 |
| | 6 |
| | — |
| | 3 |
| | 7 |
|
| Residential mortgage | 1 |
| | 2 |
| | 4 |
| | 13 |
| | 15 |
|
| Consumer | 10 |
| | 13 |
| | 19 |
| | 20 |
| | 33 |
|
| Total loan charge-offs | 168 |
| | 102 |
| | 153 |
| | 245 |
| | 423 |
|
| Recoveries: | | | | | | | | | |
| Commercial | 33 |
| | 34 |
| | 42 |
| | 39 |
| | 33 |
|
| Real estate construction | 1 |
| | 4 |
| | 7 |
| | 6 |
| | 14 |
|
| Commercial mortgage | 21 |
| | 28 |
| | 20 |
| | 18 |
| | 26 |
|
| Lease financing | — |
| | 2 |
| | 1 |
| | — |
| | 11 |
|
| International | — |
| | — |
| | — |
| | 2 |
| | 5 |
|
| Residential mortgage | 2 |
| | 4 |
| | 4 |
| | 2 |
| | 2 |
|
| Consumer | 11 |
| | 5 |
| | 6 |
| | 8 |
| | 4 |
|
| Total recoveries | 68 |
| | 77 |
| | 80 |
| | 75 |
| | 95 |
|
| Net loan charge-offs | 100 |
| | 25 |
| | 73 |
| | 170 |
| | 328 |
|
| Provision for loan losses | 142 |
| | 22 |
| | 42 |
| | 73 |
| | 153 |
|
| Foreign currency translation adjustment | (2 | ) | | (1 | ) | | — |
| | — |
| | — |
|
| Balance at end of year | $ | 634 |
| | $ | 594 |
| | $ | 598 |
| | $ | 629 |
| | $ | 726 |
|
| Net loan charge-offs during the year as a percentage of average loans outstanding during the year | 0.21 | % | | 0.05 | % | | 0.16 | % | | 0.39 | % | | 0.82 | % |
Allowance for Credit Losses
The allowance for credit losses includes both the allowance for loan losses and the allowance for credit losses on lending-related commitments. The allowance for loan losses represents management's assessment of probable, estimable losses inherent in the Corporation's loan portfolio. The allowance for credit losses on lending-related commitments, included in "accrued expenses and other liabilities" on the consolidated balance sheets, provides for probable losses inherent in lending-related commitments, including unused commitments to extend credit and standby letters of credit. Refer to Note 1 to the consolidated financial statements for a discussion of the methodology used in the determination of the allowance for credit losses.
U.S. economic data at the end of 2015 was mixed, with modest real Gross Domestic Product (GDP) growth seen throughout the year. U.S. manufacturing faced many opposing forces. Low gasoline prices and strengthening household income supported strong demand for new vehicles. U.S. auto sales reached their highest level in 15 years in 2015, with nearly 17.5 million units sold. However, sustained low oil prices created stress in energy and related industries, and soft global demand, coupled with the strong U.S. dollar, created headwinds for many U.S. manufacturing industries outside of the auto sector. Yet U.S. households are being supported by strong job growth, with the unemployment rate down to 5.0 percent in December. Wage income was up by 4.5 percent over the previous 12 months, while the consumer price index was essentially unchanged for the year due to lower energy prices. Rising incomes, still-low mortgage rates and increasing confidence are supporting new home construction. House prices are rising consistently in most areas, creating wealth for home owners.
An analysis of the coverage of the allowance for loan losses is provided in the following table.
|
| | | | | | | | |
| Years Ended December 31 | 2015 | | 2014 | | 2013 |
| Allowance for loan losses as a percentage of total loans at end of year | 1.29 | % | | 1.22 | % | | 1.32 | % |
| Allowance for loan losses as a percentage of total nonperforming loans at end of year | 167 |
| | 205 |
| | 160 |
|
| Allowance for loan losses as a multiple of total net loan charge-offs for the year | 6.3x |
| | 23.5x |
| | 8.2x |
|
The allowance for loan losses was $634 million at December 31, 2015, compared to $594 million at December 31, 2014, an increase of $40 million, or 7 percent. While the overall quality of the loan portfolio remained solid through the end of 2015, sustained lower energy prices, economic complexity and uncertainty continued to be a consideration when determining the appropriateness of the allowance for loan losses. Reserves increased, primarily reflecting increases in reserves allocated for energy and energy-related exposure as well as Technology and Life Sciences, partially offset by improved credit quality in the remainder
of the portfolio. The increase in reserves for energy and energy-related exposure reflected stress in the energy and energy-related portfolio as a result of sustained lower energy prices. Technology and Life Sciences reserves increased largely as a result of the levels and trends of charge-offs.
ALLOCATION OF THE ALLOWANCE FOR LOAN LOSSES
|
| | | | | | | | | | | | | | | | | | | | | | | | | | | | | | | |
| | 2015 | | 2014 | | 2013 | | 2012 | | 2011 |
(dollar amounts in millions) | Allocated Allowance | Allowance Ratio (a) | % (b) | | Allocated Allowance | % (b) | | Allocated Allowance | % (b) | | Allocated Allowance | % (b) | | Allocated Allowance | % (b) |
| December 31 | | | | |
| Business loans | | | | | | | | | | | | | | | |
| Commercial | $ | 463 |
| 1.46 | % | 65 | % | | $ | 388 |
| 65 | % | | $ | 346 |
| 63 | % | | $ | 297 |
| 63 | % | | $ | 303 |
| 58 | % |
| Real estate construction | 12 |
| 0.60 |
| 4 |
| | 20 |
| 4 |
| | 16 |
| 4 |
| | 16 |
| 3 |
| | 48 |
| 4 |
|
| Commercial mortgage | 93 |
| 1.03 |
| 18 |
| | 120 |
| 18 |
| | 159 |
| 19 |
| | 227 |
| 21 |
| | 281 |
| 24 |
|
| Lease financing | 3 |
| 0.39 |
| 1 |
| | 2 |
| 1 |
| | 4 |
| 2 |
| | 4 |
| 2 |
| | 7 |
| 2 |
|
| International | 8 |
| 0.62 |
| 3 |
| | 4 |
| 3 |
| | 6 |
| 3 |
| | 8 |
| 3 |
| | 9 |
| 3 |
|
| Total business loans | 579 |
| 1.30 |
| 91 |
| | 534 |
| 91 |
| | 531 |
| 91 |
| | 552 |
| 92 |
| | 648 |
| 91 |
|
| Retail loans | | | | | | | | | | | | | | | |
| Residential mortgage | 14 |
| 0.76 |
| 4 |
| | 14 |
| 4 |
| | 17 |
| 4 |
| | 20 |
| 3 |
| | 21 |
| 4 |
|
| Consumer | 41 |
| 1.64 |
| 5 |
| | 46 |
| 5 |
| | 50 |
| 5 |
| | 57 |
| 5 |
| | 57 |
| 5 |
|
| Total retail loans | 55 |
| 1.26 |
| 9 |
| | 60 |
| 9 |
| | 67 |
| 9 |
| | 77 |
| 8 |
| | 78 |
| 9 |
|
| Total loans | $ | 634 |
| 1.29 | % | 100 | % | | $ | 594 |
| 100 | % | | $ | 598 |
| 100 | % | | $ | 629 |
| 100 | % | | $ | 726 |
| 100 | % |
| |
| (a) | Allocated allowance as a percentage of related loans outstanding. |
| |
| (b) | Loans outstanding as a percentage of total loans. |
The allowance for credit losses on lending-related commitments includes specific allowances, based on individual evaluations of certain letters of credit in a manner consistent with business loans, and allowances based on the pool of the remaining letters of credit and all unused commitments to extend credit within each internal risk rating.
The allowance for credit losses on lending-related commitments was $45 million at December 31, 2015 compared to $41 million at December 31, 2014. The $4 million increase in the allowance for credit losses on lending-related commitments primarily reflected the impact of downgrades of energy and energy-related unfunded commitments and issued letters of credit. An analysis of changes in the allowance for credit losses on lending-related commitments is presented below.
|
| | | | | | | | | | | | | | | | | | | |
| (dollar amounts in millions) | | | | | | | | | |
| Years Ended December 31 | 2015 | | 2014 | | 2013 | | 2012 | | 2011 |
| Balance at beginning of year | $ | 41 |
| | $ | 36 |
| | $ | 32 |
| | $ | 26 |
| | $ | 35 |
|
| Charge-offs on lending-related commitments (a) | (1 | ) | | — |
| | — |
| | — |
| | — |
|
| Provision for credit losses on lending-related commitments | 5 |
| | 5 |
| | 4 |
| | 6 |
| | (9 | ) |
| Balance at end of year | $ | 45 |
| | $ | 41 |
| | $ | 36 |
| | $ | 32 |
| | $ | 26 |
|
(a) Charge-offs result from the sale of unfunded lending-related commitments.
For additional information regarding the allowance for credit losses, refer to the "Critical Accounting Policies" section of this financial review and Notes 1 and 4 to the consolidated financial statements.
Nonperforming Assets
Nonperforming assets include loans on nonaccrual status, troubled debt restructured loans (TDRs) which have been renegotiated to less than the original contractual rates (reduced-rate loans) and foreclosed property. TDRs include performing and nonperforming loans. Nonperforming TDRs are either on nonaccrual or reduced-rate status.
SUMMARY OF NONPERFORMING ASSETS AND PAST DUE LOANS
|
| | | | | | | | | | | | | | | | | | | |
| (dollar amounts in millions) | | | | | | | | | |
| December 31 | 2015 | | 2014 | | 2013 | | 2012 | | 2011 |
| Nonaccrual loans: | | | | | | | | | |
| Business loans: | | | | | | | | | |
| Commercial | $ | 238 |
| | $ | 109 |
| | $ | 81 |
| | $ | 103 |
| | $ | 237 |
|
| Real estate construction | 1 |
| | 2 |
| | 21 |
| | 33 |
| | 101 |
|
| Commercial mortgage | 60 |
| | 95 |
| | 156 |
| | 275 |
| | 427 |
|
| Lease financing | 6 |
| | — |
| | — |
| | 3 |
| | 5 |
|
| International | 8 |
| | — |
| | 4 |
| | — |
| | 8 |
|
| Total nonaccrual business loans | 313 |
| | 206 |
| | 262 |
| | 414 |
| | 778 |
|
| Retail loans: | | | | | | | | | |
| Residential mortgage | 27 |
| | 36 |
| | 53 |
| | 70 |
| | 71 |
|
| Consumer: | | | | | | | | | |
| Home equity | 27 |
| | 30 |
| | 31 |
| | 31 |
| | 5 |
|
| Other consumer | — |
| | 1 |
| | 4 |
| | 4 |
| | 6 |
|
| Total consumer | 27 |
| | 31 |
| | 35 |
| | 35 |
| | 11 |
|
| Total nonaccrual retail loans | 54 |
| | 67 |
| | 88 |
| | 105 |
| | 82 |
|
| Total nonaccrual loans | 367 |
| | 273 |
| | 350 |
| | 519 |
| | 860 |
|
| Reduced-rate loans | 12 |
| | 17 |
| | 24 |
| | 22 |
| | 27 |
|
| Total nonperforming loans | 379 |
| | 290 |
| | 374 |
| | 541 |
| | 887 |
|
| Foreclosed property | 12 |
| | 10 |
| | 9 |
| | 54 |
| | 94 |
|
| Total nonperforming assets | $ | 391 |
| | $ | 300 |
| | $ | 383 |
| | $ | 595 |
| | $ | 981 |
|
| Gross interest income that would have been recorded had the nonaccrual and reduced-rate loans performed in accordance with original terms | $ | 27 |
| | $ | 25 |
| | $ | 34 |
| | $ | 62 |
| | $ | 74 |
|
| Interest income recognized | 5 |
| | 6 |
| | 5 |
| | 5 |
| | 11 |
|
| Nonperforming loans as a percentage of total loans | 0.77 | % | | 0.60 | % | | 0.82 | % | | 1.17 | % | | 2.08 | % |
| Nonperforming assets as a percentage of total loans and foreclosed property | 0.80 |
| | 0.62 |
| | 0.84 |
| | 1.29 |
| | 2.29 |
|
| Loans past due 90 days or more and still accruing | $ | 17 |
| | $ | 5 |
| | $ | 16 |
| | $ | 23 |
| | $ | 58 |
|
| Loans past due 90 days or more and still accruing as a percentage of total loans | 0.03 | % | | 0.01 | % | | 0.03 | % | | 0.05 | % | | 0.14 | % |
Nonperforming assets increased $91 million to $391 million at December 31, 2015, from $300 million at December 31, 2014. The increase in nonperforming assets primarily reflected an increase of $129 million in nonaccrual commercial loans, largely the result of a $134 million increase in nonaccrual energy and energy-related loans, partially offset by a $35 million decrease in nonaccrual commercial mortgage loans. Nonperforming assets were 0.80 percent of total loans and foreclosed property at December 31, 2015, compared to 0.62 percent at December 31, 2014.
The following table presents a summary of TDRs at December 31, 2015 and 2014.
|
| | | | | | | |
| (in millions) | | | |
| December 31 | 2015 | | 2014 |
| Nonperforming TDRs: | | | |
| Nonaccrual TDRs | $ | 100 |
| | $ | 58 |
|
| Reduced-rate TDRs | 12 |
| | 17 |
|
| Total nonperforming TDRs | 112 |
| | 75 |
|
| Performing TDRs (a) | 128 |
| | 43 |
|
| Total TDRs | $ | 240 |
| | $ | 118 |
|
| |
| (a) | TDRs that do not include a reduction in the original contractual interest rate which are performing in accordance with their modified terms. |
The $85 million increase in performing TDRs and the $42 million increase in nonaccrual TDRs from December 31, 2014 to December 31, 2015 primarily reflected increases in energy and energy-related loans.
The following table presents a summary of changes in nonaccrual loans.
|
| | | | | | | |
(in millions) | | | |
| Years Ended December 31 | 2015 | | 2014 |
| Balance at beginning of period | $ | 273 |
| | $ | 350 |
|
| Loans transferred to nonaccrual (a) | 358 |
| | 167 |
|
| Nonaccrual business loan gross charge-offs (b) | (132 | ) | | (87 | ) |
| Loans transferred to accrual status (a) | (4 | ) | | (18 | ) |
| Nonaccrual business loans sold (c) | (3 | ) | | (36 | ) |
| Payments/other (d) | (125 | ) | | (103 | ) |
| Balance at end of period | $ | 367 |
| | $ | 273 |
|
| (a) Based on an analysis of nonaccrual loans with book balances greater than $2 million. |
(b) Analysis of gross loan charge-offs: | | | |
| Nonaccrual business loans | $ | 132 |
| | $ | 87 |
|
| Performing business loans | 25 |
| | — |
|
| Retail loans | 11 |
| | 15 |
|
| Total gross loan charge-offs | $ | 168 |
| | $ | 102 |
|
| (c) Analysis of loans sold: | | | |
| Nonaccrual business loans | $ | 3 |
| | $ | 36 |
|
| Performing criticized loans | 10 |
| | 19 |
|
| Total loans sold | $ | 13 |
| | $ | 55 |
|
| (d) Includes net changes related to nonaccrual loans with balances less than $2 million, payments on nonaccrual loans with book balances greater than $2 million, transfers of nonaccrual loans to foreclosed property and retail loan gross charge-offs. Excludes business loan gross charge-offs and nonaccrual business loans sold. |
There were 25 borrowers with balances greater than $2 million, totaling $358 million, transferred to nonaccrual status in 2015, an increase of $191 million when compared to $167 million in 2014. Of the transfers to nonaccrual greater than $2 million in 2015, $226 million were energy and energy-related.
The following table presents the composition of nonaccrual loans by balance and the related number of borrowers at December 31, 2015 and 2014.
|
| | | | | | | | | | | | | |
| | 2015 | | 2014 |
| (dollar amounts in millions) | Number of Borrowers | | Balance | | Number of Borrowers | | Balance |
| Under $2 million | 1,300 |
| | $ | 112 |
| | 1,492 |
| | $ | 154 |
|
| $2 million - $5 million | 12 |
| | 34 |
| | 15 |
| | 48 |
|
| $5 million - $10 million | 8 |
| | 57 |
| | 3 |
| | 22 |
|
| $10 million - $25 million | 4 |
| | 58 |
| | 2 |
| | 23 |
|
| Greater than $25 million | 3 |
| | 106 |
| | 1 |
| | 26 |
|
| Total | 1,327 |
| | $ | 367 |
| | 1,513 |
| | $ | 273 |
|
The following table presents a summary of nonaccrual loans at December 31, 2015 and loans transferred to nonaccrual and net loan charge-offs for the year ended December 31, 2015, based on North American Industry Classification System (NAICS) categories.
|
| | | | | | | | | | | | | | | | | | | | |
| | December 31, 2015 | | Year Ended December 31, 2015 |
| (dollar amounts in millions) | Nonaccrual Loans | | Loans Transferred to Nonaccrual (a) | | Net Loan Charge-Offs (Recoveries) |
| Industry Category | | |
| Mining, Quarrying and Oil & Gas Extraction (b) | $ | 139 |
| | 38 | % | | $ | 204 |
| | 57 | % | | $ | 44 |
| | 44 | % |
| Real Estate and Home Builders | 29 |
| | 8 |
| | — |
| | — |
| | (9 | ) | | (9 | ) |
| Services | 28 |
| | 8 |
| | 9 |
| | 3 |
| | (4 | ) | | (4 | ) |
| Retail Trade | 27 |
| | 8 |
| | 40 |
| | 10 |
| | 26 |
| | 26 |
|
| Residential Mortgage | 27 |
| | 7 |
| | — |
| | — |
| | (1 | ) | | (1 | ) |
| Manufacturing (b) | 26 |
| | 7 |
| | 58 |
| | 16 |
| | 11 |
| | 11 |
|
| Health Care and Social Assistance | 20 |
| | 5 |
| | — |
| | — |
| | — |
| | — |
|
| Contractors (b) | 16 |
| | 4 |
| | 9 |
| | 3 |
| | — |
| | — |
|
| Holding and Other Investment Companies | 10 |
| | 3 |
| | — |
| | — |
| | (9 | ) | | (9 | ) |
| Utilities (b) | 9 |
| | 2 |
| | 11 |
| | 3 |
| | 6 |
| | 6 |
|
| Wholesale Trade (c) | 1 |
| | — |
| | 14 |
| | 4 |
| | 32 |
| | 32 |
|
| Other (d) | 35 |
| | 10 |
| | 13 |
| | 4 |
| | 4 |
| | 4 |
|
| Total | $ | 367 |
| | 100 | % | | $ | 358 |
| | 100 | % | | $ | 100 |
| | 100 | % |
| |
| (a) | Based on an analysis of nonaccrual loans with book balances greater than $2 million. |
| |
| (b) | Included nonaccrual energy and energy-related loans of approximately $138 million in Mining, Quarrying and Oil & Gas Extraction, $14 million in Contractors, $5 million in Utilities and $4 million in Manufacturing at December 31, 2015. |
| |
| (c) | Included a charge-off resulting from irregularities associated with single customer loan relationship in Small Business. |
| |
| (d) | Consumer, excluding residential mortgage and certain personal purpose nonaccrual loans and net charge-offs, is included in the "Other" category. |
Loans past due 90 days or more and still accruing interest generally represent loans that are well collateralized and in a continuing process of collection. Loans past due 90 days or more increased $12 million to $17 million at December 31, 2015, compared to $5 million at December 31, 2014. Loans past due 30-89 days decreased $34 million to $129 million at December 31, 2015, compared to $163 million at December 31, 2014. An aging analysis of loans included in Note 4 to the consolidated financial statements provides further information about the balances comprising past due loans.
The following table presents a summary of total criticized loans. The Corporation's criticized list is consistent with the Special Mention, Substandard and Doubtful categories defined by regulatory authorities. Criticized loans with balances of $2 million or more on nonaccrual status or whose terms have been modified in a TDR are individually subjected to quarterly credit quality reviews, and the Corporation may establish specific allowances for such loans. A table of loans by credit quality indicator included in Note 4 to the consolidated financial statements provides further information about the balances comprising total criticized loans.
|
| | | | | | | | |
| (dollar amounts in millions) | | | | |
| December 31 | 2015 | | | 2014 |
| Total criticized loans | $ | 3,193 |
| | | $ | 1,893 |
|
| As a percentage of total loans | 6.5 | % | | | 3.9 | % |
The $1.3 billion increase in criticized loans from December 31, 2014 to December 31, 2015 included a $1.2 billion increase in criticized energy and energy-related loans. For further information about criticized energy and energy-related loans, refer to the "Energy Lending" subheading later in this section.
The following table presents a summary of changes in foreclosed property.
|
| | | | | | | | |
| (in millions) | |
| Years Ended December 31 | 2015 | | | 2014 |
| Balance at beginning of period | $ | 10 |
| | | $ | 9 |
|
| Acquired in foreclosure | 12 |
| | | 16 |
|
| Write-downs | (1 | ) | | | (1 | ) |
| Foreclosed property sold (a) | (9 | ) | | | (14 | ) |
| Balance at end of period | $ | 12 |
| | | $ | 10 |
|
| (a) Net gain on foreclosed property sold | $ | 3 |
| | | $ | 5 |
|
For further information regarding the Corporation's nonperforming assets policies and impaired loans, refer to Note 1 and Note 4 to the consolidated financial statements.
Concentration of Credit Risk
Concentrations of credit risk may exist when a number of borrowers are engaged in similar activities, or activities in the same geographic region, and have similar economic characteristics that would cause them to be similarly impacted by changes in economic or other conditions. The Corporation has a concentration of credit risk with the automotive industry. All other industry concentrations, as defined by management, individually represented less than 10 percent of total loans at December 31, 2015.
The following table presents a summary of loans outstanding to companies related to the automotive industry.
|
| | | | | | | | | | | | | |
| | 2015 | | 2014 |
| (in millions) | Loans Outstanding | | Percent of Total Loans | | Loans Outstanding | | Percent of Total Loans |
| December 31 | | | |
| Production: | | | | | | | |
| Domestic | $ | 892 |
| | | | $ | 883 |
| | |
| Foreign | 374 |
| | | | 353 |
| | |
| Total production | 1,266 |
| | 2.6 | % | | 1,236 |
| | 2.5 | % |
| Dealer: | | | | | | | |
| Floor plan | 3,939 |
| | | | 3,790 |
| | |
| Other | 2,634 |
| | | | 2,641 |
| | |
| Total dealer | 6,573 |
| | 13.4 | % | | 6,431 |
| | 13.2 | % |
| Total automotive | $ | 7,839 |
| | 16.0 | % | | $ | 7,667 |
| | 15.8 | % |
Substantially all dealer loans are in the National Dealer Services business line. Loans in the National Dealer Services business line primarily include floor plan financing and other loans to automotive dealerships. Floor plan loans, included in "commercial loans" in the consolidated balance sheets, totaled $3.9 billion at December 31, 2015, an increase of $149 million compared to $3.8 billion at December 31, 2014. At December 31, 2015 other loans in the National Dealer Services business line totaled $2.6 billion, including $1.7 billion of owner-occupied commercial real estate mortgage loans, compared to $2.6 billion, including $1.5 billion of owner-occupied commercial real estate mortgage loans, at December 31, 2014. Automotive lending also includes loans to borrowers involved with automotive production, primarily Tier 1 and Tier 2 suppliers. Loans to borrowers involved with automotive production totaled approximately $1.3 billion and $1.2 billion at December 31, 2015 and 2014, respectively.
December 31, 2015, dealer loans, as shown in the table above, totaled $6.6 billion, of which approximately $4.1 billion, or 63 percent, were to foreign franchises, and $1.9 billion, or 28 percent, were to domestic franchises. Other dealer loans, totaling $561 million, or 9 percent, at December 31, 2015, include obligations where a primary franchise was indeterminable, such as loans to large public dealership consolidators and rental car, leasing, heavy truck and recreation vehicle companies.
There were no nonaccrual loans to automotive borrowers at December 31, 2015, compared to $4 million at December 31, 2014. There were no automotive net loan charge-offs in 2015 and 2014.
For further information regarding significant group concentrations of credit risk, refer to Note 5 to the consolidated financial statements.
Commercial Real Estate Lending
The following table summarizes the Corporation's commercial real estate loan portfolio by loan category.
|
| | | | | | | |
| (in millions) | | | |
| December 31 | 2015 | | 2014 |
| Real estate construction loans: | | | |
| Commercial Real Estate business line (a) | $ | 1,681 |
| | $ | 1,606 |
|
| Other business lines (b) | 320 |
| | 349 |
|
| Total real estate construction loans | $ | 2,001 |
| | $ | 1,955 |
|
| Commercial mortgage loans: | | | |
| Commercial Real Estate business line (a) | $ | 2,104 |
| | $ | 1,790 |
|
| Other business lines (b) | 6,873 |
| | 6,814 |
|
| Total commercial mortgage loans | $ | 8,977 |
| | $ | 8,604 |
|
| |
| (a) | Primarily loans to real estate developers. |
| |
| (b) | Primarily loans secured by owner-occupied real estate. |
The Corporation limits risk inherent in its commercial real estate lending activities by limiting exposure to those borrowers directly involved in the commercial real estate markets, diversifying credit risk by geography and project type, and maintaining conservative policies on loan-to-value ratios for such loans. Commercial real estate loans, consisting of real estate construction and commercial mortgage loans, totaled $11.0 billion at December 31, 2015, of which $3.8 billion, or 34 percent, were to borrowers in the Commercial Real Estate business line, which includes loans to real estate developers. The remaining $7.2 billion, or 66 percent, of commercial real estate loans is to borrowers in other business lines and consisted primarily of owner-occupied commercial mortgages which bear credit characteristics similar to non-commercial real estate business loans. In the Texas market, commercial real estate loans totaled $2.6 billion at December 31, 2015, of which $1.4 billion were to borrowers in the Commercial Real Estate business line. Substantially all of the remaining $1.2 billion were owner-occupied commercial mortgages. Loans in the Commercial Real Estate business line secured by properties located in Texas totaled $1.1 billion at December 31, 2015, primarily including $611 million for multifamily projects, $197 million for commercial projects and $88 million for retail projects. No loans in the Commercial Real Estate business line that were secured by properties located in Texas were on nonaccrual status at December 31, 2015.
The real estate construction loan portfolio primarily contains loans made to long-time customers with satisfactory completion experience. Credit quality in the real estate construction loan portfolio was strong, with $1 million on nonaccrual status at December 31, 2015, compared to $2 million on nonaccrual status at December 31, 2014, and real estate construction loan net recoveries of $1 million in 2015 and $4 million in 2014.
Loans in the commercial mortgage portfolio generally mature within three to five years. Of the $2.1 billion of commercial mortgage loans in the Commercial Real Estate business line, $16 million were on nonaccrual status at December 31, 2015, compared to $1.8 billion with $22 million on nonaccrual status at December 31, 2014. Commercial mortgage loan net recoveries in the Commercial Real Estate business line were $5 million and $8 million in 2015 and 2014, respectively. In other business lines, $44 million and $73 million of commercial mortgage loans were on nonaccrual status at December 31, 2015 and 2014, respectively, and net recoveries were $13 million in 2015 compared to net charge-offs of $2 million in 2014.
Residential Real Estate Lending
The following table summarizes the Corporation's residential mortgage and home equity loan portfolios by geographic market.
|
| | | | | | | | | | | | | | | | | | | | | | | | | | | |
| (dollar amounts in millions) | 2015 | | 2014 |
| December 31 | Residential
Mortgage
Loans | | % of
Total | | Home
Equity
Loans | | % of
Total | | Residential
Mortgage
Loans | | % of
Total | | Home
Equity
Loans | | % of
Total |
| Geographic market: | | | | | | | | | | | | | | | |
| Michigan | $ | 387 |
| | 21 | % | | $ | 785 |
| | 46 | % | | $ | 417 |
| | 23 | % | | $ | 795 |
| | 48 | % |
| California | 874 |
| | 47 |
| | 611 |
| | 35 |
| | 831 |
| | 46 |
| | 564 |
| | 34 |
|
| Texas | 325 |
| | 17 |
| | 269 |
| | 16 |
| | 337 |
| | 18 |
| | 247 |
| | 15 |
|
| Other Markets | 284 |
| | 15 |
| | 55 |
| | 3 |
| | 246 |
| | 13 |
| | 52 |
| | 3 |
|
| Total | $ | 1,870 |
| | 100 | % | | $ | 1,720 |
| | 100 | % | | $ | 1,831 |
| | 100 | % | | $ | 1,658 |
| | 100 | % |
Residential real estate loans, which consist of traditional residential mortgages and home equity loans and lines of credit, totaled $3.6 billion at December 31, 2015. Residential mortgages totaled $1.9 billion at December 31, 2015, and were primarily larger, variable-rate mortgages originated and retained for certain private banking relationship customers. Of the $1.9 billion of residential mortgage loans outstanding, $27 million were on nonaccrual status at December 31, 2015. The home equity portfolio totaled $1.7 billion at December 31, 2015, of which $1.5 billion was outstanding under primarily variable-rate, interest-only home equity lines of credit, $131 million were in amortizing status and $56 million were closed-end home equity loans. Of the $1.7 billion of home equity loans outstanding, $27 million were on nonaccrual status at December 31, 2015. A majority of the home equity portfolio was secured by junior liens at December 31, 2015. The residential real estate portfolio is principally located within the Corporation's primary geographic markets. Substantially all residential real estate loans past due 90 days or more are placed on nonaccrual status, and substantially all junior lien home equity loans that are current or less than 90 days past due are placed on nonaccrual status if full collection of the senior position is in doubt. At no later than 180 days past due, such loans are charged off to current appraised values less costs to sell.
Energy Lending
The Corporation has a portfolio of energy and energy-related loans that are included primarily in "commercial loans" in the consolidated balance sheets. The Corporation has over 30 years of experience in energy lending, with a focus on middle market companies in the oil and gas business. Customers in the Corporation's Energy business line (approximately 200 borrowers at December 31, 2015) are engaged in three segments of the oil and gas business: exploration and production (E&P), midstream and energy services. E&P generally includes such activities as searching for potential oil and gas fields, drilling exploratory wells and operating active wells. Commitments to E&P borrowers are generally subject to semi-annual borrowing base re-determinations
based on a variety of factors including updated prices (reflecting market and competitive conditions), energy reserve levels and the impact of hedging. The midstream sector is generally involved in the transportation, storage and marketing of crude and/or refined oil and gas products. The Corporation's energy services customers provide products and services primarily to the E&P segment. About 95 percent of the loans in the Energy business line are Shared National Credits (SNC), which are facilities greater than $20 million shared by three or more federally supervised institutions, reflecting the Corporation's focus on larger middle market companies that have financing needs that generally exceed internal individual borrower credit risk limits. The Corporation seeks to develop full relationships with SNC borrowers.
In addition to oil and gas loans in the Energy business line, the Corporation is monitoring a portfolio of loans in other lines of business to companies that have a sizable portion of their revenue related to oil and gas or could be otherwise disproportionately negatively impacted by prolonged lower oil and gas prices ("energy-related'), primarily in general Middle Market, Corporate Banking, Small Business, and Technology and Life Sciences. These companies include downstream businesses such as refineries and petrochemical companies, companies that sell products to E&P, midstream and energy services companies, companies involved in developing new technologies for the oil and gas industry, and other similar businesses.
The following table summarizes information about the Corporation's portfolio of energy and energy-related loans.
|
| | | | | | | | | | | | | | | | | | | | | | | |
| (dollar amounts in millions) | 2015 | | 2014 |
| December 31 | Outstandings | Nonaccrual | Criticized | | Outstandings | Nonaccrual | Criticized |
| Exploration and production (E&P) | $ | 2,111 |
| 69 | % | $ | 108 |
| $ | 967 |
| | $ | 2,539 |
| 71 | % | $ | — |
| $ | 73 |
|
| Midstream | 479 |
| 15 |
| — |
| 42 |
| | 454 |
| 13 |
| — |
| — |
|
| Services | 480 |
| 16 |
| 24 |
| 235 |
| | 566 |
| 16 |
| — |
| 26 |
|
| Total Energy business line | 3,070 |
| 100 | % | 132 |
| 1,244 |
| | 3,559 |
| 100 | % | — |
| 99 |
|
| Energy-related | 624 |
| | 29 |
| 187 |
| | 780 |
| | 27 |
| 98 |
|
| Total energy and energy-related | $ | 3,694 |
| | $ | 161 |
| $ | 1,431 |
| | $ | 4,339 |
| | $ | 27 |
| $ | 197 |
|
| As a percentage of total energy and energy-related loans | 4 | % | 38 | % | | | | 1 | % | 5 | % |
Loans in the Energy business line were $3.1 billion, or approximately 6 percent of total loans, at December 31, 2015, compared to $3.6 billion, or approximately 7 percent of total loans, at December 31, 2014, a decrease of $489 million, or 14%. Total exposure, including unused commitments to extend credit and letters of credit, was $6.4 billion and $7.1 billion at December 31, 2015 and 2014, respectively. The decrease in total exposure in the Energy business line primarily reflected reduced borrowing bases as a result of the decline in value of oil and gas reserves, while the decrease in outstandings largely reflected energy customers taking actions to adjust their cash flow and reduce their bank debt. As of December 31, 2015, a majority of the Corporation's E&P customers had at least 50 percent of their oil and/or gas production hedged up to the end of 2016. The value and coverage benefit of such hedging contracts are dependent upon the underlying oil/gas price in each contract and will be different for each borrower. Approximately 95 percent of the loans outstanding and 90 percent of total exposure in the Energy business line had varying levels and types of collateral at December 31, 2015, including oil and gas reserves and pipelines, equipment, accounts receivable, inventory and other assets, or some combination thereof. Energy-related outstandings were approximately $624 million at December 31, 2015 (approximately 110 relationships), a decrease of $156 million, or 20%, compared to December 31, 2014.
Criticized energy and energy-related loans increased from $197 million, or 5 percent of total energy and energy-related loans, at December 31, 2014, to $1.4 billion or 38 percent at December 31, 2015, in part reflecting the Corporation's weighting of current and expected operating cash flows in the assessment of the probability of default. Nonaccrual energy and energy-related loans increased to $161 million, or 4 percent of total energy and energy-related loans at December 31, 2015, compared to $27 million, or 1 percent at December 31, 2014. Energy and energy-related net loan charge-offs were $47 million for the year ended December 31, 2015, with $28 million from the energy portfolio and $19 million from the energy-related portfolio.
The Corporation's allowance methodology carefully considers the various risk elements within its loan portfolio. At December 31, 2015, the reserve allocation for energy and energy-related loans was over 4 percent of total energy and energy-related loans. The reserve allocation for energy and energy-related loans appropriately incorporated the changing dynamics in energy and energy-related loans described above, including but not limited to, continued negative migration in the portfolio and the value of collateral considered in determining estimated loss given default, which has resulted in increases in reserves for this portfolio for the past five quarterly periods. The Corporation continued to incorporate a qualitative reserve component for energy and energy-related loans at December 31, 2015, which provided for incurred losses that emerged between the borrower's most recent internal risk rating review and the end of the year, due to the uncertainty associated with continued volatility and impact of sustained lower oil and gas prices. In developing the qualitative adjustment, management considered a range of possible outcomes for probability of default, loss given default and the loss emergence period, as well as historical migration and loss experience under similar economic conditions, based on the conditions that existed at that time.
Subsequent to December 31, 2015, oil and gas prices dropped significantly, and the Corporation saw additional negative migration into criticized loans after updating the price decks for January 2016 oil prices. The Corporation expects that if current conditions persist, it could result in an estimated additional provision of between $75 million and $125 million, recognized primarily in the first quarter 2016. Net energy and energy-related charge-offs are expected to be manageable.
Refer to the "Allowance for Credit Losses" subheading earlier in this section for a discussion of changes in the allowance for loan losses as a result of the above-described events.
International Exposure
International assets are subject to general risks inherent in the conduct of business in foreign countries, including economic uncertainties and each foreign government's regulations. Risk management practices minimize the risk inherent in international lending arrangements. These practices include structuring bilateral agreements or participating in bank facilities, which secure repayment from sources external to the borrower's country. Accordingly, such international outstandings are excluded from the cross-border risk of that country.
Mexico, with cross-border outstandings of $617 million (0.86 percent of total assets), $670 million (0.97 percent of total assets) and $645 million (0.99 percent of total assets) at December 31, 2015, 2014 and 2013, respectively, was the only country with outstandings between 0.75 and 1.00 percent of total assets at year-end 2015, 2014 and 2013. There were no countries with cross-border outstandings exceeding 1.00 percent of total assets at year-end 2015, 2014 and 2013.
The Corporation's international strategy is to focus on international companies doing business in North America, with an emphasis on the Corporation's primary geographic markets.
The following table summarizes cross-border exposure to entities domiciled in Mexico and Europe at December 31, 2015 and 2014.
|
| | | | | | | | |
| (in millions) | | | | |
| December 31 | | 2015 | | 2014 |
| Mexico exposure: | | | | |
| Commercial and industrial | | $ | 617 |
| | $ | 661 |
|
| Banks and other financial institutions | | — |
| | 9 |
|
| Total outstanding | | 617 |
| | 670 |
|
| Unfunded commitments and guarantees | | 206 |
| | 179 |
|
| Total Mexico exposure | | $ | 823 |
| | $ | 849 |
|
| | | | | |
| European exposure: | | | | |
| Commercial and industrial | | $ | 285 |
| | $ | 211 |
|
| Banks and other financial institutions | | 35 |
| | 52 |
|
| Total outstanding | | 320 |
| | 263 |
|
| Unfunded commitments and guarantees | | 456 |
| | 382 |
|
| Total European exposure (a) | | $ | 776 |
| | $ | 645 |
|
| |
| (a) | Primarily United Kingdom and the Netherlands. |
MARKET AND LIQUIDITY RISK
Market risk represents the risk of loss due to adverse movements in market rates or prices, including interest rates, foreign exchange rates, commodity prices and equity prices. Liquidity risk represents the failure to meet financial obligations coming due resulting from an inability to liquidate assets or obtain adequate funding, and the inability to easily unwind or offset specific exposures without significant changes in pricing, due to inadequate market depth or market disruptions.
The Asset and Liability Policy Committee (ALCO) of the Corporation establishes and monitors compliance with the policies and risk limits pertaining to market and liquidity risk management activities. ALCO meets regularly to discuss and review market and liquidity risk management strategies, and consists of executive and senior management from various areas of the Corporation, including treasury, finance, economics, lending, deposit gathering and risk management. The Treasury Department mitigates market and liquidity risk through the actions it takes to manage the Corporation's market, liquidity and capital positions under the direction of ALCO.
Market Risk Analytics, within the Office of Enterprise Risk, supports ALCO in measuring, monitoring and managing interest rate risk and coordinating all other market risks. Key activities encompass: (i) providing information and analysis of the Corporation's balance sheet structure and measurement of interest rate and all other market risks; (ii) monitoring and reporting of the Corporation's positions relative to established policy limits and guidelines; (iii) developing and presenting analysis and strategies to adjust risk positions; (iv) reviewing and presenting policies and authorizations for approval; (v) monitoring of industry trends
and analytical tools to be used in the management of interest rate and all other market risks; and (vi) developing and monitoring the interest rate risk economic capital estimate.
Interest Rate Risk
Net interest income is the primary source of revenue for the Corporation. Interest rate risk arises in the normal course of business due to differences in the repricing and cash flow characteristics of assets and liabilities, primarily through the Corporation's core business activities of extending loans and acquiring deposits. The Corporation's balance sheet is predominantly characterized by floating-rate loans funded by a combination of core deposits and wholesale borrowings. Approximately 85 percent of the Corporation's loans were floating at December 31, 2015, of which approximately 75 percent were based on LIBOR and 25 percent were based on Prime. This creates sensitivity to interest rate movements due to the imbalance between the floating-rate loan portfolio and the more slowly repricing deposit products. In addition, the growth and/or contraction in the Corporation's loans and deposits may lead to changes in sensitivity to interest rate movements in the absence of mitigating actions. Examples of such actions are purchasing investment securities, primarily fixed-rate, which provide liquidity to the balance sheet and act to mitigate the inherent interest sensitivity, and hedging the sensitivity with interest rate swaps. The Corporation actively manages its exposure to interest rate risk, with the principal objective of optimizing net interest income and the economic value of equity while operating within acceptable limits established for interest rate risk and maintaining adequate levels of funding and liquidity.
Since no single measurement system satisfies all management objectives, a combination of techniques is used to manage interest rate risk. These techniques examine the impact of interest rate risk on net interest income and the economic value of equity under a variety of alternative scenarios, including changes in the level, slope and shape of the yield curve, utilizing multiple simulation analyses. Simulation analyses produce only estimates of net interest income, as the assumptions used are inherently uncertain. Actual results may differ from simulated results due to many factors, including, but not limited to, the timing, magnitude and frequency of changes in interest rates, market conditions, regulatory impacts and management strategies.
Sensitivity of Net Interest Income to Changes in Interest Rates
The analysis of the impact of changes in interest rates on net interest income under various interest rate scenarios is management's principal risk management technique. Management models a base case net interest income under an unchanged interest rate environment and what is believed to be the most likely balance sheet structure. Existing derivative instruments entered into for risk management purposes are included in the analysis, but no additional hedging is currently forecasted. These derivative instruments currently comprise interest rate swaps that convert fixed-rate long-term debt to variable rates. This base case net interest income is then compared against interest rate scenarios in which rates rise or decline in a linear, non-parallel fashion from the base case over 12 months. In the first scenario presented, short-term interest rates increase 200 basis points, resulting in an average increase in short-term interest rates of 100 basis points over the period (+200 scenario). Due to the current low level of interest rates, the second scenario reflects a decline in short-term interest rates to zero percent.
Each scenario includes assumptions such as loan growth, investment security prepayment levels, depositor behavior, yield curve changes, loan and deposit pricing, and overall balance sheet mix and growth. In the +200 scenario, assumptions related to loan growth are based on historical experience. Because deposit balances have continued to grow significantly in this persistent low rate environment, historical depositor behavior may be less indicative of future trends. As a result, the December 31, 2015 +200 scenario reflects a greater decrease in deposits than we have experienced historically as rates begin to rise. Investment securities modeling includes the replacement of prepayments as well as an estimate of projected growth in high quality liquid assets (HQLA) needed for compliance with the LCR, and expected funding maturities are included. In addition, the model reflects deposit pricing based on historical price movements with short-term interest rates and loan spread held at current levels. Changes in actual economic activity may result in a materially different interest rate environment as well as a balance sheet structure that is different from the changes management included in its simulation analysis.
The table below, as of December 31, 2015 and 2014, displays the estimated impact on net interest income during the next 12 months by relating the base case scenario results to those from the rising and declining rate scenarios described above.
|
| | | | | | | | | | | | | |
| | Estimated Annual Change |
| (in millions) | 2015 | | 2014 |
| December 31 | Amount | | % | | Amount | | % |
| Change in Interest Rates: | | | | | | | |
| Rising 200 basis points | $ | 212 |
| | 12 | % | | $ | 224 |
| | 13 | % |
| Declining to zero percent | (88 | ) | | (5 | ) | | (32 | ) | | (2 | ) |
Sensitivity decreased modestly from December 31, 2014 to December 31, 2015, primarily due to the recent addition of HQLA for the LCR, changes in the current balance sheet mix driving a revised forecast, and the modeled reduction in deposit growth in the +200 scenario discussed above. The risk to declining interest rates is limited by an assumed floor on interest rates of zero percent, but reflects the recent rise in short-term interest rates, allowing for a decline of 50 basis points at December 31, 2015, relative to a 25 basis point decline at December 31, 2014.
The table below, as of December 31, 2015, illustrates the estimated sensitivity of the above results to a change in deposit balance assumptions in the +200 scenario, with all other assumptions held constant. In this analysis, average noninterest-bearing deposit run-off in the 12-month period has been increased by $1 billion and $3 billion from the run-off included in the standard +200 scenario presented above and assumes the deposit run-off reduces excess reserves and increases purchased funds. The analysis is provided as an indicator of the sensitivity of net interest income to the modeled deposit run-off assumption. It is not meant to reflect management's expectation or best estimate. Actual changes in deposit balances may vary from those reflected.
|
| | | | | | |
| | +200 Basis Points |
| (in millions) | Estimated Annual Change |
| December 31, 2015 | Amount | | % |
| Incremental Average Decrease in Noninterest-bearing Deposit Balances: | | | |
| $1 billion | $ | 201 |
| | 11 | % |
| $3 billion | 178 |
| | 10 |
|
Sensitivity of Economic Value of Equity to Changes in Interest Rates
In addition to the simulation analysis on net interest income, an economic value of equity analysis provides an alternative view of the interest rate risk position. The economic value of equity is the difference between the estimate of the economic value of the Corporation's financial assets, liabilities and off-balance sheet instruments, derived through discounting cash flows based on actual rates at the end of the period and the estimated economic value after applying the estimated impact of rate movements. The economic value of equity analysis is based on an immediate parallel 200 basis point increase and 50 basis point decrease in interest rates.
The table below, as of December 31, 2015 and 2014, displays the estimated impact on the economic value of equity from the interest rate scenario described above.
|
| | | | | | | | | | | | | |
| | 2015 | | 2014 |
| (in millions) | Amount | | % | | Amount | | % |
| Change in Interest Rates: | | | | | | | |
| Rising 200 basis points | $ | 1,021 |
| | 9 | % | | $ | 1,218 |
| | 10 | % |
| Falling to zero percent | (538 | ) | | (5 | ) | | (293 | ) | | (2 | ) |
The change in the sensitivity of the economic value of equity to a 200 basis point parallel increase in rates between December 31, 2014 and December 31, 2015 was primarily driven by growth in deposits without a stated maturity, by changes in market interest rates at the middle to long end of the curve, which most significantly impact the value of deposits without a stated maturity, and by recent security purchases. The change in the declining scenario is most significantly impacted by the more significant drop in interest rates at December 31, 2015.
LOAN MATURITIES AND INTEREST RATE SENSITIVITY
|
| | | | | | | | | | | | | | | |
| (in millions) | Loans Maturing |
| December 31, 2015 | Within One Year (a) | | After One But Within Five Years | | After Five Years | | Total |
| Commercial loans | $ | 14,854 |
| | $ | 15,580 |
| | $ | 1,225 |
| | $ | 31,659 |
|
| Real estate construction loans | 540 |
| | 1,350 |
| | 111 |
| | 2,001 |
|
| Commercial mortgage loans | 1,882 |
| | 4,975 |
| | 2,120 |
| | 8,977 |
|
| International loans | 623 |
| | 688 |
| | 57 |
| | 1,368 |
|
| Total | $ | 17,899 |
| | $ | 22,593 |
| | $ | 3,513 |
| | $ | 44,005 |
|
| Sensitivity of loans to changes in interest rates: | | | | | | | |
| Predetermined (fixed) interest rates | $ | 1,130 |
| | $ | 2,561 |
| | $ | 889 |
| | $ | 4,580 |
|
| Floating interest rates | 16,769 |
| | 20,032 |
| | 2,624 |
| | 39,425 |
|
| Total | $ | 17,899 |
| | $ | 22,593 |
| | $ | 3,513 |
| | $ | 44,005 |
|
| |
| (a) | Includes demand loans, loans having no stated repayment schedule or maturity and overdrafts. |
The Corporation uses investment securities and derivative instruments as asset and liability management tools with the overall objective of managing the volatility of net interest income from changes in interest rates. These tools assist management in achieving the desired interest rate risk management objectives. Activity related to derivative instruments currently involves interest rate swaps effectively converting fixed-rate medium- and long-term debt to floating rate.
Risk Management Derivative Instruments
|
| | | | | | | | | | | |
| (in millions) Risk Management Notional Activity | Interest Rate Contracts | | Foreign Exchange Contracts | | Totals |
| Balance at January 1, 2014 | $ | 1,450 |
| | $ | 253 |
| | $ | 1,703 |
|
| Additions | 600 |
| | 14,012 |
| | 14,612 |
|
| Maturities/amortizations | (250 | ) | | (13,757 | ) | | (14,007 | ) |
| Balance at December 31, 2014 | $ | 1,800 |
| | $ | 508 |
| | $ | 2,308 |
|
| Additions | 1,025 |
| | 15,846 |
| | 16,871 |
|
| Maturities/amortizations | (300 | ) | | (15,761 | ) | | (16,061 | ) |
| Balance at December 31, 2015 | $ | 2,525 |
| | $ | 593 |
| | $ | 3,118 |
|
The notional amount of risk management interest rate swaps totaled $2.5 billion at December 31, 2015, and $1.8 billion at December 31, 2014, all under fair value hedging strategies, converting fixed-rate medium- and long-term debt to floating rate. The fair value of risk management interest rate swaps was a net unrealized gain of $147 million at December 31, 2015, compared to a net unrealized gain of $175 million at December 31, 2014. Risk management interest rate swaps generated $70 million and $72 million of net interest income for the years ended December 31, 2015 and 2014, respectively.
In addition to interest rate swaps, the Corporation employs various other types of derivative instruments as offsetting positions to mitigate exposures to foreign currency risks associated with specific assets and liabilities (e.g., customer loans or deposits denominated in foreign currencies). Such instruments may include foreign exchange forward contracts and foreign exchange swap agreements. The aggregate notional amounts of these risk management derivative instruments at December 31, 2015 and 2014 were $593 million and $508 million, respectively.
Further information regarding risk management derivative instruments is provided in Note 8 to the consolidated financial statements.
Customer-Initiated and Other Derivative Instruments
|
| | | | | | | | | | | | | | | |
| (in millions) Customer-Initiated and Other Notional Activity | Interest Rate Contracts | | Energy Derivative Contracts | | Foreign Exchange Contracts | | Totals |
| Balance at January 1, 2014 | $ | 11,697 |
| | $ | 5,374 |
| | $ | 1,764 |
| | $ | 18,835 |
|
| Additions | 3,298 |
| | 2,925 |
| | 62,871 |
| | 69,094 |
|
| Maturities/amortizations | (1,668 | ) | | (3,160 | ) | | (62,641 | ) | | (67,469 | ) |
| Terminations | (999 | ) | | (207 | ) | | — |
| | (1,206 | ) |
| Balance at December 31, 2014 | $ | 12,328 |
| | $ | 4,932 |
| | $ | 1,994 |
| | $ | 19,254 |
|
| Additions | 3,365 |
| | 1,498 |
| | 60,054 |
| | 64,917 |
|
| Maturities/amortizations | (2,199 | ) | | (3,070 | ) | | (59,757 | ) | | (65,026 | ) |
| Terminations | (1,266 | ) | | (233 | ) | | — |
| | (1,499 | ) |
| Balance at December 31, 2015 | $ | 12,228 |
| | $ | 3,127 |
| | $ | 2,291 |
| | $ | 17,646 |
|
The Corporation writes and purchases interest rate caps and floors and enters into foreign exchange contracts, interest rate swaps and energy derivative contracts to accommodate the needs of customers requesting such services. Changes in the fair value of customer-initiated and other derivatives are recognized in earnings as they occur. To limit the market risk of these activities, the Corporation generally takes offsetting positions with dealers. The notional amounts of offsetting positions are included in the table above. Customer-initiated and other notional activity represented 85 percent and 89 percent of total interest rate, energy and foreign exchange contracts at December 31, 2015 and 2014, respectively.
Further information regarding customer-initiated and other derivative instruments is provided in Note 8 to the consolidated financial statements.
Liquidity Risk and Off-Balance Sheet Arrangements
Liquidity is the ability to meet financial obligations through the maturity or sale of existing assets or the acquisition of additional funds. Various financial obligations, including contractual obligations and commercial commitments, may require future cash payments by the Corporation. Certain obligations are recognized on the consolidated balance sheets, while others are off-balance sheet under U.S. generally accepted accounting principles.
The following contractual obligations table summarizes the Corporation's noncancelable contractual obligations and future required minimum payments. Refer to Notes 6, 9, 10, 11, 12, and 18 to the consolidated financial statements for further information regarding these contractual obligations.
Contractual Obligations
|
| | | | | | | | | | | | | | | | | | | |
| (in millions) | Minimum Payments Due by Period |
| December 31, 2015 | Total | | Less than 1 Year | | 1-3 Years | | 3-5 Years | | More than 5 Years |
| Deposits without a stated maturity (a) | $ | 56,269 |
| | $ | 56,269 |
| | $ | — |
| | $ | — |
| | $ | — |
|
| Certificates of deposit and other deposits with a stated maturity (a) | 3,584 |
| | 2,792 |
| | 635 |
| | 134 |
| | 23 |
|
| Short-term borrowings (a) | 23 |
| | 23 |
| | — |
| | — |
| | — |
|
| Medium- and long-term debt (a) | 2,941 |
| | 650 |
| | 502 |
| | 1,039 |
| | 750 |
|
| Operating leases | 456 |
| | 73 |
| | 132 |
| | 97 |
| | 154 |
|
| Commitments to fund low income housing partnerships | 137 |
| | 80 |
| | 42 |
| | 10 |
| | 5 |
|
| Other long-term obligations (b) | 265 |
| | 61 |
| | 92 |
| | 19 |
| | 93 |
|
| Total contractual obligations | $ | 63,675 |
| | $ | 59,948 |
| | $ | 1,403 |
| | $ | 1,299 |
| | $ | 1,025 |
|
| | | | | | | | | | |
| Medium- and long-term debt (parent company only) (a) (c) | $ | 600 |
| | $ | — |
| | $ | — |
| | $ | 350 |
| | $ | 250 |
|
| |
| (a) | Deposits and borrowings exclude accrued interest. |
| |
| (b) | Includes unrecognized tax benefits. |
| |
| (c) | Parent company only amounts are included in the medium- and long-term debt minimum payments above. |
In addition to contractual obligations, other commercial commitments of the Corporation impact liquidity. These include commitments to fund indirect private equity and venture capital investments, unused commitments to extend credit, standby letters of credit and financial guarantees, and commercial letters of credit. The following table summarizes the Corporation's commercial commitments and expected expiration dates by period.
Commercial Commitments
|
| | | | | | | | | | | | | | | | | | | |
| (in millions) | Expected Expiration Dates by Period |
| December 31, 2015 | Total | | Less than 1 Year | | 1-3 Years | | 3-5 Years | | More than 5 Years |
| Commitments to fund indirect private equity and venture capital investments | $ | 4 |
| | $ | — |
| | $ | — |
| | $ | — |
| | $ | 4 |
|
| Unused commitments to extend credit | 28,529 |
| | 8,506 |
| | 9,820 |
| | 7,774 |
| | 2,429 |
|
| Standby letters of credit and financial guarantees | 3,985 |
| | 3,164 |
| | 509 |
| | 280 |
| | 32 |
|
| Commercial letters of credit | 41 |
| | 37 |
| | 4 |
| | — |
| | — |
|
| Total commercial commitments | $ | 32,559 |
| | $ | 11,707 |
| | $ | 10,333 |
| | $ | 8,054 |
| | $ | 2,465 |
|
Since many of these commitments expire without being drawn upon, the total amount of these commercial commitments does not necessarily represent the future cash requirements of the Corporation. Refer to the "Other Market Risks" section below and Note 8 to the consolidated financial statements for a further discussion of these commercial commitments.
Wholesale Funding
The Corporation may access the purchased funds market when necessary, which includes foreign office time deposits and short-term borrowings. Capacity for incremental purchased funds at December 31, 2015 included the ability to purchase federal funds, sell securities under agreements to repurchase, as well as issue deposits to institutional investors and issue certificates of deposit through brokers. Purchased funds totaled $55 million at December 31, 2015, compared to $251 million at December 31, 2014. At December 31, 2015, the Bank had pledged loans totaling $24 billion which provided for up to $18 billion of available collateralized borrowing with the FRB.
The Bank is a member of the Federal Home Loan Bank of Dallas, Texas (FHLB), which provides short- and long-term funding to its members through advances collateralized by real estate-related assets. Actual borrowing capacity is contingent on the amount of collateral available to be pledged to the FHLB. At December 31, 2015, $14.3 billion of real estate-related loans were pledged to the FHLB as blanket collateral to provide capacity for potential future borrowings of approximately $6 billion. As of December 31, 2015, the Corporation did not have any outstanding borrowings from the FHLB.
Additionally, the Bank had the ability to issue up to $14.0 billion of debt at December 31, 2015 under an existing $15.0 billion medium-term senior note program which allows the issuance of debt with maturities between three months and 30 years. The Corporation also maintains a shelf registration statement with the Securities and Exchange Commission from which it may issue debt and/or equity securities.
The ability of the Corporation and the Bank to raise funds at competitive rates is impacted by rating agencies' views of the credit quality, liquidity, capital and earnings of the Corporation and the Bank. As of December 31, 2015, the four major rating agencies had assigned the following ratings to long-term senior unsecured obligations of the Corporation and the Bank. A security rating is not a recommendation to buy, sell, or hold securities and may be subject to revision or withdrawal at any time by the assigning rating agency. Each rating should be evaluated independently of any other rating.
|
| | | | | | | |
| | Comerica Incorporated | | Comerica Bank |
| December 31, 2015 | Rating | Outlook | | Rating | Outlook |
| Standard and Poor's (a) | A- | Negative | | | A | Negative | |
| Moody's Investors Service (b) | A3 | Stable | | | A3 | Stable | |
| Fitch Ratings | A | Stable | | | A | Stable | |
| DBRS | A | Stable | | | A (High) | Stable | |
| |
| (a) | In February 2016, Standard and Poor's downgraded the Corporation's and the Bank's long-term senior credit ratings one notch, from A- to BBB+ for Comerica Incorporated and from A to A- for Comerica Bank, and maintained its "Negative" outlook. |
| |
| (b) | In February 2016, Moody's Investors Service revised its outlook to "Negative." |
The Corporation satisfies liquidity requirements with either liquid assets or various funding sources. Liquid assets, which totaled $16.4 billion at December 31, 2015, compared to $13.3 billion at December 31, 2014, provide a reservoir of liquidity. Liquid assets include cash and due from banks, federal funds sold, interest-bearing deposits with banks, other short-term investments and unencumbered investment securities.
In September 2014, U.S. banking regulators issued a final rule implementing a quantitative liquidity requirement in the U.S. generally consistent with the LCR minimum liquidity measure established under the Basel III liquidity framework. Under the rule, the Corporation is subject to a modified LCR standard, which requires a financial institution to hold a minimum level of HQLA to fully cover modified net cash outflows under a 30-day systematic liquidity stress scenario. The rule is effective for the Corporation on January 1, 2016. During the transition year, 2016, the Corporation will be required to maintain a minimum LCR of 90 percent. Beginning January 1, 2017, and thereafter, the minimum required LCR will be 100 percent. At December 31, 2015, the Corporation was in compliance with the fully phased-in LCR requirement.
In the third quarter 2015, the Bank issued $350 million of 4.00% subordinated notes, swapped to floating at 6-month LIBOR plus 1.478%, maturing in 2025 and $175 million of 2.50% senior notes, swapped to floating at 6-month LIBOR plus 0.6348%, maturing in 2020. In the second quarter 2015, the Bank issued $500 million of 2.50% senior debt maturing in 2020 and swapped it to floating at six-month LIBOR plus 75 basis points. The proceeds from these issuances helped position the Corporation for full compliance with LCR, including a buffer for normal volatility in balance sheet dynamics. Any future funding needs for LCR purposes will depend on loan and deposit trends as well as balance sheet strategy. Should the Corporation need to add HQLA to maintain full compliance with the LCR rule, a variety of wholesale funding sources are available, as previously discussed.
The Basel III liquidity framework includes a second minimum liquidity measure, the Net Stable Funding Ratio (NSFR), which requires the amount of available longer-term, stable sources of funding to be at least 100 percent of the required amount of longer-term stable funding over a one-year period. On October 31, 2014, the Basel Committee on Banking Supervision issued its final NSFR rule, which was originally introduced in 2010 and revised in January 2014. U.S. banking regulators have announced that they expect to issue proposed rules to implement the NSFR in advance of its scheduled global implementation in 2018. While uncertainty exists in the final form and timing of the U.S. rule implementing the NSFR and whether or not the Corporation will be subject to the full requirements, the Corporation is closely monitoring the development of the rule.
The Corporation regularly evaluates its ability to meet funding needs in unanticipated, stressed environments. In conjunction with the quarterly 200 basis point interest rate simulation analyses, discussed in the "Interest Rate Sensitivity" section of this financial review, liquidity ratios and potential funding availability are examined. Each quarter, the Corporation also evaluates its ability to meet liquidity needs under a series of broad events, distinguished in terms of duration and severity. The evaluation as of December 31, 2015 projected that sufficient sources of liquidity were available under each series of events.
Other Market Risks
Market risk related to the Corporation's trading instruments is not significant, as trading activities are limited. Certain components of the Corporation's noninterest income, primarily fiduciary income, are at risk to fluctuations in the market values of underlying assets, particularly equity and debt securities. Other components of noninterest income, primarily brokerage fees, are at risk to changes in the volume of market activity.
OPERATIONAL RISK
Operational risk represents the risk of loss resulting from inadequate or failed internal processes, people and systems, or from external events. The definition includes legal risk, which is the risk of loss resulting from failure to comply with laws and regulations as well as prudent ethical standards and contractual obligations. The definition does not include strategic or reputational
risks. Although operational losses are experienced by all companies and are routinely incurred in business operations, the Corporation recognizes the need to identify and control operational losses and seeks to limit losses to a level deemed appropriate by management, as outlined in the Corporation's risk appetite statement. The appropriate risk level is determined through consideration of the nature of the Corporation's business and the environment in which it operates, in combination with the impact from, and the possible impact on, other risks faced by the Corporation. Operational risk is mitigated through a system of internal controls that are designed to keep operating risks at appropriate levels. The Operational Risk Management Committee monitors risk management techniques and systems. The Corporation has developed a framework that includes a centralized operational risk management function and business/support unit risk coordinators responsible for managing operational risk specific to the respective business lines.
COMPLIANCE RISK
Compliance risk represents the risk of regulatory sanctions or financial loss resulting from the Corporation's failure to comply with regulations and standards of good banking practice. The impact of such risks is highly interdependent with strategic risk, as the reputational impact from compliance breaches can be severe. Activities which may expose the Corporation to compliance risk include, but are not limited to, those dealing with the prevention of money laundering, privacy and data protection, community reinvestment initiatives, fair lending, consumer protection, employment and tax matters, over-the-counter derivative activities and other activities regulated by the Dodd-Frank Wall Street Reform and Consumer Protection Act.
The Enterprise-Wide Compliance Committee, comprising senior and executive business unit managers, as well as managers responsible for compliance, audit and overall risk, oversees compliance risk. This enterprise-wide approach provides a consistent view of compliance across the organization. The Enterprise-Wide Compliance Committee also ensures that appropriate actions are implemented in business units to mitigate risk to an acceptable level.
STRATEGIC RISK
Strategic risk represents the risk of loss due to impairment of reputation, failure to fully develop and execute business plans, failure to assess current and new opportunities in business, markets and products, failure to determine appropriate consideration for risks accepted, and any other event not identified in the defined risk categories of credit, market, operational or compliance risks. Mitigation of the various risk elements that represent strategic risk is achieved through various metrics and initiatives to help the Corporation better understand, measure and report on such risks.
CRITICAL ACCOUNTING POLICIES
The Corporation's consolidated financial statements are prepared based on the application of accounting policies, the most significant of which are described in Note 1. These policies require numerous estimates and strategic or economic assumptions, which may prove inaccurate or subject to variations. Changes in underlying factors, assumptions or estimates could have a material impact on the Corporation's future financial condition and results of operations. At December 31, 2015, the most critical of these significant accounting policies were the policies related to the allowance for credit losses, fair value measurement, goodwill, pension plan accounting and income taxes. These policies were reviewed with the Audit Committee of the Corporation's Board of Directors and are discussed more fully below.
ALLOWANCE FOR CREDIT LOSSES
The allowance for credit losses, which includes both the allowance for loan losses and the allowance for credit losses on lending-related commitments, is calculated with the objective of maintaining a reserve sufficient to absorb estimated probable losses. Management's determination of the appropriateness of the allowance is based on periodic evaluations of the loan portfolio, lending-related commitments, and other relevant factors. This evaluation is inherently subjective as it requires numerous estimates, including the loss content for internal risk ratings, collateral values, the amounts and timing of expected future cash flows, and for lending-related commitments, estimates of the probability of draw on unused commitments.
In determining the allowance for credit losses, the Corporation individually evaluates certain impaired loans, applies standard reserve factors to pools of homogeneous loans and lending-related commitments and incorporates qualitative adjustments. Standard loss factors, applied to the majority of the Corporation's loan portfolio and lending-related commitments, are based on estimates of probabilities of default for individual risk ratings over the loss emergence period and loss given default. Since standard loss factors are applied to large pools of loans, even minor changes in these factors could significantly affect the Corporation's determination of the appropriateness of the allowance for credit losses. To illustrate, if recent loss experience dictated that the estimated standard loss factors would be changed by five percent (of the estimate) across all loan risk ratings, the allowance for loan losses as of December 31, 2015 would change by approximately $31 million. Loss emergence periods are used to determine the most appropriate default horizon associated with the calculation of probabilities of default. Loss emergence periods tend to lengthen during benign economic periods and shorten during periods of economic distress. Considered in isolation, lengthening the loss emergence period assumption would result in an increase to the allowance for credit losses. Because standard loss factors are applied to pools of loans based on the Corporation's internal risk rating system, loss estimates are highly dependent on the accuracy of the risk rating assigned to each loan. The inherent imprecision in the risk rating system resulting from inaccuracy in assigning and/or entering risk ratings in the loan accounting system is monitored by the Corporation's asset quality review function and incorporated in a qualitative adjustment. The Corporation may also include qualitative adjustments intended to capture the impact of certain other uncertainties that exist but are not yet reflected in the standard reserve factors. These qualitative adjustments are based on management's analysis of factors such as portfolios where recent historical losses exceed expected losses or known recent events are expected to alter risk ratings once evidence is acquired, observable macroeconomic metrics, including consideration of regional metrics within the Corporation's footprint, and a qualitative assessment of the lending environment, including underwriting standards, current economic and political conditions, and other factors affecting credit quality. Deterioration in metrics and credit trends included in this analysis would result in an increase to the qualitative adjustment increasing the allowance for credit losses.
Since the fourth quarter 2014, the Corporation has incorporated a qualitative reserve component for energy and energy-related loans, primarily for incurred losses that have yet to emerge in the portfolio due to the inherent lag between the date of an energy borrower's most current internal risk rating review, driving the quantitative reserve, and the allowance measurement date. In developing the qualitative adjustment, management considered a range of possible outcomes for probability of default, loss given default and the loss emergence period, as well as historical migration and loss experience under similar economic conditions. For further discussion of energy and energy-related loans, refer to the "Energy Lending" sub-section in the "Risk Management" section of this financial review.
For further discussion of the methodology used in the determination of the allowance for credit losses, refer to Note 1 to the consolidated financial statements. To the extent actual outcomes differ from management estimates, additional provision for credit losses may be required that would adversely impact earnings in future periods. A substantial majority of the allowance is assigned to business segments. Any earnings impact resulting from actual outcomes differing from management estimates would primarily affect the Business Bank segment.
FAIR VALUE MEASUREMENT
Investment securities available-for-sale, derivatives and deferred compensation plan assets and associated liabilities are recorded at fair value on a recurring basis. Additionally, from time to time, other assets and liabilities may be recorded at fair value on a nonrecurring basis, such as impaired loans that have been reduced based on the fair value of the underlying collateral, other real estate (primarily foreclosed property), nonmarketable equity securities and certain other assets and liabilities. These
nonrecurring fair value adjustments typically involve write-downs of individual assets or application of lower of cost or fair value accounting.
Fair value is an estimate of the exchange price that would be received to sell an asset or paid to transfer a liability in an orderly transaction (i.e., not a forced transaction, such as a liquidation or distressed sale) between market participants at the measurement date and is based on the assumptions market participants would use when pricing an asset or liability. Fair value measurement and disclosure guidance establishes a three-level hierarchy for disclosure of assets and liabilities recorded at fair value. Notes 1 and 2 to the consolidated financial statements includes information about the fair value hierarchy, the extent to which fair value is used to measure assets and liabilities and the valuation methodologies and key inputs used.
At December 31, 2015, assets and liabilities measured using observable inputs that are classified as Level 1 or Level 2 represented 97.9 percent and 100.0 percent of total assets and liabilities recorded at fair value, respectively, and Level 3 assets totaled $244 million, or 2.1 percent of total assets recorded at fair value. Valuations generated from model-based techniques that use at least one significant assumption not observable in the market are considered Level 3. Unobservable assumptions reflect estimates of assumptions market participants would use in pricing the asset or liability. Fair value measurements for assets and liabilities where limited or no observable market data exists often involves significant judgments about assumptions, such as determining an appropriate discount rate that factors in both liquidity and risk premiums, and in many cases may not reflect amounts exchanged in a current sale of the financial instrument. In addition, changes in market conditions may reduce the availability of quoted prices or observable data. For example, reduced liquidity in the capital markets or changes in secondary market activities could result in observable market inputs becoming unavailable. Therefore, when market data is not available, the Corporation would use valuation techniques requiring more management judgment to estimate the appropriate fair value.
GOODWILL
Goodwill is initially recorded as the excess of the purchase price over the fair value of net assets acquired in a business combination and is subsequently evaluated at least annually for impairment. Goodwill impairment testing is performed at the reporting unit level, equivalent to a business segment or one level below. The Corporation has three reporting units: the Business Bank, the Retail Bank and Wealth Management. At December 31, 2015 and 2014, goodwill totaled $635 million, including $380 million allocated to the Business Bank, $194 million allocated to the Retail Bank and $61 million allocated to Wealth Management.
The Corporation performs its annual evaluation of goodwill impairment in the third quarter of each year and on an interim basis if events or changes in circumstances between annual tests suggest additional testing may be warranted to determine if goodwill might be impaired. The quantitative goodwill impairment test is a two-step test. The first step of the goodwill impairment test compares the estimated fair value of identified reporting units with their carrying amount, including goodwill. If the estimated fair value of the reporting unit is less than the carrying value, the second step must be performed to determine the implied fair value of the reporting unit's goodwill and the amount of goodwill impairment, if any. The implied fair value of goodwill is determined as if the reporting unit were being acquired in a business combination. If the implied fair value of goodwill exceeds the goodwill assigned to the reporting unit, there is no impairment. If the goodwill assigned to a reporting unit exceeds the implied fair value of goodwill, an impairment charge is recorded for the excess.
In performing the annual impairment test, the carrying value of each reporting unit is the greater of economic or regulatory capital. The Corporation assigns economic capital using internal management methodologies on the basis of each reporting unit's credit, operational and interest rate risks, as well as goodwill. To determine regulatory capital, each reporting unit is assigned sufficient capital such that their respective Tier 1 ratio, based on allocated risk-weighted assets, is the same as that of the Corporation. Using this two-pronged approach, the Corporation's equity is fully allocated to its reporting units except for capital held primarily for the risk associated with the securities portfolio that is assigned to the Finance segment of the Corporation.
Determining the fair value of reporting units is a subjective process involving the use of estimates and judgments related to the selection of inputs such as future cash flows, discount rates, comparable public company multiples, applicable control premiums and economic expectations used in determining the interest rate environment. The estimated fair values of the reporting units are determined using a blend of two commonly used valuation techniques: the market approach and the income approach. For the market approach, valuations of reporting units consider a combination of earnings, equity and other multiples from companies with characteristics similar to the reporting unit. Since the fair values determined under the market approach are representative of noncontrolling interests, the valuations accordingly incorporate a control premium. For the income approach, estimated future cash flows and terminal value are discounted. Estimated future cash flows are derived from internal forecasts and economic expectations for each reporting unit which incorporate uncertainty factors inherent to long-term projections. The applicable discount rate is based on the imputed cost of equity capital appropriate for each reporting unit, which incorporates the risk-free rate of return, the level of non-diversified risk associated with companies with characteristics similar to the reporting unit, a size risk premium and a market equity risk premium.
Economic conditions impact the assumptions related to interest and growth rates, loss rates and imputed cost of equity capital. The fair value estimates for each reporting unit incorporated current economic and market conditions, including the recent Federal Reserve announcements and the impact of legislative and regulatory changes, to the extent known and as described above. However, further weakening in the economic environment, such as adverse changes in interest rates, a decline in the performance
of the reporting units or other factors could cause the fair value of one or more of the reporting units to fall below their carrying value, resulting in a goodwill impairment charge. Additionally, new legislative or regulatory changes not anticipated in management's expectations may cause the fair value of one or more of the reporting units to fall below the carrying value, resulting in a goodwill impairment charge. Any impairment charge would not affect the Corporation's regulatory capital ratios, tangible common equity ratio or liquidity position.
The annual test of goodwill impairment was performed as of the beginning of the third quarter 2015. The Corporation's assumptions included modest increases to the Federal funds target rate until eventually reaching a normal interest rate environment. At the conclusion of the first step of the annual goodwill impairment tests performed in the third quarter 2015, the estimated fair values of all reporting units substantially exceeded their carrying amounts, including goodwill. The results of the annual test of the goodwill impairment test for each reporting unit were subjected to stress testing as appropriate.
The Corporation performs a goodwill impairment test at least annually, and on an interim basis if events or changes in circumstances between annual tests suggest additional testing may be warranted to determine if goodwill might be impaired. During the fourth quarter 2015, the Corporation's stock price traded below tangible book value per share, and sustained lower oil and gas prices continued to adversely impact the Corporation's portfolio of energy and energy-related loans in the Business Bank reporting unit. The Corporation updated its business outlook for 2016 to reflect its assessment of those market conditions and qualitatively considered their impact on the goodwill impairment test. After evaluating the impact of the continued decline of energy prices and changes in market expectations for the upcoming year against the results from the annual impairment test and its sensitivity analysis, the Corporation determined that that it was more likely than not that the fair value of the Business Bank continued to be greater than its carrying value, and therefore an interim goodwill impairment test was not performed.
For further information about the Corporation's goodwill accounting policy, refer to Note 1 to the consolidated financial statements.
PENSION PLAN ACCOUNTING
The Corporation has defined benefit pension plans in effect for substantially all full-time employees hired before January 1, 2007. Benefits under the plans are based on years of service, age and compensation. Assumptions are made concerning future events that will determine the amount and timing of required benefit payments, funding requirements and defined benefit pension expense. The major assumptions are the discount rate used in determining the current benefit obligation, the long-term rate of return expected on plan assets, the rate of compensation increase and the estimated mortality rate. The discount rate is determined by matching the expected cash flows of the pension plans to a portfolio of high quality corporate bonds as of the measurement date, December 31. The long-term rate of return expected on plan assets is set after considering both long-term returns in the general market and long-term returns experienced by the assets in the plan. The current target asset allocation model for the plans is detailed in Note 17 to the consolidated financial statements. The expected returns on these various asset categories are blended to derive one long-term return assumption. The assets are invested in certain collective investment and mutual funds, common stocks, U.S. Treasury and other U.S. government agency securities, and corporate and municipal bonds and notes. The rate of compensation increase is based on reviewing recent annual pension-eligible compensation increases as well as the expectation of future increases. Mortality rate assumptions are based on mortality tables published by third-parties such as the Society of Actuaries (SOA), considering other available information including historical data as well as studies and publications from reputable sources. The Corporation reviews its pension plan assumptions on an annual basis with its actuarial consultants to determine if the assumptions are reasonable and adjusts the assumptions to reflect changes in future expectations.
The assumptions used to calculate 2016 expense for the defined benefit pension plans were a discount rate of 4.82 percent, a long-term rate of return on plan assets of 6.75 percent and a rate of compensation increase of 3.75 percent. The Corporation adopted the RP-2006 mortality tables and the MP-2015 mortality improvement scales issued by the SOA in October 2015, with certain entity-specific adjustments. Defined benefit pension expense in 2016 is expected to decrease approximately 70 percent to about $14 million from the $47 million recorded in 2015, primarily driven by an increase in the discount rate.
Changing the 2016 key actuarial assumptions discussed above by 25 basis points would have the following impact on defined benefit pension expense in 2016:
|
| | | | | | | |
| | 25 Basis Point |
| (in millions) | Increase | | Decrease |
| Key Actuarial Assumption: | | | |
| Discount rate | $ | (8.8 | ) | | $ | 8.8 |
|
| Long-term rate of return | (2.6 | ) | | 2.6 |
|
| Rate of compensation increase | 6.0 |
| | (6.0 | ) |
Due to the long-term nature of pension plan assumptions, actual results may differ significantly from the actuarial-based estimates. Differences resulting in actuarial gains or losses are required to be recorded in shareholders' equity as part of accumulated other comprehensive loss and amortized to defined benefit pension expense in future years. In 2015, the actual return on plan assets in the qualified defined benefit pension plan was $73 million, compared to an expected return on plan assets of $159 million.
In 2014, the actual return on plan assets was $278 million, compared to an expected return on plan assets of $131 million. Total pretax losses recognized in accumulated other comprehensive loss at December 31, 2015 were $607 million for the qualified defined benefit pension plan and $57 million for the non-qualified defined benefit pension plan. Actuarial pretax net losses recognized in other comprehensive income (loss) for the year ended December 31, 2015 were $77 million for the qualified defined benefit pension plan and $16 million for the non-qualified defined benefit pension plan. For further information, refer to Note 1 to the consolidated financial statements.
Defined benefit pension expense is recorded in "employee benefits" expense on the consolidated statements of income and is allocated to business segments based on the segment's share of salaries expense. Accordingly, defined benefit pension expense was allocated approximately 44 percent, 27 percent, 23 percent and 6 percent to the Retail Bank, Business Bank, Wealth Management and Finance segments, respectively, in 2015.
INCOME TAXES
The calculation of the Corporation's income tax provision and tax-related accruals is complex and requires the use of estimates and judgments. The provision for income taxes is the sum of income taxes due for the current year and deferred taxes. Deferred taxes arise from temporary differences between the income tax basis and financial accounting basis of assets and liabilities. Accrued taxes represent the net estimated amount due to or to be received from taxing jurisdictions, currently or in the future, and are included in "accrued income and other assets" or "accrued expenses and other liabilities" on the consolidated balance sheets. The Corporation assesses the relative risks and merits of tax positions for various transactions after considering statutes, regulations, judicial precedent and other available information and maintains tax accruals consistent with these assessments. The Corporation is subject to audit by taxing authorities that could question and/or challenge the tax positions taken by the Corporation.
Included in net deferred taxes are deferred tax assets. Deferred tax assets are evaluated for realization based on available evidence of loss carryback capacity, projected future reversals of existing taxable temporary differences and assumptions made regarding future events. A valuation allowance is provided when it is more-likely-than-not that some portion of the deferred tax asset will not be realized.
Changes in the estimate of accrued taxes occur due to changes in tax law, interpretations of existing tax laws, new judicial or regulatory guidance, and the status of examinations conducted by taxing authorities that impact the relative risks and merits of tax positions taken by the Corporation. These changes, when they occur, impact the estimate of accrued taxes and could be significant to the operating results of the Corporation. For further information on tax accruals and related risks, see Note 18 to the consolidated financial statements.
SUPPLEMENTAL FINANCIAL DATA
The following table provides a reconciliation of non-GAAP financial measures used in this financial review with financial measures defined by GAAP.
|
| | | | | | | | | | | | | | | | | | | |
| (dollar amounts in millions) | | | | | | | | | |
| December 31 | 2015 | | 2014 | | 2013 | | 2012 | | 2011 |
| Tier 1 Common Capital Ratio: | | | | | | | | | |
| Tier 1 capital (a) | n/a |
| | $ | 7,169 |
| | $ | 6,895 |
| | $ | 6,705 |
| | $ | 6,582 |
|
| Less: | | | | | | | | | |
| Trust preferred securities | n/a |
| | — |
| | — |
| | — |
| | 25 |
|
| Tier 1 common capital | n/a |
| | $ | 7,169 |
| | $ | 6,895 |
| | $ | 6,705 |
| | $ | 6,557 |
|
| Risk-weighted assets (a) | n/a |
| | $ | 68,269 |
| | $ | 64,825 |
| | $ | 66,115 |
| | $ | 63,244 |
|
| Tier 1 risk-based capital ratio | n/a |
| | 10.50 | % | | 10.64 | % | | 10.14 | % | | 10.41 | % |
| Tier 1 common capital ratio | n/a |
| | 10.50 |
| | 10.64 |
| | 10.14 |
| | 10.37 |
|
| Tangible Common Equity Ratio: | | | | | | | | | |
| Total shareholder's equity | $ | 7,560 |
| | $ | 7,402 |
| | $ | 7,150 |
| | $ | 6,939 |
| | $ | 6,865 |
|
| Less: | | | | | | | | | |
| Goodwill | 635 |
| | 635 |
| | 635 |
| | 635 |
| | 635 |
|
| Other intangible assets | 14 |
| | 15 |
| | 17 |
| | 22 |
| | 32 |
|
| Tangible common equity | $ | 6,911 |
| | $ | 6,752 |
| | $ | 6,498 |
| | $ | 6,282 |
| | $ | 6,198 |
|
| Total assets | $ | 71,877 |
| | $ | 69,186 |
| | $ | 65,224 |
| | $ | 65,066 |
| | $ | 61,005 |
|
| Less: | | | | | | | | | |
| Goodwill | 635 |
| | 635 |
| | 635 |
| | 635 |
| | 635 |
|
| Other intangible assets | 14 |
| | 15 |
| | 17 |
| | 22 |
| | 32 |
|
| Tangible assets | $ | 71,228 |
| | $ | 68,536 |
| | $ | 64,572 |
| | $ | 64,409 |
| | $ | 60,338 |
|
| Common equity ratio | 10.52 | % | | 10.70 | % | | 10.97 | % | | 10.67 | % | | 11.26 | % |
| Tangible common equity ratio | 9.70 |
| | 9.85 |
| | 10.07 |
| | 9.76 |
| | 10.27 |
|
| Tangible Common Equity per Share of Common Stock: | | | | | | | | | |
| Common shareholders' equity | $ | 7,560 |
| | $ | 7,402 |
| | $ | 7,150 |
| | $ | 6,939 |
| | $ | 6,865 |
|
| Tangible common equity | 6,911 |
| | 6,752 |
| | 6,498 |
| | 6,282 |
| | 6,198 |
|
| Shares of common stock outstanding (in millions) | 176 |
| | 179 |
| | 182 |
| | 188 |
| | 197 |
|
| Common shareholders' equity per share of common stock | $ | 43.03 |
| | $ | 41.35 |
| | $ | 39.22 |
| | $ | 36.86 |
| | $ | 34.79 |
|
| Tangible common equity per share of common stock | 39.33 |
| | 37.72 |
| | 35.64 |
| | 33.36 |
| | 31.40 |
|
| |
| (a) | Tier 1 capital and risk-weighted assets as defined by regulation. |
n/a - not applicable.
The Tier 1 common capital ratio removes preferred stock and qualifying trust preferred securities from Tier 1 capital as defined by and calculated in conformity with Basel I risk-based capital rules in effect through December 31, 2014. Effective January 1, 2015, regulatory capital components and risk-weighted assets are defined by and calculated in conformity with Basel III risk-based capital rules. The tangible common equity ratio removes preferred stock and the effect of intangible assets from capital and the effect of intangible assets from total assets and tangible common equity per share of common stock removes the effect of intangible assets from common shareholders' equity per share of common stock. The Corporation believes these measurements are meaningful measures of capital adequacy used by investors, regulators, management and others to evaluate the adequacy of common equity and to compare against other companies in the industry.
FORWARD-LOOKING STATEMENTS
This report includes forward-looking statements as defined in the Private Securities Litigation Reform Act of 1995. In addition, the Corporation may make other written and oral communications from time to time that contain such statements. All statements regarding the Corporation's expected financial position, strategies and growth prospects and general economic conditions expected to exist in the future are forward-looking statements. The words, "anticipates," "believes," "contemplates," "feels," "expects," "estimates," "seeks," "strives," "plans," "intends," "outlook," "forecast," "position," "target," "mission," "assume," "achievable," "potential," "strategy," "goal," "aspiration," "opportunity," "initiative," "outcome," "continue," "remain," "maintain," "on course," "trend," "objective," "looks forward," "projects," "models" and variations of such words and similar expressions, or future or conditional verbs such as "will," "would," "should," "could," "might," "can," "may" or similar expressions, as they relate to the Corporation or its management, are intended to identify forward-looking statements. The Corporation cautions that forward-looking statements are subject to numerous assumptions, risks and uncertainties, which change over time. Forward-looking statements speak only as of the date the statement is made, and the Corporation does not undertake to update forward-looking statements to reflect facts, circumstances, assumptions or events that occur after the date the forward-looking statements are made. Actual results could differ materially from those anticipated in forward-looking statements and future results could differ materially from historical performance.
In addition to factors mentioned elsewhere in this report or previously disclosed in the Corporation's SEC reports (accessible on the SEC's website at www.sec.gov or on the Corporation's website at www.comerica.com), actual results could differ materially from forward-looking statements and future results could differ materially from historical performance due to a variety of reasons, including but not limited to, the following factors:
| |
| • | general political, economic or industry conditions, either domestically or internationally, may be less favorable than expected; |
| |
| • | governmental monetary and fiscal policies may adversely affect the financial services industry, and therefore impact the Corporation's financial condition and results of operations; |
| |
| • | changes in regulation or oversight may have a material adverse impact on the Corporation's operations; |
| |
| • | the Corporation must maintain adequate sources of funding and liquidity to meet regulatory expectations, support its operations and fund outstanding liabilities; |
| |
| • | compliance with more stringent capital and liquidity requirements may adversely affect the Corporation; |
| |
| • | declines in the businesses or industries of the Corporation's customers - in particular, the energy industry - could cause increased credit losses or decreased loan balances, which could adversely affect the Corporation; |
| |
| • | unfavorable developments concerning credit quality could adversely affect the Corporation's financial results: |
| |
| • | operational difficulties, failure of technology infrastructure or information security incidents could adversely affect the Corporation's business and operations; |
| |
| • | the Corporation relies on other companies to provide certain key components of its business infrastructure, and certain failures could materially adversely affect operations; |
| |
| • | noninterest expenses are important to the Corporation's profitability, but are subject to a number of factors, some of which are not in the Corporation's control; |
| |
| • | changes in the financial markets, including fluctuations in interest rates and their impact on deposit pricing, could adversely affect the Corporation's net interest income and balance sheet; |
| |
| • | reduction in the Corporation's credit ratings could adversely affect the Corporation and/or the holders of its securities; |
| |
| • | the soundness of other financial institutions could adversely affect the Corporation; |
| |
| • | the introduction, implementation, withdrawal, success and timing of business initiatives and strategies may be less successful or may be different than anticipated, which could adversely affect the Corporation's business; |
| |
| • | damage to Comerica's reputation could damage its businesses; |
| |
| • | the Corporation may not be able to utilize technology to efficiently and effectively develop, market and deliver new products and services to its customers; |
| |
| • | competitive product and pricing pressures among financial institutions within the Corporation's markets may change; |
| |
| • | changes in customer behavior may adversely impact the Corporation's business, financial condition and results of operations; |
| |
| • | any future strategic acquisitions or divestitures may present certain risks to the Corporation's business and operations; |
| |
| • | management's ability to maintain and expand customer relationships may differ from expectations; |
| |
| • | management's ability to retain key officers and employees may change; |
| |
| • | legal and regulatory proceedings and related financial services industry matters, including those directly involving the Corporation and its subsidiaries, could adversely affect the Corporation or the financial services industry in general; |
| |
| • | methods of reducing risk exposures might not be effective; |
| |
| • | adverse effects from terrorist activities or other hostilities; |
| |
| • | catastrophic events, including, but not limited to, hurricanes, tornadoes, earthquakes, fires, droughts and floods, may adversely affect the general economy, financial and capital markets, specific industries, and the Corporation; |
| |
| • | changes in accounting standards could materially impact the Corporation's financial statements; and |
| |
| • | the Corporation's accounting policies and processes are critical to the reporting of financial condition and results of operations. They require management to make estimates about matters that are uncertain. |
CONSOLIDATED BALANCE SHEETS
Comerica Incorporated and Subsidiaries
|
| | | | | | | |
| (in millions, except share data) | | | |
| December 31 | 2015 | | 2014 |
| | | | |
| ASSETS | | | |
| Cash and due from banks | $ | 1,157 |
| | $ | 1,026 |
|
| | | | |
| Interest-bearing deposits with banks | 4,990 |
| | 5,045 |
|
| Other short-term investments | 113 |
| | 99 |
|
| | | | |
| Investment securities available-for-sale | 10,519 |
| | 8,116 |
|
| Investment securities held-to-maturity | 1,981 |
| | 1,935 |
|
| | | | |
| Commercial loans | 31,659 |
| | 31,520 |
|
| Real estate construction loans | 2,001 |
| | 1,955 |
|
| Commercial mortgage loans | 8,977 |
| | 8,604 |
|
| Lease financing | 724 |
| | 805 |
|
| International loans | 1,368 |
| | 1,496 |
|
| Residential mortgage loans | 1,870 |
| | 1,831 |
|
| Consumer loans | 2,485 |
| | 2,382 |
|
| Total loans | 49,084 |
| | 48,593 |
|
| Less allowance for loan losses | (634 | ) | | (594 | ) |
| Net loans | 48,450 |
| | 47,999 |
|
| Premises and equipment | 550 |
| | 532 |
|
| Accrued income and other assets | 4,117 |
| | 4,434 |
|
| Total assets | $ | 71,877 |
| | $ | 69,186 |
|
| | | | |
| LIABILITIES AND SHAREHOLDERS' EQUITY | | | |
| Noninterest-bearing deposits | $ | 30,839 |
| | $ | 27,224 |
|
| | | | |
| Money market and interest-bearing checking deposits | 23,532 |
| | 23,954 |
|
| Savings deposits | 1,898 |
| | 1,752 |
|
| Customer certificates of deposit | 3,552 |
| | 4,421 |
|
| Foreign office time deposits | 32 |
| | 135 |
|
| Total interest-bearing deposits | 29,014 |
| | 30,262 |
|
| Total deposits | 59,853 |
| | 57,486 |
|
| Short-term borrowings | 23 |
| | 116 |
|
| Accrued expenses and other liabilities | 1,383 |
| | 1,507 |
|
| Medium- and long-term debt | 3,058 |
| | 2,675 |
|
| Total liabilities | 64,317 |
| | 61,784 |
|
| | | | |
| Common stock - $5 par value: | | | |
| Authorized - 325,000,000 shares | | | |
| Issued - 228,164,824 shares | 1,141 |
| | 1,141 |
|
| Capital surplus | 2,173 |
| | 2,188 |
|
| Accumulated other comprehensive loss | (429 | ) | | (412 | ) |
| Retained earnings | 7,084 |
| | 6,744 |
|
| Less cost of common stock in treasury - 52,457,113 shares at 12/31/15 and 49,146,225 shares at 12/31/14 | (2,409 | ) | | (2,259 | ) |
| Total shareholders' equity | 7,560 |
| | 7,402 |
|
| Total liabilities and shareholders' equity | $ | 71,877 |
| | $ | 69,186 |
|
See notes to consolidated financial statements.
CONSOLIDATED STATEMENTS OF INCOME
Comerica Incorporated and Subsidiaries
|
| | | | | | | | | | | |
| (in millions) | | | | | |
| Years Ended December 31 | 2015 | | 2014 | | 2013 |
| INTEREST INCOME | | | | | |
| Interest and fees on loans | $ | 1,551 |
| | $ | 1,525 |
| | $ | 1,556 |
|
| Interest on investment securities | 216 |
| | 211 |
| | 214 |
|
| Interest on short-term investments | 17 |
| | 14 |
| | 14 |
|
| Total interest income | 1,784 |
| | 1,750 |
| | 1,784 |
|
| INTEREST EXPENSE | | | | | |
| Interest on deposits | 43 |
| | 45 |
| | 55 |
|
| Interest on medium- and long-term debt | 52 |
| | 50 |
| | 57 |
|
| Total interest expense | 95 |
| | 95 |
| | 112 |
|
| Net interest income | 1,689 |
| | 1,655 |
| | 1,672 |
|
| Provision for credit losses | 147 |
| | 27 |
| | 46 |
|
| Net interest income after provision for credit losses | 1,542 |
| | 1,628 |
| | 1,626 |
|
| NONINTEREST INCOME | | | | | |
| Card fees | 290 |
| | 92 |
| | 86 |
|
| Service charges on deposit accounts | 223 |
| | 215 |
| | 214 |
|
| Fiduciary income | 187 |
| | 180 |
| | 171 |
|
| Commercial lending fees | 99 |
| | 98 |
| | 99 |
|
| Letter of credit fees | 53 |
| | 57 |
| | 64 |
|
| Bank-owned life insurance | 40 |
| | 39 |
| | 40 |
|
| Foreign exchange income | 40 |
| | 40 |
| | 36 |
|
| Brokerage fees | 17 |
| | 17 |
| | 17 |
|
| Net securities losses | (2 | ) | | — |
| | (1 | ) |
| Other noninterest income | 103 |
| | 130 |
| | 156 |
|
| Total noninterest income | 1,050 |
| | 868 |
| | 882 |
|
| NONINTEREST EXPENSES | | | | | |
| Salaries and benefits expense | 1,009 |
| | 980 |
| | 1,009 |
|
| Outside processing fee expense | 332 |
| | 122 |
| | 119 |
|
| Net occupancy expense | 159 |
| | 171 |
| | 160 |
|
| Equipment expense | 53 |
| | 57 |
| | 60 |
|
| Software expense | 99 |
| | 95 |
| | 90 |
|
| FDIC insurance expense | 37 |
| | 33 |
| | 33 |
|
| Advertising expense | 24 |
| | 23 |
| | 21 |
|
| Litigation-related expense | (32 | ) | | 4 |
| | 52 |
|
| Gain on debt redemption | — |
| | (32 | ) | | (1 | ) |
| Other noninterest expenses | 161 |
| | 173 |
| | 179 |
|
| Total noninterest expenses | 1,842 |
| | 1,626 |
| | 1,722 |
|
| Income before income taxes | 750 |
| | 870 |
| | 786 |
|
| Provision for income taxes | 229 |
| | 277 |
| | 245 |
|
| NET INCOME | 521 |
| | 593 |
| | 541 |
|
| Less income allocated to participating securities | 6 |
| | 7 |
| | 8 |
|
| Net income attributable to common shares | $ | 515 |
| | $ | 586 |
| | $ | 533 |
|
| Earnings per common share: | | | | | |
| Basic | $ | 2.93 |
| | $ | 3.28 |
| | $ | 2.92 |
|
| Diluted | 2.84 |
| | 3.16 |
| | 2.85 |
|
| | | | | | |
| Cash dividends declared on common stock | 148 |
| | 143 |
| | 126 |
|
| Cash dividends declared per common share | 0.83 |
| | 0.79 |
| | 0.68 |
|
See notes to consolidated financial statements.
CONSOLIDATED STATEMENTS OF COMPREHENSIVE INCOME
Comerica Incorporated and Subsidiaries
|
| | | | | | | | | | | |
| (in millions) | | | | | |
| Years Ended December 31 | 2015 | | 2014 | | 2013 |
| | | | | | |
| NET INCOME | $ | 521 |
| | $ | 593 |
| | $ | 541 |
|
| | | | | | |
| OTHER COMPREHENSIVE INCOME (LOSS) | | | | | |
| | | | | | |
| Unrealized (losses) gains on investment securities: | | | | | |
| Net unrealized holding (losses) gains arising during the period | (55 | ) | | 166 |
| | (343 | ) |
| Less: | | | | | |
| Reclassification adjustment for net securities (losses) gains included in net income | (2 | ) | | 1 |
| | 1 |
|
| Net losses realized as a yield adjustment in interest on investment securities | (8 | ) | | — |
| | — |
|
| Change in net unrealized (losses) gains before income taxes | (45 | ) | | 165 |
| | (344 | ) |
| | | | | | |
| Defined benefit pension and other postretirement plans adjustment: | | | | | |
| Actuarial (loss) gain arising during the period | (57 | ) | | (240 | ) | | 286 |
|
| Prior service credit arising during the period | 3 |
| | — |
| | — |
|
| Adjustments for amounts recognized as components of net periodic benefit cost: | | | | | |
| Amortization of actuarial net loss | 70 |
| | 39 |
| | 89 |
|
| Amortization of prior service cost | 1 |
| | 3 |
| | 2 |
|
| Change in defined benefit pension and other postretirement plans adjustment before income taxes | 17 |
| | (198 | ) | | 377 |
|
| | | | | | |
| Total other comprehensive (loss) income before income taxes | (28 | ) | | (33 | ) | | 33 |
|
| (Benefit) provision for income taxes | (11 | ) | | (12 | ) | | 11 |
|
| Total other comprehensive (loss) income, net of tax | (17 | ) | | (21 | ) | | 22 |
|
| | | | | | |
| COMPREHENSIVE INCOME | $ | 504 |
| | $ | 572 |
| | $ | 563 |
|
See notes to consolidated financial statements.
CONSOLIDATED STATEMENTS OF CHANGES IN SHAREHOLDERS' EQUITY
Comerica Incorporated and Subsidiaries
|
| | | | | | | | | | | | | | | | | | | | | | | | | | |
| | Common Stock | | | | Accumulated Other Comprehensive Loss | | | | | | Total Shareholders' Equity |
| (in millions, except per share data) | Shares Outstanding | | Amount | | Capital Surplus | | | Retained Earnings | | Treasury Stock | |
| BALANCE AT DECEMBER 31, 2012 | 188.3 |
| | $ | 1,141 |
| | $ | 2,162 |
| | $ | (413 | ) | | $ | 5,928 |
| | $ | (1,879 | ) | | $ | 6,939 |
|
| Net income | — |
| | — |
| | — |
| | — |
| | 541 |
| | — |
| | 541 |
|
| Other comprehensive income, net of tax | — |
| | — |
| | — |
| | 22 |
| | — |
| | — |
| | 22 |
|
| Cash dividends declared on common stock ($0.68 per share) | — |
| | — |
| | — |
| | — |
| | (126 | ) | | — |
| | (126 | ) |
| Purchase of common stock | (7.5 | ) | | — |
| | — |
| | — |
| | — |
| | (291 | ) | | (291 | ) |
| Net issuance of common stock under employee stock plans | 1.5 |
| | — |
| | (17 | ) | | — |
| | (25 | ) | | 72 |
| | 30 |
|
| Share-based compensation | — |
| | — |
| | 35 |
| | — |
| | — |
| | — |
| | 35 |
|
| Other | — |
| | — |
| | (1 | ) | | — |
| | — |
| | 1 |
| | — |
|
| BALANCE AT DECEMBER 31, 2013 | 182.3 |
| | 1,141 |
| | 2,179 |
| | (391 | ) | | 6,318 |
| | (2,097 | ) | | 7,150 |
|
| Net income | — |
| | — |
| | — |
| | — |
| | 593 |
| | — |
| | 593 |
|
| Other comprehensive loss, net of tax | — |
| | — |
| | — |
| | (21 | ) | | — |
| | — |
| | (21 | ) |
| Cash dividends declared on common stock ($0.79 per share) | — |
| | — |
| | — |
| | — |
| | (143 | ) | | — |
| | (143 | ) |
| Purchase of common stock | (5.4 | ) | | — |
| | — |
| | — |
| | — |
| | (260 | ) | | (260 | ) |
| Net issuance of common stock under employee stock plans | 2.1 |
| | — |
| | (27 | ) | | — |
| | (24 | ) | | 96 |
| | 45 |
|
| Share-based compensation | — |
| | — |
| | 38 |
| | — |
| | — |
| | — |
| | 38 |
|
| Other | — |
| | — |
| | (2 | ) | | — |
| | — |
| | 2 |
| | — |
|
| BALANCE AT DECEMBER 31, 2014 | 179.0 |
| | 1,141 |
| | 2,188 |
| | (412 | ) | | 6,744 |
| | (2,259 | ) | | 7,402 |
|
| Net income | — |
| | — |
| | — |
| | — |
| | 521 |
| | — |
| | 521 |
|
| Other comprehensive loss, net of tax | — |
| | — |
| | — |
| | (17 | ) | | — |
| | — |
| | (17 | ) |
| Cash dividends declared on common stock ($0.83 per share) | — |
| | — |
| | — |
| | — |
| | (148 | ) | | — |
| | (148 | ) |
| Purchase of common stock | (5.3 | ) | | — |
| | — |
| | — |
| | — |
| | (240 | ) | | (240 | ) |
| Purchase and retirement of warrants | — |
| | — |
| | (10 | ) | | — |
| | — |
| | — |
| | (10 | ) |
| Net issuance of common stock under employee stock plans | 1.0 |
| | — |
| | (22 | ) | | — |
| | (11 | ) | | 47 |
| | 14 |
|
| Net issuance of common stock for warrants | 1.0 |
| | — |
| | (21 | ) | | — |
| | (22 | ) | | 43 |
| | — |
|
| Share-based compensation | — |
| | — |
| | 38 |
| | — |
| | — |
| | — |
| | 38 |
|
| BALANCE AT DECEMBER 31, 2015 | 175.7 |
| | $ | 1,141 |
| | $ | 2,173 |
| | $ | (429 | ) | | $ | 7,084 |
| | $ | (2,409 | ) | | $ | 7,560 |
|
See notes to consolidated financial statements.
CONSOLIDATED STATEMENTS OF CASH FLOWS
Comerica Incorporated and Subsidiaries
|
| | | | | | | | | | | |
| (in millions) | | | | | |
| Years Ended December 31 | 2015 | | 2014 | | 2013 |
| OPERATING ACTIVITIES | | | | | |
| Net income | $ | 521 |
| | $ | 593 |
| | $ | 541 |
|
| Adjustments to reconcile net income to net cash provided by operating activities: | | | | | |
| Provision for credit losses | 147 |
| | 27 |
| | 46 |
|
| (Benefit) provision for deferred income taxes | (71 | ) | | 130 |
| | (20 | ) |
| Depreciation and amortization | 118 |
| | 123 |
| | 122 |
|
| Net periodic defined benefit cost | 48 |
| | 40 |
| | 88 |
|
| Share-based compensation expense | 38 |
| | 38 |
| | 35 |
|
| Net amortization of securities | 13 |
| | 13 |
| | 23 |
|
| Accretion of loan purchase discount | (7 | ) | | (34 | ) | | (49 | ) |
| Net securities losses | 2 |
| | — |
| | 1 |
|
| Net (gain) loss/writedown on foreclosed property | (2 | ) | | (4 | ) | | 4 |
|
| Gain on debt redemption | — |
| | (32 | ) | | (1 | ) |
| Excess tax benefits from share-based compensation arrangements | (3 | ) | | (7 | ) | | (3 | ) |
| Net change in: | | | | | |
| Trading securities | — |
| | 13 |
| | 6 |
|
| Accrued income receivable | (12 | ) | | (4 | ) | | 7 |
|
| Accrued expenses payable | (35 | ) | | (14 | ) | | 38 |
|
| Other, net | 105 |
| | (243 | ) | | (2 | ) |
| Net cash provided by operating activities | 862 |
| | 639 |
| | 836 |
|
| INVESTING ACTIVITIES | | | | | |
| Investment securities available-for-sale: | | | | | |
| Maturities and redemptions | 1,703 |
| | 1,781 |
| | 2,849 |
|
| Sales | 54 |
| | — |
| | — |
|
| Purchases | (4,228 | ) | | (2,372 | ) | | (2,225 | ) |
| Investment securities held-to-maturity: | | | | | |
| Maturities and redemptions | 324 |
| | — |
| | — |
|
| Purchases | (362 | ) | | — |
| | — |
|
| Net change in loans | (644 | ) | | (3,144 | ) | | 549 |
|
| Sales of Federal Home Loan Bank stock | — |
| | 41 |
| | 41 |
|
| Proceeds from sales of foreclosed property | 12 |
| | 20 |
| | 55 |
|
| Net increase in premises and equipment | (119 | ) | | (70 | ) | | (102 | ) |
| Other, net | 5 |
| | 1 |
| | 7 |
|
| Net cash (used in) provided by investing activities | (3,255 | ) | | (3,743 | ) | | 1,174 |
|
| FINANCING ACTIVITIES | | | | | |
| Net change in: | | | | | |
| Deposits | 2,529 |
| | 4,013 |
| | 1,229 |
|
| Short-term borrowings | (93 | ) | | (137 | ) | | 143 |
|
| Medium- and long-term debt: | | | | | |
| Maturities and redemptions | (606 | ) | | (1,406 | ) | | (1,080 | ) |
| Issuances | 1,016 |
| | 596 |
| | — |
|
| Common stock: | | | | | |
| Repurchases | (240 | ) | | (260 | ) | | (291 | ) |
| Cash dividends paid | (147 | ) | | (137 | ) | | (123 | ) |
| Issuances under employee stock plans | 22 |
| | 49 |
| | 33 |
|
| Purchase and retirement of warrants | (10 | ) | | — |
| | — |
|
| Excess tax benefits from share-based compensation arrangements | 3 |
| | 7 |
| | 3 |
|
| Other, net | (5 | ) | | (1 | ) | | (7 | ) |
| Net cash provided by (used in) financing activities | 2,469 |
| | 2,724 |
| | (93 | ) |
| Net increase (decrease) in cash and cash equivalents | 76 |
| | (380 | ) | | 1,917 |
|
| Cash and cash equivalents at beginning of period | 6,071 |
| | 6,451 |
| | 4,534 |
|
| Cash and cash equivalents at end of period | $ | 6,147 |
| | $ | 6,071 |
| | $ | 6,451 |
|
| Interest paid | $ | 94 |
| | $ | 101 |
| | $ | 114 |
|
| Income taxes paid | 88 |
| | 218 |
| | 115 |
|
| Noncash investing and financing activities: | | | | | |
| Loans transferred to other real estate | 12 |
| | 16 |
| | 14 |
|
| Loans transferred from portfolio to held-for-sale | 28 |
| | — |
| | — |
|
| Lease residual transferred to other assets | 16 |
| | — |
| | — |
|
| Securities transferred from available-for-sale to held-to-maturity | — |
| | 1,958 |
| | — |
|
See notes to consolidated financial statements.
NOTES TO CONSOLIDATED FINANCIAL STATEMENTS
Comerica Incorporated and Subsidiaries
NOTE 1 - BASIS OF PRESENTATION AND ACCOUNTING POLICIES
Organization
Comerica Incorporated (the Corporation) is a registered financial holding company headquartered in Dallas, Texas. The Corporation's major business segments are the Business Bank, the Retail Bank and Wealth Management. The Corporation operates in three primary geographic markets: Michigan, California and Texas. For further discussion of each business segment and primary geographic market, refer to Note 22. The Corporation and its banking subsidiaries are regulated at both the state and federal levels.
The accounting and reporting policies of the Corporation conform to United States (U.S.) generally accepted accounting principles (GAAP). The preparation of financial statements in conformity with GAAP requires management to make estimates and assumptions that affect reported amounts and disclosures. Actual results could differ from these estimates. Certain items in prior periods were reclassified to conform to the current presentation.
The following summarizes the significant accounting policies of the Corporation applied in the preparation of the accompanying consolidated financial statements.
Principles of Consolidation
The consolidated financial statements include the accounts of the Corporation and the accounts of those subsidiaries that are majority owned and in which the Corporation has a controlling financial interest. The Corporation consolidates entities not determined to be variable interest entities (VIEs) when it holds a controlling financial interest in the entity's outstanding voting stock and uses the cost or equity method when it holds less than a controlling financial interest. In consolidation, all significant intercompany accounts and transactions are eliminated. The results of operations of companies acquired are included from the date of acquisition. Certain amounts in the financial statements for prior years have been reclassified to conform to current financial statement presentation.
The Corporation holds investments in certain legal entities that are considered VIEs. In general, a VIE is an entity that either (1) has an insufficient amount of equity to carry out its principal activities without additional subordinated financial support, (2) has a group of equity owners that are unable to make significant decisions about its activities, or (3) has a group of equity owners that do not have the obligation to absorb losses or the right to receive returns generated by its operations. If any of these characteristics are present, the entity is subject to a variable interests consolidation model, and consolidation is based on variable interests, not on ownership of the entity's outstanding voting stock. Variable interests are defined as contractual ownership or other money interests in an entity that change with fluctuations in the entity's net asset value. The primary beneficiary is required to consolidate the VIE. The primary beneficiary is defined as the party that has both the power to direct the activities of the VIE that most significantly impact the entity's economic performance and the obligation to absorb losses or the right to receive benefits that could be significant to the VIE. The maximum potential exposure to losses relative to investments in VIEs is generally limited to the sum of the outstanding book basis and unfunded commitments for future investments.
The Corporation evaluates its investments in VIEs, both at inception and when there is a change in circumstances that requires reconsideration, to determine if the Corporation is the primary beneficiary and consolidation is required. The Corporation accounts for unconsolidated VIEs using either the proportional, cost or equity method. These investments comprise investments in community development projects which generate tax credits to their investors and are included in "accrued income and other assets" on the consolidated balance sheets.
The proportional method is used for investments in affordable housing projects that qualify for the low-income housing tax credit (LIHTC). The equity method is used for other investments where the Corporation has the ability to exercise significant influence over the entity's operation and financial policies, which is generally presumed to exist if the Corporation owns more than a 20 percent voting interest in the entity. Other unconsolidated equity investments that do not meet the criteria to be accounted for under the equity method are accounted for under the cost method. Amortization and other write-downs of LIHTC investments are presented on a net basis as a component of the "provision for income taxes," while income, amortization and write-downs from cost and equity method investments are recorded in "other noninterest income" on the consolidated statements of income.
Assets held in an agency or fiduciary capacity are not assets of the Corporation and are not included in the consolidated financial statements.
See Note 9 for additional information about the Corporation's involvement with VIEs.
NOTES TO CONSOLIDATED FINANCIAL STATEMENTS
Comerica Incorporated and Subsidiaries
Fair Value Measurements
The Corporation utilizes fair value measurements to record fair value adjustments to certain assets and liabilities and to determine fair value disclosures. The determination of fair values of financial instruments often requires the use of estimates. In cases where quoted market values in an active market are not available, the Corporation uses present value techniques and other valuation methods to estimate the fair values of its financial instruments. These valuation methods require considerable judgment and the resulting estimates of fair value can be significantly affected by the assumptions made and methods used.
Fair value is an estimate of the exchange price that would be received to sell an asset or paid to transfer a liability in an orderly transaction (i.e., not a forced transaction, such as a liquidation or distressed sale) between market participants at the measurement date. Fair value is based on the assumptions market participants would use when pricing an asset or liability.
Trading securities, investment securities available-for-sale, derivatives and deferred compensation plan liabilities are recorded at fair value on a recurring basis. Additionally, from time to time, the Corporation may be required to record other assets and liabilities at fair value on a nonrecurring basis, such as impaired loans, other real estate (primarily foreclosed property), nonmarketable equity securities and certain other assets and liabilities. These nonrecurring fair value adjustments typically involve write-downs of individual assets or application of lower of cost or fair value accounting.
Fair value measurements and disclosures guidance establishes a three-level fair value hierarchy based on the markets in which the assets and liabilities are traded and the reliability of the assumptions used to determine fair value. The fair value hierarchy gives the highest priority to quoted prices in active markets and the lowest priority to unobservable data. Fair value measurements are separately disclosed by level within the fair value hierarchy. For assets and liabilities recorded at fair value, it is the Corporation's policy to maximize the use of observable inputs and minimize the use of unobservable inputs when developing fair value measurements.
|
| | | |
| | Level 1 | | Valuation is based upon quoted prices for identical instruments traded in active markets. |
| | | | |
| | Level 2 | | Valuation is based upon quoted prices for similar instruments in active markets, quoted prices for identical or similar instruments in markets that are not active, and model-based valuation techniques for which all significant assumptions are observable in the market. |
| | | | |
| | Level 3 | | Valuation is generated from model-based techniques that use at least one significant assumption not observable in the market. These unobservable assumptions reflect estimates of assumptions that market participants would use in pricing the asset or liability. Valuation techniques include use of option pricing models, discounted cash flow models and similar techniques. |
The Corporation generally utilizes third-party pricing services to value Level 1 and Level 2 trading and investment securities, as well as certain derivatives designated as fair value hedges. Management reviews the methodologies and assumptions used by the third-party pricing services and evaluates the values provided, principally by comparison with other available market quotes for similar instruments and/or analysis based on internal models using available third-party market data. The Corporation may occasionally adjust certain values provided by the third-party pricing service when management believes, as the result of its review, that the adjusted price most appropriately reflects the fair value of the particular security.
Fair value measurements for assets and liabilities where limited or no observable market data exists are based primarily upon estimates, often calculated based on the economic and competitive environment, the characteristics of the asset or liability and other factors. Therefore, the results cannot be determined with precision and may not be realized in an actual sale or immediate settlement of the asset or liability. Additionally, there may be inherent weaknesses in any calculation technique, and changes in the underlying assumptions used, including discount rates and estimates of future cash flows, could significantly affect the results of current or future values.
Following are descriptions of the valuation methodologies and key inputs used to measure financial assets and liabilities recorded at fair value, as well as a description of the methods and significant assumptions used to estimate fair value disclosures for financial instruments not recorded at fair value in their entirety on a recurring basis. The descriptions include an indication of the level of the fair value hierarchy in which the assets or liabilities are classified. Transfers of assets or liabilities between levels of the fair value hierarchy are recognized at the beginning of the reporting period, when applicable.
Cash and due from banks, federal funds sold and interest-bearing deposits with banks
Due to their short-term nature, the carrying amount of these instruments approximates the estimated fair value. As such, the Corporation classifies the estimated fair value of these instruments as Level 1.
NOTES TO CONSOLIDATED FINANCIAL STATEMENTS
Comerica Incorporated and Subsidiaries
Trading securities and associated deferred compensation plan liabilities
Trading securities include securities held for trading purposes as well as assets held related to employee deferred compensation plans. Trading securities and associated deferred compensation plan liabilities are recorded at fair value on a recurring basis and included in "other short-term investments" and "accrued expenses and other liabilities," respectively, on the consolidated balance sheets. Level 1 trading securities include assets related to employee deferred compensation plans, which are invested in mutual funds, U.S. Treasury securities that are traded by dealers or brokers in active over-the-counter markets and other securities traded on an active exchange, such as the New York Stock Exchange. Deferred compensation plan liabilities represent the fair value of the obligation to the employee, which corresponds to the fair value of the invested assets. Level 2 trading securities include municipal bonds and residential mortgage-backed securities issued by U.S. government-sponsored entities and corporate debt securities. The methods used to value trading securities are the same as the methods used to value investment securities, discussed below.
Investment securities
Investment securities available-for-sale are recorded at fair value on a recurring basis. The Corporation discloses estimated fair values of investment securities held-to-maturity, which is determined in the same manner as investment securities available-for-sale. Level 1 securities include those traded on an active exchange, such as the New York Stock Exchange, U.S. Treasury securities that are traded by dealers or brokers in active over-the-counter markets and money market funds. Level 2 securities include residential mortgage-backed securities issued by U.S. government agencies and U.S. government-sponsored entities and corporate debt securities. The fair value of Level 2 securities is determined using quoted prices of securities with similar characteristics, or pricing models based on observable market data inputs, primarily interest rates, spreads and prepayment information.
Securities classified as Level 3 represent securities in less liquid markets requiring significant management assumptions when determining fair value. Auction-rate securities comprise Level 3 investment securities available-for-sale. The Corporate Development Department, with appropriate oversight and approval provided by senior management, is responsible for determining the valuation methodology for auction-rate securities and for updating significant inputs. Valuation results, including an analysis of changes to the valuation methodology and significant inputs, are provided to senior management for review on a quarterly basis.
Loans held-for-sale
Loans held-for-sale, included in "other short-term investments" on the consolidated balance sheets, are recorded at the lower of cost or fair value. Loans held-for-sale may be carried at fair value on a nonrecurring basis when fair value is less than cost. The fair value is based on what secondary markets are currently offering for portfolios with similar characteristics. As such, the Corporation classifies both loans held-for-sale subjected to nonrecurring fair value adjustments and the estimated fair value of loans held-for sale as Level 2.
Loans
The Corporation does not record loans at fair value on a recurring basis. However, the Corporation may establish a specific allowance for an impaired loan based on the fair value of the underlying collateral. Such loan values are reported as nonrecurring fair value measurements. Collateral values supporting individually evaluated impaired loans are evaluated quarterly. When management determines that the fair value of the collateral requires additional adjustments, either as a result of non-current appraisal value or when there is no observable market price, the Corporation classifies the impaired loan as Level 3. The Special Assets Group is responsible for performing quarterly credit quality reviews for all impaired loans as part of the quarterly allowance for loan losses process overseen by the Chief Credit Officer, during which valuation adjustments to updated collateral values are determined.
The Corporation discloses fair value estimates for loans. The estimated fair value is determined based on characteristics such as loan category, repricing features and remaining maturity, and includes prepayment and credit loss estimates. For variable rate business loans that reprice frequently, the estimated fair value is based on carrying values adjusted for estimated credit losses inherent in the portfolio at the balance sheet date. For other business loans and retail loans, fair values are estimated using a discounted cash flow model that employs a discount rate that reflects the Corporation's current pricing for loans with similar characteristics and remaining maturity, adjusted by an amount for estimated credit losses inherent in the portfolio at the balance sheet date. The rates take into account the expected yield curve, as well as an adjustment for prepayment risk, when applicable. The Corporation classifies the estimated fair value of loans held for investment as Level 3.
Customers' liability on acceptances outstanding and acceptances outstanding
Customers' liability on acceptances outstanding is included in "accrued income and other assets" and acceptances outstanding are included in "accrued expenses and other liabilities" on the consolidated balance sheets. Due to their short-term nature,
NOTES TO CONSOLIDATED FINANCIAL STATEMENTS
Comerica Incorporated and Subsidiaries
the carrying amount of these instruments approximates the estimated fair value. As such, the Corporation classifies the estimated fair value of these instruments as Level 1.
Derivative assets and derivative liabilities
Derivative instruments held or issued for risk management or customer-initiated activities are traded in over-the-counter markets where quoted market prices are not readily available. Fair value for over-the-counter derivative instruments is measured on a recurring basis using internally developed models that use primarily market observable inputs, such as yield curves and option volatilities. The Corporation manages credit risk on its derivative positions based on whether the derivatives are being settled through a clearinghouse or bilaterally with each counterparty. For derivative positions settled on a counterparty-by-counterparty basis, the Corporation calculates credit valuation adjustments, included in the fair value of these instruments, on the basis of its relationships at the counterparty portfolio/master netting agreement level. These credit valuation adjustments are determined by applying a credit spread for the counterparty or the Corporation, as appropriate, to the total expected exposure of the derivative after considering collateral and other master netting arrangements. These adjustments, which are considered Level 3 inputs, are based on estimates of current credit spreads to evaluate the likelihood of default. When credit valuation adjustments are significant to the overall fair value of a derivative, the Corporation classifies the over-the-counter derivative valuation in Level 3 of the fair value hierarchy; otherwise, over-the-counter derivative valuations are classified in Level 2.
Warrants which contain a net exercise provision or a non-contingent put right embedded in the warrant agreement are accounted for as derivatives and recorded at fair value on a recurring basis using a Black-Scholes valuation model. The Black-Scholes valuation model utilizes five inputs: risk-free rate, expected life, volatility, exercise price, and the per share market value of the underlying company. The Corporation holds a portfolio of warrants for generally nonmarketable equity securities with a fair value of $2 million at December 31, 2015, included in "accrued income and other assets" on the consolidated balance sheets. These warrants are primarily from non-public technology companies obtained as part of the loan origination process. The Corporate Development Department is responsible for the warrant valuation process, which includes reviewing all significant inputs for reasonableness, and for providing valuation results to senior management. Increases in any of these inputs in isolation, with the exception of exercise price, would result in a higher fair value. Increases in exercise price in isolation would result in a lower fair value. The Corporation classifies warrants accounted for as derivatives as Level 3.
Nonmarketable equity securities
The Corporation has a portfolio of indirect (through funds) private equity and venture capital investments with a carrying value and unfunded commitments of $10 million and $4 million, respectively, at December 31, 2015. These funds generally cannot be redeemed and the majority is not readily marketable. Distributions from these funds are received by the Corporation as a result of the liquidation of underlying investments of the funds and/or as income distributions. It is estimated that the underlying assets of the funds will be liquidated over a period of up to 12 years. Recently issued federal regulations may require the Corporation to sell certain of these funds prior to liquidation. The investments are accounted for either on the cost or equity method and are individually reviewed for impairment on a quarterly basis by comparing the carrying value to the estimated fair value. These investments may be carried at fair value on a nonrecurring basis when they are deemed to be impaired and written down to fair value. Where there is not a readily determinable fair value, the Corporation estimates fair value for indirect private equity and venture capital investments based on the net asset value, as reported by the fund, after indication that the fund adheres to applicable fair value measurement guidance. On a quarterly basis, the Corporate Development Department is responsible, with appropriate oversight and approval provided by senior management, for performing the valuation procedures and updating significant inputs, as are primarily provided by the underlying fund's management. The Corporation classifies fair value measurements of nonmarketable equity securities as Level 3.
The Corporation also holds restricted equity investments, primarily Federal Home Loan Bank (FHLB) and Federal Reserve Bank (FRB) stock. Restricted equity securities are not readily marketable and are recorded at cost (par value) in "accrued income and other assets" on the consolidated balance sheets and evaluated for impairment based on the ultimate recoverability of the par value. No significant observable market data for these instruments is available. The Corporation considers the profitability and asset quality of the issuer, dividend payment history and recent redemption experience and believes its investments in FHLB and FRB stock are ultimately recoverable at par. Therefore, the carrying amount for these restricted equity investments approximates fair value. The Corporation classifies the estimated fair value of such investments as Level 1. The Corporation's investment in FHLB stock totaled $7 million at both December 31, 2015 and 2014, and its investment in FRB stock totaled $85 million at both December 31, 2015 and 2014.
Other real estate
Other real estate is included in "accrued income and other assets" on the consolidated balance sheets and includes primarily foreclosed property. Foreclosed property is initially recorded at fair value, less costs to sell, at the date of foreclosure, establishing a new cost basis. Subsequently, foreclosed property is carried at the lower of cost or fair value, less costs to sell. Other real estate may be carried at fair value on a nonrecurring basis when fair value is less than cost. Fair value is based upon
NOTES TO CONSOLIDATED FINANCIAL STATEMENTS
Comerica Incorporated and Subsidiaries
independent market prices, appraised value or management's estimate of the value of the property. The Special Assets Group obtains updated independent market prices and appraised values, as required by state regulation or deemed necessary based on market conditions, and determines if additional write-downs are necessary. On a quarterly basis, senior management reviews all other real estate and determines whether the carrying values are reasonable, based on the length of time elapsed since receipt of independent market price or appraised value and current market conditions. When management determines that the fair value of other real estate requires additional adjustments, either as a result of a non-current appraisal or when there is no observable market price, the Corporation classifies the other real estate as Level 3.
Deposit liabilities
The estimated fair value of checking, savings and certain money market deposit accounts is represented by the amounts payable on demand. The estimated fair value of term deposits is calculated by discounting the scheduled cash flows using the period-end rates offered on these instruments. As such, the Corporation classifies the estimated fair value of deposit liabilities as Level 2.
Short-term borrowings
The carrying amount of federal funds purchased, securities sold under agreements to repurchase and other short-term borrowings approximates the estimated fair value. As such, the Corporation classifies the estimated fair value of short-term borrowings as Level 1.
Medium- and long-term debt
The estimated fair value of the Corporation's medium- and long-term debt is based on quoted market values when available. If quoted market values are not available, the estimated fair value is based on the market values of debt with similar characteristics. The Corporation classifies the estimated fair value of medium- and long-term debt as Level 2.
Credit-related financial instruments
Credit-related financial instruments include unused commitments to extend credit and letters of credit. These instruments generate ongoing fees which are recognized over the term of the commitment. In situations where credit losses are probable, the Corporation records an allowance. The carrying value of these instruments included in "accrued expenses and other liabilities" on the consolidated balance sheets, which includes the carrying value of the deferred fees plus the related allowance, approximates the estimated fair value. The Corporation classifies the estimated fair value of credit-related financial instruments as Level 3.
For further information about fair value measurements refer to Note 2.
Other Short-Term Investments
Other short-term investments include trading securities and loans held-for-sale.
Trading securities are carried at fair value. Realized and unrealized gains or losses on trading securities are included in "other noninterest income" on the consolidated statements of income.
Loans held-for-sale, typically residential mortgages originated with the intent to sell and occasionally may include other loans transferred to held-for-sale, are carried at the lower of cost or fair value. Fair value is determined in the aggregate for each portfolio. Changes in fair value are included in "other noninterest income" on the consolidated statements of income.
Investment Securities
Securities not held for trading purposes are classified as available-for-sale or held-to-maturity. Debt securities for which management has the intent and ability to hold to maturity are classified as held-to-maturity and recorded at amortized cost. Securities available-for-sale are recorded at fair value, with unrealized gains and losses, net of income taxes, reported as a separate component of other comprehensive income (loss) (OCI).
Securities transferred from available-for-sale to held-to-maturity are reclassified at fair value on the date of transfer. The net unrealized gain (loss) at the date of transfer is included in historical cost and amortized over the remaining life of the related securities as a yield adjustment consistent with the amortization of the net unrealized gain (loss) included in accumulated other comprehensive loss on the same securities, resulting in no impact to net income.
Investment securities are reviewed quarterly for possible other-than-temporary impairment (OTTI). In determining whether OTTI exists for debt securities in an unrealized loss position, the Corporation assesses the likelihood of selling the security prior to the recovery of its amortized cost basis. If the Corporation intends to sell the debt security or it is more likely than not that the Corporation will be required to sell the debt security prior to the recovery of its amortized cost basis, the debt security is written down to fair value, and the full amount of any impairment charge is recorded as a loss in "net securities gains" in the consolidated statements of income. If the Corporation does not intend to sell the debt security and it is more likely than not that the Corporation
NOTES TO CONSOLIDATED FINANCIAL STATEMENTS
Comerica Incorporated and Subsidiaries
will not be required to sell the debt security prior to recovery of its amortized cost basis, only the credit component of any impairment of a debt security is recognized as a loss in "net securities gains" on the consolidated statements of income, with the remaining impairment recorded in OCI.
The OTTI review for equity securities includes an analysis of the facts and circumstances of each individual investment and focuses on the severity of loss, the length of time the fair value has been below cost, the expectation for that security's performance, the financial condition and near-term prospects of the issuer, and management's intent and ability to hold the security to recovery. A decline in value of an equity security that is considered to be other-than-temporary is recorded as a loss in "net securities (losses) gains" on the consolidated statements of income.
Gains or losses on the sale of securities are computed based on the adjusted cost of the specific security sold.
For further information on investment securities, refer to Note 3.
Loans
Loans and leases originated and held for investment are recorded at the principal balance outstanding, net of unearned income, charge-offs and unamortized deferred fees and costs. Interest income is recognized on loans and leases using the interest method.
Loans and leases acquired in business combinations are initially recorded at fair value with no carryover of any existing allowance for loan losses. Acquired loans with evidence of credit quality deterioration at acquisition are reviewed to determine if it is probable that the Corporation will not be able to collect all contractual amounts due, including both principal and interest. When both conditions exist, such loans are accounted for as purchased credit-impaired (PCI) loans. The Corporation generally aggregates PCI loans into pools of loans based on common risk characteristics.
The Corporation estimates the total cash flows expected to be collected from the pools of acquired PCI loans, which include undiscounted expected principal and interest, using credit risk, interest rate and prepayment risk models that incorporate management's best estimate of current key assumptions such as default rates, loss severity and payment speeds. The excess of the undiscounted total cash flows expected to be collected over the fair value of the related PCI loans represents the accretable yield, which is recognized as interest income on a level-yield basis over the life of the related loan pools.
For acquired loans not deemed credit-impaired at acquisition, the difference between the initial fair value and the unpaid principal balance is recognized as interest income on a level-yield basis over the lives of the related loans.
The Corporation assesses all loan modifications to determine whether a restructuring constitutes a troubled debt restructuring (TDR). A restructuring is considered a TDR when a borrower is experiencing financial difficulty and the Corporation grants a concession to the borrower. TDRs on accrual status at the original contractual rate of interest are considered performing. Nonperforming TDRs include TDRs on nonaccrual status and loans which have been renegotiated to less than the original contractual rates (reduced-rate loans). All TDRs are considered impaired loans.
Loan Origination Fees and Costs
Substantially all loan origination fees and costs are deferred and amortized to net interest income over the life of the related loan or over the commitment period as a yield adjustment. Net deferred income on originated loans, including unearned income and unamortized costs, fees, premiums and discounts, totaled $226 million and $267 million at December 31, 2015 and 2014, respectively.
Loan fees on unused commitments and net origination fees related to loans sold are recognized in noninterest income.
Allowance for Credit Losses
The allowance for credit losses includes both the allowance for loan losses and the allowance for credit losses on lending-related commitments.
The Corporation disaggregates the loan portfolio into segments for purposes of determining the allowance for credit losses. These segments are based on the level at which the Corporation develops, documents and applies a systematic methodology to determine the allowance for credit losses. The Corporation's portfolio segments are business loans and retail loans. Business loans include the commercial, real estate construction, commercial mortgage, lease financing and international loan portfolios. Retail loans consist of traditional residential mortgage, home equity and other consumer loans.
For further information on the Allowance for Credit Losses, refer to Note 4.
NOTES TO CONSOLIDATED FINANCIAL STATEMENTS
Comerica Incorporated and Subsidiaries
Allowance for Loan Losses
The allowance for loan losses represents management's assessment of probable, estimable losses inherent in the Corporation's loan portfolio. The allowance for loan losses includes specific allowances, based on individual evaluations of certain loans, and allowances for homogeneous pools of loans with similar risk characteristics.
The Corporation individually evaluates certain impaired loans on a quarterly basis and establishes specific allowances for such loans, if required. A loan is considered impaired when it is probable that interest or principal payments will not be made in accordance with the contractual terms of the loan agreement. Consistent with this definition, all loans for which the accrual of interest has been discontinued (nonaccrual loans) are considered impaired. The Corporation individually evaluates nonaccrual loans with book balances of $2 million or more and accruing loans whose terms have been modified in a TDR. The threshold for individual evaluation is revised on an infrequent basis, generally when economic circumstances change significantly. Specific allowances for impaired loans are estimated using one of several methods, including the estimated fair value of underlying collateral, observable market value of similar debt or discounted expected future cash flows. Collateral values supporting individually evaluated impaired loans are evaluated quarterly. Either appraisals are obtained or appraisal assumptions are updated at least annually unless conditions dictate increased frequency. The Corporation may reduce the collateral value based upon the age of the appraisal and adverse developments in market conditions.
Loans which do not meet the criteria to be evaluated individually are evaluated in homogeneous pools of loans with similar risk characteristics. Business loans are assigned to pools based on the Corporation's internal risk rating system. Internal risk ratings are assigned to each business loan at the time of approval and are subjected to subsequent periodic reviews by the Corporation's senior management, generally at least annually or more frequently upon the occurrence of a circumstance that affects the credit risk of the loan. For business loans not individually evaluated, losses inherent to the pool are estimated by applying standard reserve factors to outstanding principal balances. Standard reserve factors are based on estimated probabilities of default for each internal risk rating, set to a default horizon based on an estimated loss emergence period, and loss given default. These factors are evaluated quarterly and updated annually, unless economic conditions necessitate a change, giving consideration to count-based borrower risk rating migration experience and trends, recent charge-off experience, current economic conditions and trends, changes in collateral values of properties securing loans, and trends with respect to past due and nonaccrual amounts.
The allowance for business loans not individually evaluated also includes qualitative adjustments to bring the allowance to the level management believes is appropriate based on factors that have not otherwise been fully accounted for, including adjustments for (i) risk factors that have not been fully addressed in internal risk ratings, (ii) imprecision in the risk rating system resulting from inaccuracy in assigning and/or entering risk ratings in the loan accounting system, (iii) market conditions and (iv) model imprecision. Risk factors that have not been fully addressed in internal risk ratings may include portfolios where recent historical losses exceed expected losses or known recent events are expected to alter risk ratings once evidence is acquired, portfolios where a certain level of concentration introduces added risk, or changes in the level and quality of experience held by lending management. An additional allowance for risk rating errors is calculated based on the results of risk rating accuracy assessments performed on samples of business loans conducted by the Corporation's asset quality review function, a function independent of the lending and credit groups responsible for assigning the initial internal risk rating at the time of approval. Qualitative adjustments for market conditions are determined based on an established framework. The determination of the appropriate adjustment is based on management's analysis of observable macroeconomic metrics, including consideration of regional metrics within the Corporation's footprint, internal credit risk movement and a qualitative assessment of the lending environment, including underwriting standards, current economic and political conditions, and other factors affecting credit quality. Management recognizes the sensitivity of various assumptions made in the quantitative modeling of expected losses and may adjust reserves depending upon the level of uncertainty that currently exists in one or more assumption.
In the second quarter 2014, the Corporation enhanced the approach used to determine the standard reserve factors used in estimating the allowance for credit losses, which had the effect of capturing certain elements in the standard reserve component that had formerly been included in the qualitative assessment. The impact of the change was largely neutral to the total allowance for loan losses at June 30, 2014. However, because standard reserves are allocated to the segments at the loan level, while qualitative reserves are allocated at the portfolio level, the impact of the methodology change on the allowance of each segment reflected the characteristics of the individual loans within each segment's portfolio, causing segment reserves to increase or decrease accordingly.
In the first quarter 2013, the Corporation enhanced the approach utilized for determining standard reserve factors by changing from a dollar-based migration method for developing probability of default statistics to a count-based method. Under the dollar-based method, each dollar that moved to default received equal weight in the determination of standard reserve factors for each internal risk rating. As a result, the movement of larger loans impacted standard reserve factors more than the movement of smaller loans. By moving to a count-based approach, where each loan that moves to default receives equal weighting, unusually large or small loans will not have a disproportionate influence on the standard reserve factors. The change resulted in a $40 million increase to the allowance for loan losses at March 31, 2013.
NOTES TO CONSOLIDATED FINANCIAL STATEMENTS
Comerica Incorporated and Subsidiaries
The allowance for retail loans not individually evaluated is determined by applying estimated loss rates to various pools of loans within the portfolios with similar risk characteristics. Estimated loss rates for all pools are updated quarterly, incorporating factors such as recent charge-off experience, current economic conditions and trends, changes in collateral values of properties securing loans (using index-based estimates), and trends with respect to past due and nonaccrual amounts.
Loans acquired in business combinations are initially recorded at fair value, which includes an estimate of credit losses expected to be realized over the remaining lives of the loans, and therefore no corresponding allowance for loan losses is recorded for these loans at acquisition. Methods utilized to estimate any subsequently required allowance for loan losses for acquired loans not deemed credit-impaired at acquisition are similar to originated loans; however, the estimate of loss is based on the unpaid principal balance less any remaining purchase discount.
The total allowance for loan losses is sufficient to absorb incurred losses inherent in the total portfolio. Unanticipated economic events, including political, economic and regulatory instability in countries where the Corporation has loans, could cause changes in the credit characteristics of the portfolio and result in an unanticipated increase in the allowance. Significant increases in current portfolio exposures, as well as the inclusion of additional industry-specific portfolio exposures in the allowance, could also increase the amount of the allowance. Any of these events, or some combination thereof, may result in the need for additional provision for credit losses in order to maintain an allowance that complies with credit risk and accounting policies.
Loans deemed uncollectible are charged off and deducted from the allowance. Recoveries on loans previously charged off are added to the allowance.
Allowance for Credit Losses on Lending-Related Commitments
The allowance for credit losses on lending-related commitments provides for probable losses inherent in lending-related commitments, including unused commitments to extend credit and letters of credit. The allowance for credit losses on lending-related commitments includes allowances based on homogeneous pools of letters of credit and unused commitments to extend credit within each internal risk rating. A probability of draw estimate is applied to the commitment amount, and the result is multiplied by standard reserve factors consistent with business loans. In general, the probability of draw for letters of credit is considered certain for all letters of credit supporting loans and for letters of credit assigned an internal risk rating generally consistent with regulatory defined substandard or doubtful. Other letters of credit and all unfunded commitments have a lower probability of draw. The allowance for credit losses on lending-related commitments is included in "accrued expenses and other liabilities" on the consolidated balance sheets, with the corresponding charge reflected in the "provision for credit losses" on the consolidated statements of income.
Nonperforming Assets
Nonperforming assets consist of nonaccrual loans, reduced-rate loans and foreclosed property.
A loan is considered past due when the contractually required principal or interest payment is not received by the specified due date or, for certain loans, when a scheduled monthly payment is past due and unpaid for 30 days or more. Business loans are generally placed on nonaccrual status when management determines full collection of principal or interest is unlikely or when principal or interest payments are 90 days past due, unless the loan is fully collateralized and in the process of collection. The past-due status of a business loan is one of many indicative factors considered in determining the collectibility of the credit. The primary driver of when the principal amount of a business loan should be fully or partially charged-off is based on a qualitative assessment of the recoverability of the principal amount from collateral and other cash flow sources. Residential mortgage and home equity loans are generally placed on nonaccrual status once they become 90 days past due and are charged off to current appraised values less costs to sell no later than 180 days past due. In addition, junior lien home equity loans less than 90 days past due are placed on nonaccrual status if they have underlying risk characteristics that place full collection of the loan in doubt, such as when the related senior lien position is identified as seriously delinquent. Residential mortgage and consumer loans in bankruptcy for which the court has discharged the borrower's obligation and the borrower has not reaffirmed the debt are placed on nonaccrual status and written down to estimated collateral value, without regard to the actual payment status of the loan, and are classified as TDRs. All other consumer loans are generally placed on nonaccrual status at 90 days past due and are charged off at no later than 120 days past due, earlier if deemed uncollectible.
At the time a loan is placed on nonaccrual status, interest previously accrued but not collected is charged against current income. Principal and interest payments received on such loans are generally first applied as a reduction of principal. Income on nonaccrual loans is then recognized only to the extent that cash is received after principal has been fully repaid or future collection of principal is probable. Generally, a loan may be returned to accrual status when all delinquent principal and interest have been received and the Corporation expects repayment of the remaining contractual principal and interest, or when the loan or debt security is both well secured and in the process of collection.
NOTES TO CONSOLIDATED FINANCIAL STATEMENTS
Comerica Incorporated and Subsidiaries
PCI loans are recorded at fair value at acquisition date. Although the PCI loans may be contractually delinquent, the Corporation does not classify these loans as past due or nonperforming as the loans were written down to fair value at the acquisition date and the accretable yield is recognized in interest income over the remaining life of the loan.
Foreclosed property (primarily real estate) is initially recorded at fair value, less costs to sell, at the date of foreclosure and subsequently carried at the lower of cost or fair value, less estimated costs to sell. Loans are reclassified to foreclosed property upon obtaining legal title to the collateral. Independent appraisals are obtained to substantiate the fair value of foreclosed property at the time of foreclosure and updated at least annually or upon evidence of deterioration in the property's value. At the time of foreclosure, the adjustment for the difference between the related loan balance and fair value (less estimated costs to sell) of the property acquired is charged or credited to the allowance for loan losses. Subsequent write-downs, operating expenses and losses upon sale, if any, are charged to noninterest expenses. Foreclosed property is included in "accrued income and other assets" on the consolidated balance sheets.
Premises and Equipment
Premises and equipment are stated at cost, less accumulated depreciation and amortization. Depreciation, computed on the straight-line method, is charged to operations over the estimated useful lives of the assets. Estimated useful lives are generally 3 years to 33 years for premises that the Corporation owns and 3 years to 8 years for furniture and equipment. Leasehold improvements are generally amortized over the terms of their respective leases or 10 years, whichever is shorter.
Software
Capitalized software is stated at cost, less accumulated amortization. Capitalized software includes purchased software and capitalizable application development costs associated with internally-developed software. Amortization, computed on the straight-line method, is charged to operations over 5 years, the estimated useful life of the software. Capitalized software is included in "accrued income and other assets" on the consolidated balance sheets.
Goodwill and Core Deposit Intangibles
Goodwill, included in "accrued income and other assets" on the consolidated balance sheets, is initially recorded as the excess of the purchase price over the fair value of net assets acquired in a business combination and is subsequently evaluated at least annually for impairment. Goodwill impairment testing is performed at the reporting unit level, equivalent to a business segment or one level below. The Corporation has three reporting units: the Business Bank, the Retail Bank and Wealth Management.
The Corporation performs its annual evaluation of goodwill impairment in the third quarter of each year and on an interim basis if events or changes in circumstances between annual tests suggest additional testing may be warranted to determine if goodwill might be impaired. The goodwill impairment test is a two-step test. The first step of the goodwill impairment test compares the estimated fair value of identified reporting units with their carrying amount, including goodwill. If the estimated fair value of the reporting unit is less than the carrying value, the second step must be performed to determine the implied fair value of the reporting unit's goodwill and the amount of goodwill impairment, if any. The implied fair value of goodwill is determined as if the reporting unit were being acquired in a business combination. If the implied fair value of goodwill exceeds the goodwill assigned to the reporting unit, there is no impairment. If the goodwill assigned to a reporting unit exceeds the implied fair value of goodwill, an impairment charge would be recorded for the excess.
In performing the annual impairment test, the carrying value of each reporting unit is the greater of economic or regulatory capital. The Corporation assigns economic capital using internal management methodologies on the basis of each reporting unit's credit, operational and interest rate risks, as well as goodwill. To determine regulatory capital, each reporting unit is assigned sufficient capital such that their respective Tier 1 ratio, based on allocated risk-weighted assets, is the same as that of the Corporation. Using this two-pronged approach, the Corporation's equity is fully allocated to its reporting units except for capital held primarily for the risk associated with the securities portfolio which is assigned to the Finance segment of the Corporation.
The estimated fair values of the reporting units are determined using a blend of two commonly used valuation techniques: the market approach and the income approach. For the market approach, valuations of reporting units consider a combination of earnings, equity and other multiples from companies with characteristics similar to the reporting unit. Since the fair values determined under the market approach are representative of noncontrolling interests, the valuations accordingly incorporate a control premium. For the income approach, estimated future cash flows and terminal value are discounted. Estimated future cash flows are derived from internal forecasts and economic expectations for each reporting unit which incorporate uncertainty factors inherent to long-term projections. The applicable discount rate is based on the imputed cost of equity capital appropriate for each reporting unit, which incorporates the risk-free rate of return, the level of non-diversified risk associated with companies with characteristics similar to the reporting unit, an entity-specific risk premium and a market equity risk premium. Determining the fair value of reporting units is a subjective process involving the use of estimates and judgments related to the selection of inputs
NOTES TO CONSOLIDATED FINANCIAL STATEMENTS
Comerica Incorporated and Subsidiaries
such as future cash flows, discount rates, comparable public company multiples, applicable control premiums and economic expectations used in determining the interest rate environment.
The Corporation may choose to perform a qualitative assessment to determine whether the first step of the impairment test should be performed in future periods if certain factors indicate that impairment is unlikely. Factors which could be considered in the assessment of the likelihood of impairment include macroeconomic conditions, industry and market considerations, stock performance of the Corporation and its peers, financial performance, events affecting the Corporation as a whole or its reporting units individually and previous results of goodwill impairment tests.
Core deposit intangibles are amortized on an accelerated basis, based on the estimated period the economic benefits are expected to be received. Core deposit intangibles are reviewed for impairment when events or changes in circumstances indicate that their carrying amounts may not be recoverable. Impairment for a finite-lived intangible asset exists if the sum of the undiscounted cash flows expected to result from the use of the asset exceeds its carrying value.
Additional information regarding goodwill and core deposit intangibles can be found in Note 7.
Nonmarketable Equity Securities
The Corporation has certain investments that are not readily marketable. These investments include a portfolio of investments in indirect private equity and venture capital funds and restricted equity investments, which are securities the Corporation is required to hold for various reasons, primarily Federal Home Loan Bank of Dallas (FHLB) and Federal Reserve Bank (FRB) stock. These investments are accounted for on the cost or equity method and are included in "accrued income and other assets" on the consolidated balance sheets. The investments are individually reviewed for impairment on a quarterly basis. Indirect private equity and venture capital funds are evaluated by comparing the carrying value to the estimated fair value. The amount by which the carrying value exceeds the fair value that is determined to be other-than-temporary impairment is charged to current earnings and the carrying value of the investment is written down accordingly. FHLB and FRB stock are recorded at cost (par value) and evaluated for impairment based on the ultimate recoverability of the par value. If the Corporation does not expect to recover the full par value, the amount by which the par value exceeds the ultimately recoverable value would be charged to current earnings and the carrying value of the investment would be written down accordingly.
Derivative Instruments and Hedging Activities
Derivative instruments are carried at fair value in either "accrued income and other assets" or "accrued expenses and other liabilities" on the consolidated balance sheets. The accounting for changes in the fair value (i.e., gains or losses) of a derivative instrument is determined by whether it has been designated and qualifies as part of a hedging relationship and, further, by the type of hedging relationship. The Corporation presents derivative instruments at fair value in the consolidated balance sheets on a net basis when a right of offset exists, based on transactions with a single counterparty and any cash collateral paid to and/or received from that counterparty for derivative contracts that are subject to legally enforceable master netting arrangements. For derivative instruments designated and qualifying as fair value hedges (i.e., hedging the exposure to changes in the fair value of an asset or a liability or an identified portion thereof that is attributable to a particular risk), the gain or loss on the derivative instrument, as well as the offsetting loss or gain on the hedged item attributable to the hedged risk, are recognized in current earnings during the period of the change in fair values. For derivative instruments that are designated and qualify as cash flow hedges (i.e., hedging the exposure to variability in expected future cash flows that is attributable to a particular risk), the effective portion of the gain or loss on the derivative instrument is reported as a component of other comprehensive income and reclassified into earnings in the same period or periods during which the hedged transaction affects earnings. The remaining gain or loss on the derivative instrument in excess of the cumulative change in the present value of future cash flows of the hedged item (i.e., the ineffective portion), if any, is recognized in current earnings during the period of change. For derivative instruments not designated as hedging instruments, the gain or loss is recognized in current earnings during the period of change.
For derivatives designated as hedging instruments at inception, the Corporation uses either the short-cut method or applies statistical regression analysis to assess effectiveness. The short-cut method is used for $400 million notional of fair value hedges of medium and long-term debt issued prior to 2006. This method allows for the assumption of zero hedge ineffectiveness and eliminates the requirement to further assess hedge effectiveness on these transactions. For hedge relationships to which the Corporation does not apply the short-cut method, statistical regression analysis is used at inception and for each reporting period thereafter to assess whether the derivative used has been and is expected to be highly effective in offsetting changes in the fair value or cash flows of the hedged item. All components of each derivative instrument's gain or loss are included in the assessment of hedge effectiveness. Net hedge ineffectiveness is recorded in "other noninterest income" on the consolidated statements of income.
Further information on the Corporation's derivative instruments and hedging activities is included in Note 8.
NOTES TO CONSOLIDATED FINANCIAL STATEMENTS
Comerica Incorporated and Subsidiaries
Short-Term Borrowings
Securities sold under agreements to repurchase are treated as collateralized borrowings and are recorded at amounts equal to the cash received. The contractual terms of the agreements to repurchase may require the Corporation to provide additional collateral if the fair value of the securities underlying the borrowings declines during the term of the agreement.
Financial Guarantees
Certain guarantee contracts or indemnification agreements that contingently require the Corporation, as guarantor, to make payments to the guaranteed party are initially measured at fair value and included in "accrued expenses and other liabilities" on the consolidated balance sheets. The subsequent accounting for the liability depends on the nature of the underlying guarantee. The release from risk is accounted for under a particular guarantee when the guarantee expires or is settled, or by a systematic and rational amortization method.
Further information on the Corporation's obligations under guarantees is included in Note 8.
Share-Based Compensation
The Corporation recognizes share-based compensation expense using the straight-line method over the requisite service period for all stock awards, including those with graded vesting. The requisite service period is the period an employee is required to provide service in order to vest in the award, which cannot extend beyond the date at which the employee is no longer required to perform any service to receive the share-based compensation (the retirement-eligible date). Certain awards are contingent upon performance and/or market conditions, which affect the number of shares ultimately issued. The Corporation periodically evaluates the probable outcome of the performance conditions and makes cumulative adjustments to compensation expense as appropriate. Market conditions are included in the determination of the fair value of the award on the date of grant. Subsequent to the grant date, market conditions have no impact on the amount of compensation expense the Corporation will recognize over the life of the award.
Further information on the Corporation's share-based compensation plans is included in Note 16.
Revenue Recognition
The following summarizes the Corporation's revenue recognition policies as they relate to certain noninterest income line items in the consolidated statements of income.
Card fees includes primarily bankcard interchange revenue which is recorded as revenue when earned. Effective January 1, 2015, the Corporation entered into a new contract for an existing debit card program. Guidance provided in Accounting Standards Code 605-45, "Principal Agent Considerations," indicates whether revenue should be reported gross or net for this type of arrangement. Management assessed various principal versus agent indicators provided in the guidance and concluded that the Corporation bears the risks and rewards of providing the services for the card program based on the new contract terms and, therefore, gross presentation of revenues and expenses is appropriate. This change in presentation resulted in increases of $181 million to both "card fees" in noninterest income and "outside processing fee expense" in noninterest expenses for the year ended December 31, 2015.
Service charges on deposit accounts include fees for banking services provided, overdrafts and non-sufficient funds. Revenue is generally recognized in accordance with published deposit account agreements for retail accounts or contractual agreements for commercial accounts.
Fiduciary income includes fees and commissions from asset management, custody, recordkeeping, investment advisory and other services provided to personal and institutional trust customers. Revenue is recognized on an accrual basis at the time the services are performed and are based on either the market value of the assets managed or the services provided.
Commercial lending fees primarily include fees assessed on the unused portion of commercial lines of credit ("unused commitment fees") and syndication agent fees. Unused commitment fees are recognized when earned. Syndication agent fees are generally recognized when the transaction is complete.
Defined Benefit Pension and Other Postretirement Costs
Defined benefit pension costs are included in "salaries and benefits expense" on the consolidated statements of income and are funded consistent with the requirements of federal laws and regulations. Inherent in the determination of defined benefit pension costs are assumptions concerning future events that will affect the amount and timing of required benefit payments under the plans. These assumptions include demographic assumptions such as retirement age and mortality, a compensation rate increase, a discount rate used to determine the current benefit obligation and a long-term expected rate of return on plan assets. Net periodic defined benefit pension expense includes service cost, interest cost based on the assumed discount rate, an expected return on plan
NOTES TO CONSOLIDATED FINANCIAL STATEMENTS
Comerica Incorporated and Subsidiaries
assets based on an actuarially derived market-related value of assets, amortization of prior service cost and amortization of net actuarial gains or losses. The market-related value of plan assets is determined by amortizing the current year's investment gains and losses (the actual investment return net of the expected investment return) over 5 years. The amortization adjustment cannot exceed 10 percent of the fair value of assets. Prior service costs include the impact of plan amendments on the liabilities and are amortized over the future service periods of active employees expected to receive benefits under the plan. Actuarial gains and losses result from experience different from that assumed and from changes in assumptions (excluding asset gains and losses not yet reflected in market-related value). Amortization of actuarial gains and losses is included as a component of net periodic defined benefit pension cost for a year if the actuarial net gain or loss exceeds 10 percent of the greater of the projected benefit obligation or the market-related value of plan assets. If amortization is required, the excess is amortized over the average remaining service period of participating employees expected to receive benefits under the plan.
Postretirement benefits are recognized in "salaries and benefits expense" on the consolidated statements of income during the average remaining service period of participating employees expected to receive benefits under the plan or the average remaining future lifetime of retired participants currently receiving benefits under the plan.
See Note 17 for further information regarding the Corporation's defined benefit pension and other postretirement plans.
Income Taxes
The provision for income taxes is the sum of income taxes due for the current year and deferred taxes. Deferred taxes arise from temporary differences between the income tax basis and financial accounting basis of assets and liabilities. Deferred tax assets are evaluated for realization based on available evidence of loss carry-back capacity, future reversals of existing taxable temporary differences, and assumptions made regarding future events. A valuation allowance is provided when it is more likely than not that some portion of the deferred tax asset will not be realized.
The Corporation classifies interest and penalties on income tax liabilities in the "provision for income taxes" on the consolidated statements of income.
Earnings Per Share
Basic net income per common share is calculated using the two-class method. The two-class method is an earnings allocation formula that determines earnings per share for each share of common stock and participating securities according to dividends declared (distributed earnings) and participation rights in undistributed earnings. Distributed and undistributed earnings are allocated between common and participating security shareholders based on their respective rights to receive dividends. Nonvested share-based payment awards that contain nonforfeitable rights to dividends or dividend equivalents are considered participating securities (e.g., nonvested restricted stock and service-based restricted stock units). Undistributed net losses are not allocated to nonvested restricted shareholders, as these shareholders do not have a contractual obligation to fund the losses incurred by the Corporation. Net income attributable to common shares is then divided by the weighted-average number of common shares outstanding during the period.
Diluted net income per common share is calculated using the more dilutive of either the treasury method or the two-class method. The dilutive calculation considers common stock issuable under the assumed exercise of stock options and performance-based restricted stock units granted under the Corporation's stock plans and warrants using the treasury stock method, if dilutive. Net income attributable to common shares is then divided by the total of weighted-average number of common shares and common stock equivalents outstanding during the period.
Statements of Cash Flows
Cash and cash equivalents are defined as those amounts included in "cash and due from banks", "federal funds sold" and "interest-bearing deposits with banks" on the consolidated balance sheets.
Comprehensive Income (Loss)
The Corporation presents on an annual basis the components of net income and other comprehensive income in two separate, but consecutive statements and presents on an interim basis the components of net income and a total for comprehensive income in one continuous consolidated statement of comprehensive income.
Pending Accounting Pronouncements
In May 2014, the Financial Accounting Standards Board (FASB) issued Accounting Standards Update (ASU) No. 2014-09, "Revenue from Contracts with Customers (Topic 606)," (ASU 2014-09), which is intended to improve and converge the financial reporting requirements for revenue contracts with customers. Previous GAAP comprised broad revenue recognition concepts along with numerous industry-specific requirements. The new guidance establishes a five-step model which entities must follow to
NOTES TO CONSOLIDATED FINANCIAL STATEMENTS
Comerica Incorporated and Subsidiaries
recognize revenue and removes inconsistencies and weaknesses in existing guidance. The guidance under ASU 2014-09 is effective for annual and interim periods beginning after December 15, 2017, and must be retrospectively applied. Entities will have the option of presenting prior periods as impacted by the new guidance or presenting the cumulative effect of initial application along with supplementary disclosures. Early adoption is permitted, but not before annual and interim periods beginning after December 15, 2016. The Corporation is currently evaluating the impact of adopting ASU 2014-09.
In February 2015, the FASB issued ASU No. 2015-02, "Consolidation (Topic 810): Amendments to the Consolidation Analysis," (ASU 2015-02), which makes targeted amendments to the considerations applied by reporting entities when determining if a legal entity should be consolidated, including placing more emphasis on risk of loss when determining a controlling financial interest. Low-income housing tax credit investments that meet the criteria for the proportional amortization method are not impacted by these amendments. ASU 2015-02 is effective for annual and interim periods beginning after December 15, 2015, and must be retrospectively applied. Early adoption is permitted. The adoption of the ASU will have no impact to the Corporation's financial condition or results of operations.
In April 2015, the FASB issued ASU No. 2015-05, "Goodwill and Other - Internal-Use Software (Subtopic 350-40)," (ASU 2015-05), which defines specific criteria entities must apply to determine if a cloud computing arrangement includes an in-substance software license. The result of the assessment will direct the entity to apply either software licensing or service contract guidance to record the related costs. ASU 2015-05 is effective for annual and interim periods beginning after December 15, 2015, and can be prospectively or retrospectively applied. Early adoption is permitted. The adoption of the ASU is expected to have an immaterial impact to the Corporation's financial condition or results of operations.
In May 2015, the FASB issued ASU No. 2015-07, "Fair Value Measurement (Topic 820): Disclosures for Investments in Certain Entities That Calculate Net Asset Value per Share (or Its Equivalent)," (ASU 2015-07), which amends disclosure requirements for entities that utilize net asset value per share (or its equivalent) to measure fair value as a practical expedient. The update eliminates the requirement to classify these investments within the fair value hierarchy and instead requires disclosure of sufficient information about these investments to permit reconciliation of the fair value of investments categorized within the fair value hierarchy to the investments presented in the consolidated balance sheet. ASU 2015-07 is effective for annual and interim periods beginning after December 15, 2015 and must be applied retrospectively. Early adoption is permitted. The adoption of ASU 2015-07 will impact disclosures, but will have no impact on the Corporation's financial condition or results of operations.
In January, 2016, the FASB issued ASU No. 2016-01, "Financial Instruments - Overall (Subtopic 825-10): Recognition of Financial Assets and Financial Liabilities," (ASU 2016-01), which makes targeted amendments to fair value measurement and disclosure guidance. ASU 2016-01 requires equity investments (other than equity method investments) to be measured at fair value with changes in fair value recognized in net income. This change is only applied if a readily determinable fair value can be obtained. The update also requires the use of exit prices to measure fair value for disclosure purposes as well as other enhanced disclosure requirements. The guidance under ASU 2016-01 is effective for annual and interim periods beginning after December 15, 2017, and early adoption is generally not permitted. At adoption on January 1, 2018, cumulative net unrealized gains and losses on equity investments other than equity method investments will be recognized as an adjustment to beginning retained earnings and accumulated other comprehensive income (loss). Amendments related to equity securities without a readily determinable fair value will be applied prospectively. The Corporation is currently evaluating the impact of adopting ASU 2016-01.
NOTES TO CONSOLIDATED FINANCIAL STATEMENTS
Comerica Incorporated and Subsidiaries
NOTE 2 – FAIR VALUE MEASUREMENTS
The Corporation utilizes fair value measurements to record fair value adjustments to certain assets and liabilities and to determine fair value disclosures. The determination of fair values of financial instruments often requires the use of estimates. In cases where quoted market values in an active market are not available, the Corporation uses present value techniques and other valuation methods to estimate the fair values of its financial instruments. These valuation methods require considerable judgment and the resulting estimates of fair value can be significantly affected by the assumptions made and methods used.
Trading securities, investment securities available-for-sale, derivatives and deferred compensation plan liabilities are recorded at fair value on a recurring basis. Additionally, from time to time, the Corporation may be required to record other assets and liabilities at fair value on a nonrecurring basis, such as impaired loans, other real estate (primarily foreclosed property), nonmarketable equity securities and certain other assets and liabilities. These nonrecurring fair value adjustments typically involve write-downs of individual assets or application of lower of cost or fair value accounting.
Refer to Note 1 for further information about the fair value hierarchy, descriptions of the valuation methodologies and key inputs used to measure financial assets and liabilities recorded at fair value, as well as a description of the methods and significant assumptions used to estimate fair value disclosures for financial instruments not recorded at fair value in their entirety on a recurring basis.
ASSETS AND LIABLILITIES RECORDED AT FAIR VALUE ON A RECURRING BASIS
The following tables present the recorded amount of assets and liabilities measured at fair value on a recurring basis as of December 31, 2015 and 2014.
|
| | | | | | | | | | | | | | | | |
| (in millions) | Total | | Level 1 | | Level 2 | | Level 3 | |
| December 31, 2015 | | | | | | | | |
| | | | | | | | | |
| Trading securities: | | | | | | | | |
| Deferred compensation plan assets | $ | 89 |
| | $ | 89 |
| | $ | — |
| | $ | — |
| |
| Equity and other non-debt securities | 3 |
| | 3 |
| | — |
| | — |
| |
| Total trading securities | 92 |
| | 92 |
| | — |
| | — |
| |
| Investment securities available-for-sale: | | | | | | | | |
| U.S. Treasury and other U.S. government agency securities | 2,763 |
| | 2,763 |
| | — |
| | — |
| |
| Residential mortgage-backed securities (a) | 7,545 |
| | — |
| | 7,545 |
| | — |
| |
| State and municipal securities | 9 |
| | — |
| | — |
| | 9 |
| (b) |
| Corporate debt securities | 1 |
| | — |
| | — |
| | 1 |
| (b) |
| Equity and other non-debt securities | 201 |
| | 134 |
| | — |
| | 67 |
| (b) |
| Total investment securities available-for-sale | 10,519 |
| | 2,897 |
| | 7,545 |
| | 77 |
| |
| Derivative assets: | | | | | | | | |
| Interest rate contracts | 286 |
| | — |
| | 277 |
| | 9 |
| |
| Energy derivative contracts | 475 |
| | — |
| | 475 |
| | — |
| |
| Foreign exchange contracts | 57 |
| | — |
| | 57 |
| | — |
| |
| Warrants | 2 |
| | — |
| | — |
| | 2 |
| |
| Total derivative assets | 820 |
| | — |
| | 809 |
| | 11 |
| |
| Total assets at fair value | $ | 11,431 |
| | $ | 2,989 |
| | $ | 8,354 |
| | $ | 88 |
| |
| Derivative liabilities: | | | | | | | | |
| Interest rate contracts | $ | 92 |
| | $ | — |
| | $ | 92 |
| | $ | — |
| |
| Energy derivative contracts | 472 |
| | — |
| | 472 |
| | — |
| |
| Foreign exchange contracts | 46 |
| | — |
| | 46 |
| | — |
| |
| Total derivative liabilities | 610 |
| | — |
| | 610 |
| | — |
| |
| Deferred compensation plan liabilities | 89 |
| | 89 |
| | — |
| | — |
| |
| Total liabilities at fair value | $ | 699 |
| | $ | 89 |
| | $ | 610 |
| | $ | — |
| |
| |
| (a) | Issued and/or guaranteed by U.S. government agencies or U.S. government-sponsored enterprises. |
| |
| (b) | Auction-rate securities. |
NOTES TO CONSOLIDATED FINANCIAL STATEMENTS
Comerica Incorporated and Subsidiaries
|
| | | | | | | | | | | | | | | | |
| (in millions) | Total | | Level 1 | | Level 2 | | Level 3 | |
| December 31, 2014 | | | | | | | | |
| Trading securities: | | | | | | | | |
| Deferred compensation plan assets | $ | 94 |
| | $ | 94 |
| | $ | — |
| | $ | — |
| |
| Investment securities available-for-sale: | | | | | | | | |
| U.S. Treasury and other U.S. government agency securities | 526 |
| | 526 |
| | — |
| | — |
| |
| Residential mortgage-backed securities (a) | 7,274 |
| | — |
| | 7,274 |
| | — |
| |
| State and municipal securities | 23 |
| | — |
| | — |
| | 23 |
| (b) |
| Corporate debt securities | 51 |
| | — |
| | 50 |
| | 1 |
| (b) |
| Equity and other non-debt securities | 242 |
| | 130 |
| | — |
| | 112 |
| (b) |
| Total investment securities available-for-sale | 8,116 |
| | 656 |
| | 7,324 |
| | 136 |
| |
| Derivative assets: | | | | | | | | |
| Interest rate contracts | 328 |
| | — |
| | 328 |
| | — |
| |
| Energy derivative contracts | 527 |
| | — |
| | 527 |
| | — |
| |
| Foreign exchange contracts | 39 |
| | — |
| | 39 |
| | — |
| |
| Warrants | 4 |
| | — |
| | — |
| | 4 |
| |
| Total derivative assets | 898 |
| | — |
| | 894 |
| | 4 |
| |
| Total assets at fair value | $ | 9,108 |
| | $ | 750 |
| | $ | 8,218 |
| | $ | 140 |
| |
| Derivative liabilities: | | | | | | | | |
| Interest rate contracts | $ | 102 |
| | $ | — |
| | $ | 102 |
| | $ | — |
| |
| Energy derivative contracts | 525 |
| | — |
| | 525 |
| | — |
| |
| Foreign exchange contracts | 34 |
| | — |
| | 34 |
| | — |
| |
| Total derivative liabilities | 661 |
| | — |
| | 661 |
| | — |
| |
| Deferred compensation plan liabilities | 94 |
| | 94 |
| | — |
| | — |
| |
| Total liabilities at fair value | $ | 755 |
| | $ | 94 |
| | $ | 661 |
| | $ | — |
| |
| |
| (a) | Issued and/or guaranteed by U.S. government agencies or U.S. government-sponsored enterprises. |
| |
| (b) | Auction-rate securities. |
There were no transfers of assets or liabilities recorded at fair value on a recurring basis into or out of Level 1, Level 2 and Level 3 fair value measurements during the years ended December 31, 2015 and 2014.
NOTES TO CONSOLIDATED FINANCIAL STATEMENTS
Comerica Incorporated and Subsidiaries
The following table summarizes the changes in Level 3 assets measured at fair value on a recurring basis for the years ended December 31, 2015 and 2014.
|
| | | | | | | | | | | | | | | | | | | | | | | | |
| | | | Net Realized/Unrealized Gains (Losses) (Pretax) | | | | |
| | | | | | | |
| | Balance at Beginning of Period | | Recorded in Earnings | Recorded in Other Comprehensive Income (Loss) | | | | Balance at End of Period |
| | | | | | | | | |
| (in millions) | | Realized | Unrealized | | Sales | |
| Year Ended December 31, 2015 | | | | | | | | | | | | |
| Investment securities available-for-sale: | | | | | | | | | | | | |
| State and municipal securities (a) | $ | 23 |
| | $ | — |
| | $ | — |
| | $ | — |
| | | $ | (14 | ) | | $ | 9 |
|
| Corporate debt securities (a) | 1 |
| | — |
| | — |
| | — |
| | | — |
| | 1 |
|
| Equity and other non-debt securities (a) | 112 |
| | (2 | ) | (b) | — |
| | 1 |
| (c) | | (44 | ) | | 67 |
|
| Total investment securities
available-for-sale | 136 |
| | (2 | ) | (b) | — |
| | 1 |
| (c) | | (58 | ) | | 77 |
|
| Derivative assets: | | | | | | | | | | | | |
| Interest rate contracts | — |
| | — |
| | 9 |
| (d) | — |
| | | — |
| | 9 |
|
| Warrants | 4 |
| | 6 |
| (d) | (1 | ) | (d) | — |
| | | (7 | ) | | 2 |
|
| Year Ended December 31, 2014 | | | | | | | | | | | | |
| Investment securities available-for-sale: | | | | | | | | | | | | |
| State and municipal securities (a) | $ | 22 |
| | $ | — |
| | $ | — |
| | $ | 1 |
| (c) | | $ | — |
| | $ | 23 |
|
| Corporate debt securities (a) | 1 |
| | — |
| | — |
| | — |
| | | — |
| | 1 |
|
| Equity and other non-debt securities (a) | 136 |
| | 2 |
| (b) | — |
| | 7 |
| (c) | | (33 | ) | | 112 |
|
| Total investment securities
available-for-sale | 159 |
| | 2 |
| (b) | — |
| | 8 |
| (c) | | (33 | ) | | 136 |
|
| Derivative assets: | | | | | | | | | | | | |
| Warrants | 3 |
| | 7 |
| (d) | 1 |
| (d) | — |
| | | (7 | ) | | 4 |
|
| |
| (a) | Auction-rate securities. |
| |
| (b) | Realized and unrealized gains and losses due to changes in fair value recorded in "net securities losses" on the consolidated statements of income. |
| |
| (c) | Recorded in "net unrealized (losses) gains on investment securities available-for-sale" in other comprehensive income. |
| |
| (d) | Realized and unrealized gains and losses due to changes in fair value recorded in "other noninterest income" on the consolidated statements of income. |
NOTES TO CONSOLIDATED FINANCIAL STATEMENTS
Comerica Incorporated and Subsidiaries
ASSETS AND LIABILITIES RECORDED AT FAIR VALUE ON A NONRECURRING BASIS
The Corporation may be required, from time to time, to record certain assets and liabilities at fair value on a nonrecurring basis. These include assets that are recorded at the lower of cost or fair value, and were recognized at fair value since it was less than cost at the end of the period. The following table presents assets recorded at fair value on a nonrecurring basis at December 31, 2015 and 2014. No liabilities were recorded at fair value on a nonrecurring basis at December 31, 2015 and 2014.
|
| | | | | | | | | | | |
| (in millions) | Total | | Level 2 | | Level 3 |
| December 31, 2015 | | | | | |
| Loans held-for-sale: | | | | | |
| Commercial | $ | 8 |
| | $ | 8 |
| | $ | — |
|
| Loans: | | | | | |
| Commercial | 134 |
| | — |
| | 134 |
|
| Commercial mortgage | 11 |
| | — |
| | 11 |
|
| International | 8 |
| | — |
| | 8 |
|
| Total loans | 153 |
| | — |
| | 153 |
|
| Nonmarketable equity securities | 1 |
| | — |
| | 1 |
|
| Other real estate | 2 |
| | — |
| | 2 |
|
| Total assets at fair value | $ | 164 |
| | $ | 8 |
| | $ | 156 |
|
| December 31, 2014 | | | | | |
| Loans: | | | | | |
| Commercial | $ | 38 |
| | $ | — |
| | $ | 38 |
|
| Commercial mortgage | 26 |
| | — |
| | 26 |
|
| Total loans | 64 |
| | — |
| | 64 |
|
| Nonmarketable equity securities | 2 |
| | — |
| | 2 |
|
| Other real estate | 2 |
| | — |
| | 2 |
|
| Total assets at fair value | $ | 68 |
| | $ | — |
| | $ | 68 |
|
Level 3 assets recorded at fair value on a nonrecurring basis at December 31, 2015 and 2014 included loans for which a specific allowance was established based on the fair value of collateral and other real estate for which fair value of the properties was less than the cost basis. For both asset classes, the unobservable inputs were the additional adjustments applied by management to the appraised values to reflect such factors as non-current appraisals and revisions to estimated time to sell. These adjustments are determined based on qualitative judgments made by management on a case-by-case basis and are not quantifiable inputs, although they are used in the determination of fair value.
The following table presents quantitative information related to the significant unobservable inputs utilized in the Corporation's Level 3 recurring fair value measurement as of December 31, 2015 and December 31, 2014. The Corporation's Level 3 recurring fair value measurements include auction-rate securities where fair value is determined using an income approach based on a discounted cash flow model. The inputs in the table below reflect management's expectation of continued illiquidity in the secondary auction-rate securities market due to a lack of market activity for the issuers remaining in the portfolio, a lack of market incentives for issuer redemptions, and the expectation for a continuing low interest rate environment. The December 31, 2015 workout periods reflect management's expectation of the pace at which short-term interest rates could rise.
|
| | | | | | | |
| | | | Discounted Cash Flow Model |
| | | | Unobservable Input |
| | Fair Value (in millions) | | Discount Rate | | Workout Period (in years) |
| December 31, 2015 | | | | | |
| State and municipal securities (a) | $ | 9 |
| | 3% - 8% | | 1 - 2 |
| Equity and other non-debt securities (a) | 67 |
| | 4% - 9% | | 1 |
| December 31, 2014 | | | | | |
| State and municipal securities (a) | $ | 23 |
| | 3% - 9% | | 1 - 3 |
| Equity and other non-debt securities (a) | 112 |
| | 4% - 8% | | 1 - 2 |
| |
| (a) | Auction-rate securities. |
NOTES TO CONSOLIDATED FINANCIAL STATEMENTS
Comerica Incorporated and Subsidiaries
ESTIMATED FAIR VALUES OF FINANCIAL INSTRUMENTS NOT RECORDED AT FAIR VALUE ON A RECURRING BASIS
The Corporation typically holds the majority of its financial instruments until maturity and thus does not expect to realize many of the estimated fair value amounts disclosed. The disclosures also do not include estimated fair value amounts for items that are not defined as financial instruments, but which have significant value. These include such items as core deposit intangibles, the future earnings potential of significant customer relationships and the value of trust operations and other fee generating businesses. The Corporation believes the imprecision of an estimate could be significant.
The carrying amount and estimated fair value of financial instruments not recorded at fair value in their entirety on a recurring basis on the Corporation's consolidated balance sheets are as follows:
|
| | | | | | | | | | | | | | | | | | | |
| | Carrying Amount | | Estimated Fair Value |
| (in millions) | | Total | | Level 1 | | Level 2 | | Level 3 |
| December 31, 2015 | | | | | | | | | |
| Assets | | | | | | | | | |
| Cash and due from banks | $ | 1,157 |
| | $ | 1,157 |
| | $ | 1,157 |
| | $ | — |
| | $ | — |
|
| Interest-bearing deposits with banks | 4,990 |
| | 4,990 |
| | 4,990 |
| | — |
| | — |
|
| Investment securities held-to-maturity | 1,981 |
| | 1,973 |
| | — |
| | 1,973 |
| | — |
|
| Loans held-for-sale (a) | 21 |
| | 21 |
| | — |
| | 21 |
| | — |
|
| Total loans, net of allowance for loan losses (b) | 48,450 |
| | 48,269 |
| | — |
| | — |
| | 48,269 |
|
| Customers' liability on acceptances outstanding | 5 |
| | 5 |
| | 5 |
| | — |
| | — |
|
| Nonmarketable equity securities (c) | 10 |
| | 18 |
| | — |
| | — |
| | 18 |
|
| Restricted equity investments | 92 |
| | 92 |
| | 92 |
| | — |
| | — |
|
| Liabilities | | | | | | | | | |
| Demand deposits (noninterest-bearing) | 30,839 |
| | 30,839 |
| | — |
| | 30,839 |
| | — |
|
| Interest-bearing deposits | 25,462 |
| | 25,462 |
| | — |
| | 25,462 |
| | — |
|
| Customer certificates of deposit | 3,552 |
| | 3,536 |
| | — |
| | 3,536 |
| | — |
|
| Total deposits | 59,853 |
| | 59,837 |
| | — |
| | 59,837 |
| | — |
|
| Short-term borrowings | 23 |
| | 23 |
| | 23 |
| | — |
| | — |
|
| Acceptances outstanding | 5 |
| | 5 |
| | 5 |
| | — |
| | — |
|
| Medium- and long-term debt | 3,058 |
| | 3,032 |
| | — |
| | 3,032 |
| | — |
|
| Credit-related financial instruments | (83 | ) | | (83 | ) | | — |
| | — |
| | (83 | ) |
| December 31, 2014 | | | | | | | | | |
| Assets | | | | | | | | | |
| Cash and due from banks | $ | 1,026 |
| | $ | 1,026 |
| | $ | 1,026 |
| | $ | — |
| | $ | — |
|
| Interest-bearing deposits with banks | 5,045 |
| | 5,045 |
| | 5,045 |
| | — |
| | — |
|
| Investment securities held-to-maturity | 1,935 |
| | 1,933 |
| | — |
| | 1,933 |
| | — |
|
| Loans held-for-sale (a) | 5 |
| | 5 |
| | — |
| | 5 |
| | — |
|
| Total loans, net of allowance for loan losses (b) | 47,999 |
| | 47,932 |
| | — |
| | — |
| | 47,932 |
|
| Customers' liability on acceptances outstanding | 10 |
| | 10 |
| | 10 |
| | — |
| | — |
|
| Nonmarketable equity securities (c) | 11 |
| | 18 |
| | — |
| | — |
| | 18 |
|
| Restricted equity investments | 92 |
| | 92 |
| | 92 |
| | — |
| | — |
|
| Liabilities | | | | | | | | | |
| Demand deposits (noninterest-bearing) | 27,224 |
| | 27,224 |
| | — |
| | 27,224 |
| | — |
|
| Interest-bearing deposits | 25,841 |
| | 25,841 |
| | — |
| | 25,841 |
| | — |
|
| Customer certificates of deposit | 4,421 |
| | 4,411 |
| | — |
| | 4,411 |
| | — |
|
| Total deposits | 57,486 |
| | 57,476 |
| | — |
| | 57,476 |
| | — |
|
| Short-term borrowings | 116 |
| | 116 |
| | 116 |
| | — |
| | — |
|
| Acceptances outstanding | 10 |
| | 10 |
| | 10 |
| | — |
| | — |
|
| Medium- and long-term debt | 2,675 |
| | 2,681 |
| | — |
| | 2,681 |
| | — |
|
| Credit-related financial instruments | (85 | ) | | (85 | ) | | — |
| | — |
| | (85 | ) |
| |
| (a) | Included $8 million and no impaired loans held-for-sale recorded at fair value on a nonrecurring basis at December 31, 2015 and 2014, respectively. |
| |
| (b) | Included $153 million and $64 million of impaired loans recorded at fair value on a nonrecurring basis at December 31, 2015 and 2014, respectively. |
| |
| (c) | Included $1 million and $2 million of nonmarketable equity securities recorded at fair value on a nonrecurring basis at December 31, 2015 and 2014, respectively. |
NOTES TO CONSOLIDATED FINANCIAL STATEMENTS
Comerica Incorporated and Subsidiaries
NOTE 3 - INVESTMENT SECURITIES
A summary of the Corporation's investment securities follows:
|
| | | | | | | | | | | | | | | |
| (in millions) | Amortized Cost | | Gross Unrealized Gains | | Gross Unrealized Losses | | Fair Value |
| December 31, 2015 | | | | | | | |
| Investment securities available-for-sale: | | | | | | | |
| U.S. Treasury and other U.S. government agency securities | $ | 2,769 |
| | $ | 1 |
| | $ | 7 |
| | $ | 2,763 |
|
| Residential mortgage-backed securities (a) | 7,513 |
| | 76 |
| | 44 |
| | 7,545 |
|
| State and municipal securities | 9 |
| | — |
| | — |
| | 9 |
|
| Corporate debt securities | 1 |
| | — |
| | — |
| | 1 |
|
| Equity and other non-debt securities | 199 |
| | 2 |
| | — |
| | 201 |
|
| Total investment securities available-for-sale (b) | $ | 10,491 |
| | $ | 79 |
| | $ | 51 |
| | $ | 10,519 |
|
| | | | | | | | |
| Investment securities held-to-maturity (c): | | | | | | | |
| Residential mortgage-backed securities (a) | $ | 1,981 |
| | $ | 2 |
| | $ | 10 |
| | $ | 1,973 |
|
| | | | | | | | |
| December 31, 2014 | | | | | | | |
| Investment securities available-for-sale: | | | | | | | |
| U.S. Treasury and other U.S. government agency securities | $ | 526 |
| | $ | — |
| | $ | — |
| | $ | 526 |
|
| Residential mortgage-backed securities (a) | 7,192 |
| | 122 |
| | 40 |
| | 7,274 |
|
| State and municipal securities | 24 |
| | — |
| | 1 |
| | 23 |
|
| Corporate debt securities | 51 |
| | — |
| | — |
| | 51 |
|
| Equity and other non-debt securities | 242 |
| | 1 |
| | 1 |
| | 242 |
|
| Total investment securities available-for-sale (b) | $ | 8,035 |
| | $ | 123 |
| | $ | 42 |
| | $ | 8,116 |
|
| | | | | | | | |
| Investment securities held-to-maturity (c): | | | | | | | |
| Residential mortgage-backed securities (a) | $ | 1,935 |
| | $ | — |
| | $ | 2 |
| | $ | 1,933 |
|
| |
| (a) | Issued and/or guaranteed by U.S. government agencies or U.S. government-sponsored enterprises. |
| |
| (b) | Included auction-rate securities at amortized cost and fair value of $76 million and $77 million, respectively, as of December 31, 2015 and $137 million and $136 million, respectively, as of December 31, 2014. |
| |
| (c) | The amortized cost of investment securities held-to-maturity included net unrealized losses of $15 million at December 31, 2015 and $23 million at December 31, 2014 related to securities transferred from available-for-sale, which are included in accumulated other comprehensive loss. |
During the fourth quarter 2014, the Corporation transferred residential mortgage-backed securities with a fair value of approximately $2.0 billion from available-for-sale to held-to-maturity. Accumulated other comprehensive loss included pretax net unrealized losses of $23 million at the date of transfer.
NOTES TO CONSOLIDATED FINANCIAL STATEMENTS
Comerica Incorporated and Subsidiaries
A summary of the Corporation's investment securities in an unrealized loss position as of December 31, 2015 and 2014 follows:
|
| | | | | | | | | | | | | | | | | | | | | | | | | | |
| | Temporarily Impaired |
| | Less than 12 Months | | 12 Months or more | | Total |
| (in millions) | Fair Value | | Unrealized Losses | | Fair Value | | Unrealized Losses | | Fair Value | | Unrealized Losses |
| December 31, 2015 | | | | | | | | | | | | | | |
| U.S. Treasury and other U.S. government agency securities | $ | 2,265 |
| | $ | 7 |
| | | $ | — |
| | $ | — |
| | | $ | 2,265 |
| | $ | 7 |
| |
| Residential mortgage-backed securities (a) | 2,665 |
| | 21 |
| | | 1,976 |
| | 51 |
| | | 4,641 |
| | 72 |
| |
| State and municipal securities (b) | — |
| | — |
| | | 9 |
| | — |
| (c) | | 9 |
| | — |
| (c) |
| Corporate debt securities (b) | — |
| | — |
| | | 1 |
| | — |
| (c) | | 1 |
| | — |
| (c) |
| Equity and other non-debt securities (b) | 14 |
| | — |
| (c) | | — |
| | — |
| | | 14 |
| | — |
| (c) |
| Total impaired securities | $ | 4,944 |
| | $ | 28 |
| | | $ | 1,986 |
|
| $ | 51 |
| | | $ | 6,930 |
| | $ | 79 |
| |
| December 31, 2014 | | | | | | | | | | | | | | |
| U.S. Treasury and other U.S. government agency securities | $ | 298 |
| | $ | — |
| (c) | | $ | — |
| | $ | — |
| | | $ | 298 |
| | $ | — |
| (c) |
| Residential mortgage-backed securities (a) | 626 |
| | 3 |
| | | 3,112 |
| | 71 |
| | | 3,738 |
| | 74 |
| |
| State and municipal securities (b) | — |
| | — |
| | | 22 |
| | 1 |
| | | 22 |
| | 1 |
| |
| Corporate debt securities (b) | — |
| | — |
| | | 1 |
| | — |
| (c) | | 1 |
| | — |
| (c) |
| Equity and other non-debt securities (b) | — |
| | — |
| | | 112 |
| | 1 |
| | | 112 |
| | 1 |
| |
| Total impaired securities | $ | 924 |
| | $ | 3 |
| | | $ | 3,247 |
| | $ | 73 |
| | | $ | 4,171 |
| | $ | 76 |
| |
| |
| (a) | Issued and/or guaranteed by U.S. government agencies or U.S. government-sponsored enterprises. |
| |
| (b) | Primarily auction-rate securities. |
| |
| (c) | Unrealized losses less than $0.5 million. |
At December 31, 2015, the Corporation had 179 securities in an unrealized loss position with no credit impairment, including 26 U.S. Treasury securities, 124 residential mortgage-backed securities, 16 state and municipal auction-rate securities, one corporate auction-rate debt security and 12 equity and other non-debt auction-rate preferred securities. As of December 31, 2015, approximately 94 percent of the aggregate par value of auction-rate securities have been redeemed or sold since acquisition, of which approximately 91 percent were redeemed at or above cost. The unrealized losses for these securities resulted from changes in market interest rates and liquidity. The Corporation ultimately expects full collection of the carrying amount of these securities, does not intend to sell the securities in an unrealized loss position, and it is not more-likely-than-not that the Corporation will be required to sell the securities in an unrealized loss position prior to recovery of amortized cost. The Corporation does not consider these securities to be other-than-temporarily impaired at December 31, 2015.
Sales, calls and write-downs of investment securities available-for-sale resulted in the following gains and losses recorded in "net securities losses" on the consolidated statements of income, computed based on the adjusted cost of the specific security.
|
| | | | | | | | | | | | | | |
| (in millions) | | | | | | | | |
| Years Ended December 31 | 2015 | | 2014 | | 2013 |
| Securities gains | $ | — |
| | | $ | 2 |
| | | $ | 1 |
| |
| Securities losses | (2 | ) | | | (2 | ) | | | (2 | ) | |
| Net securities losses | $ | (2 | ) | | | $ | — |
| | | $ | (1 | ) | |
The following table summarizes the amortized cost and fair values of debt securities by contractual maturity. Securities with multiple maturity dates are classified in the period of final maturity. Expected maturities will differ from contractual maturities because borrowers may have the right to call or prepay obligations with or without call or prepayment penalties.
NOTES TO CONSOLIDATED FINANCIAL STATEMENTS
Comerica Incorporated and Subsidiaries
|
| | | | | | | | | | | | | | |
| (in millions) | Available-for-sale | Held-to-maturity |
| December 31, 2015 | Amortized Cost | | Fair Value | Amortized Cost | | Fair Value |
| Contractual maturity | | | | | | |
| Within one year | $ | 10 |
| | $ | 10 |
| $ | — |
| | $ | — |
|
| After one year through five years | 2,857 |
| | 2,851 |
| — |
| | — |
|
| After five years through ten years | 1,268 |
| | 1,308 |
| — |
| | — |
|
| After ten years | 6,157 |
| | 6,149 |
| 1,981 |
| | 1,973 |
|
| Subtotal | 10,292 |
| | 10,318 |
| 1,981 |
| | 1,973 |
|
| Equity and other non-debt securities | 199 |
| | 201 |
| — |
| | — |
|
| Total investment securities | $ | 10,491 |
| | $ | 10,519 |
| $ | 1,981 |
| | $ | 1,973 |
|
Included in the contractual maturity distribution in the table above were residential mortgage-backed securities available-for-sale with a total amortized cost and fair value of $7.5 billion, and residential mortgage-backed securities held-to-maturity with a total amortized cost and fair value of $2.0 billion. The actual cash flows of mortgage-backed securities may differ from contractual maturity as the borrowers of the underlying loans may exercise prepayment options.
At December 31, 2015, investment securities with a carrying value of $2.4 billion were pledged where permitted or required by law to secure $1.2 billion of liabilities, primarily public and other deposits of state and local government agencies and derivative instruments.
NOTES TO CONSOLIDATED FINANCIAL STATEMENTS
Comerica Incorporated and Subsidiaries
NOTE 4 – CREDIT QUALITY AND ALLOWANCE FOR CREDIT LOSSES
The following table presents an aging analysis of the recorded balance of loans.
|
| | | | | | | | | | | | | | | | | | | | | | | | | | | |
| | Loans Past Due and Still Accruing | | | | | | |
| (in millions) | 30-59 Days | | 60-89 Days | | 90 Days or More | | Total | | Nonaccrual Loans | | Current Loans | | Total Loans |
| December 31, 2015 | | | | | | | | | | | | | |
| Business loans: | | | | | | | | | | | | | |
| Commercial | $ | 46 |
| | $ | 12 |
| | $ | 13 |
| | $ | 71 |
| | $ | 238 |
| | $ | 31,350 |
| | $ | 31,659 |
|
| Real estate construction: | | | | | | | | | | | | | |
| Commercial Real Estate business line (a) | 5 |
| | — |
| | — |
| | 5 |
| | — |
| | 1,676 |
| | 1,681 |
|
| Other business lines (b) | 3 |
| | — |
| | — |
| | 3 |
| | 1 |
| | 316 |
| | 320 |
|
| Total real estate construction | 8 |
| | — |
| | — |
| | 8 |
| | 1 |
| | 1,992 |
| | 2,001 |
|
| Commercial mortgage: | | | | | | | | | | | | | |
| Commercial Real Estate business line (a) | 7 |
| | — |
| | 1 |
| | 8 |
| | 16 |
| | 2,080 |
| | 2,104 |
|
| Other business lines (b) | 7 |
| | 5 |
| | 3 |
| | 15 |
| | 44 |
| | 6,814 |
| | 6,873 |
|
| Total commercial mortgage | 14 |
| | 5 |
| | 4 |
| | 23 |
| | 60 |
| | 8,894 |
| | 8,977 |
|
| Lease financing | — |
| | — |
| | — |
| | — |
| | 6 |
| | 718 |
| | 724 |
|
| International | 2 |
| | — |
| | — |
| | 2 |
| | 8 |
| | 1,358 |
| | 1,368 |
|
| Total business loans | 70 |
| | 17 |
| | 17 |
| | 104 |
| | 313 |
| | 44,312 |
| | 44,729 |
|
| Retail loans: | | | | | | | | | | | | | |
| Residential mortgage | 26 |
| | 1 |
| | — |
| | 27 |
| | 27 |
| | 1,816 |
| | 1,870 |
|
| Consumer: | | | | | | | | | | | | | |
| Home equity | 5 |
| | 3 |
| | — |
| | 8 |
| | 27 |
| | 1,685 |
| | 1,720 |
|
| Other consumer | 7 |
| | — |
| | — |
| | 7 |
| | — |
| | 758 |
| | 765 |
|
| Total consumer | 12 |
| | 3 |
| | — |
| | 15 |
| | 27 |
| | 2,443 |
| | 2,485 |
|
| Total retail loans | 38 |
| | 4 |
| | — |
| | 42 |
| | 54 |
| | 4,259 |
| | 4,355 |
|
| Total loans | $ | 108 |
| | $ | 21 |
| | $ | 17 |
| | $ | 146 |
| | $ | 367 |
| | $ | 48,571 |
| | $ | 49,084 |
|
| December 31, 2014 | | | | | | | | | | | | | |
| Business loans: | | | | | | | | | | | | | |
| Commercial | $ | 58 |
| | $ | 13 |
| | $ | 1 |
| | $ | 72 |
| | $ | 109 |
| | $ | 31,339 |
| | $ | 31,520 |
|
| Real estate construction: | | | | | | | | | | | | | |
| Commercial Real Estate business line (a) | 3 |
| | — |
| | — |
| | 3 |
| | 1 |
| | 1,602 |
| | 1,606 |
|
| Other business lines (b) | 12 |
| | — |
| | — |
| | 12 |
| | 1 |
| | 336 |
| | 349 |
|
| Total real estate construction | 15 |
| | — |
| | — |
| | 15 |
| | 2 |
| | 1,938 |
| | 1,955 |
|
| Commercial mortgage: | | | | | | | | | | | | | |
| Commercial Real Estate business line (a) | 8 |
| | 1 |
| | 1 |
| | 10 |
| | 22 |
| | 1,758 |
| | 1,790 |
|
| Other business lines (b) | 16 |
| | 12 |
| | 2 |
| | 30 |
| | 73 |
| | 6,711 |
| | 6,814 |
|
| Total commercial mortgage | 24 |
| | 13 |
| | 3 |
| | 40 |
| | 95 |
| | 8,469 |
| | 8,604 |
|
| Lease financing | — |
| | — |
| | — |
| | — |
| | — |
| | 805 |
| | 805 |
|
| International | 9 |
| | — |
| | — |
| | 9 |
| | — |
| | 1,487 |
| | 1,496 |
|
| Total business loans | 106 |
| | 26 |
| | 4 |
| | 136 |
| | 206 |
| | 44,038 |
| | 44,380 |
|
| Retail loans: | | | | | | | | | | | | | |
| Residential mortgage | 9 |
| | 2 |
| | — |
| | 11 |
| | 36 |
| | 1,784 |
| | 1,831 |
|
| Consumer: | | | | | | | | | | | | | |
| Home equity | 5 |
| | 3 |
| | — |
| | 8 |
| | 30 |
| | 1,620 |
| | 1,658 |
|
| Other consumer | 12 |
| | — |
| | 1 |
| | 13 |
| | 1 |
| | 710 |
| | 724 |
|
| Total consumer | 17 |
| | 3 |
| | 1 |
| | 21 |
| | 31 |
| | 2,330 |
| | 2,382 |
|
| Total retail loans | 26 |
| | 5 |
| | 1 |
| | 32 |
| | 67 |
| | 4,114 |
| | 4,213 |
|
| Total loans | $ | 132 |
| | $ | 31 |
| | $ | 5 |
| | $ | 168 |
| | $ | 273 |
| | $ | 48,152 |
| | $ | 48,593 |
|
| |
| (a) | Primarily loans to real estate developers. |
| |
| (b) | Primarily loans secured by owner-occupied real estate. |
NOTES TO CONSOLIDATED FINANCIAL STATEMENTS
Comerica Incorporated and Subsidiaries
The following table presents loans by credit quality indicator, based on internal risk ratings assigned to each business loan at the time of approval and subjected to subsequent reviews, generally at least annually, and to pools of retail loans with similar risk characteristics.
|
| | | | | | | | | | | | | | | | | | | |
| | Internally Assigned Rating | | |
| (in millions) | Pass (a) | | Special Mention (b) | | Substandard (c) | | Nonaccrual (d) | | Total |
| December 31, 2015 | | | | | | | | | |
| Business loans: | | | | | | | | | |
| Commercial | $ | 29,117 |
| | $ | 1,293 |
| | $ | 1,011 |
| | $ | 238 |
| | $ | 31,659 |
|
| Real estate construction: | | | | | | | | | |
| Commercial Real Estate business line (e) | 1,681 |
| | — |
| | — |
| | — |
| | 1,681 |
|
| Other business lines (f) | 318 |
| | 1 |
| | — |
| | 1 |
| | 320 |
|
| Total real estate construction | 1,999 |
| | 1 |
| | — |
| | 1 |
| | 2,001 |
|
| Commercial mortgage: | | | | | | | | | |
| Commercial Real Estate business line (e) | 2,031 |
| | 31 |
| | 26 |
| | 16 |
| | 2,104 |
|
| Other business lines (f) | 6,536 |
| | 172 |
| | 121 |
| | 44 |
| | 6,873 |
|
| Total commercial mortgage | 8,567 |
| | 203 |
| | 147 |
| | 60 |
| | 8,977 |
|
| Lease financing | 693 |
| | 17 |
| | 8 |
| | 6 |
| | 724 |
|
| International | 1,245 |
| | 59 |
| | 56 |
| | 8 |
| | 1,368 |
|
| Total business loans | 41,621 |
| | 1,573 |
| | 1,222 |
| | 313 |
| | 44,729 |
|
| Retail loans: | | | | | | | | | |
| Residential mortgage | 1,828 |
| | 2 |
| | 13 |
| | 27 |
| | 1,870 |
|
| Consumer: | | | | | | | | | |
| Home equity | 1,687 |
| | 1 |
| | 5 |
| | 27 |
| | 1,720 |
|
| Other consumer | 755 |
| | 3 |
| | 7 |
| | — |
| | 765 |
|
| Total consumer | 2,442 |
| | 4 |
| | 12 |
| | 27 |
| | 2,485 |
|
| Total retail loans | 4,270 |
| | 6 |
| | 25 |
| | 54 |
| | 4,355 |
|
| Total loans | $ | 45,891 |
| | $ | 1,579 |
| | $ | 1,247 |
| | $ | 367 |
| | $ | 49,084 |
|
| December 31, 2014 | | | | | | | | | |
| Business loans: | | | | | | | | | |
| Commercial | $ | 30,310 |
| | $ | 560 |
| | $ | 541 |
| | $ | 109 |
| | $ | 31,520 |
|
| Real estate construction: | | | | | | | | | |
| Commercial Real Estate business line (e) | 1,594 |
| | 11 |
| | — |
| | 1 |
| | 1,606 |
|
| Other business lines (f) | 336 |
| | 7 |
| | 5 |
| | 1 |
| | 349 |
|
| Total real estate construction | 1,930 |
| | 18 |
| | 5 |
| | 2 |
| | 1,955 |
|
| Commercial mortgage: | | | | | | | | | |
| Commercial Real Estate business line (e) | 1,652 |
| | 69 |
| | 47 |
| | 22 |
| | 1,790 |
|
| Other business lines (f) | 6,434 |
| | 138 |
| | 169 |
| | 73 |
| | 6,814 |
|
| Total commercial mortgage | 8,086 |
| | 207 |
| | 216 |
| | 95 |
| | 8,604 |
|
| Lease financing | 778 |
| | 26 |
| | 1 |
| | — |
| | 805 |
|
| International | 1,468 |
| | 15 |
| | 13 |
| | — |
| | 1,496 |
|
| Total business loans | 42,572 |
| | 826 |
| | 776 |
| | 206 |
| | 44,380 |
|
| Retail loans: | | | | | | | | | |
| Residential mortgage | 1,790 |
| | 2 |
| | 3 |
| | 36 |
| | 1,831 |
|
| Consumer: | | | | | | | | | |
| Home equity | 1,620 |
| | — |
| | 8 |
| | 30 |
| | 1,658 |
|
| Other consumer | 718 |
| | 3 |
| | 2 |
| | 1 |
| | 724 |
|
| Total consumer | 2,338 |
| | 3 |
| | 10 |
| | 31 |
| | 2,382 |
|
| Total retail loans | 4,128 |
| | 5 |
| | 13 |
| | 67 |
| | 4,213 |
|
| Total loans | $ | 46,700 |
| | $ | 831 |
| | $ | 789 |
| | $ | 273 |
| | $ | 48,593 |
|
| |
| (a) | Includes all loans not included in the categories of special mention, substandard or nonaccrual. |
| |
| (b) | Special mention loans are accruing loans that have potential credit weaknesses that deserve management's close attention, such as loans to borrowers who may be experiencing financial difficulties that may result in deterioration of repayment prospects from the borrower at some future date. This category is generally consistent with the "special mention" category as defined by regulatory authorities. |
| |
| (c) | Substandard loans are accruing loans that have a well-defined weakness, or weaknesses, such as loans to borrowers who may be experiencing losses from operations or inadequate liquidity of a degree and duration that jeopardizes the orderly repayment of the loan. Substandard loans also are distinguished by the distinct possibility of loss in the future if these weaknesses are not corrected. PCI loans are included in the substandard category. This category is generally consistent with the "substandard" category as defined by regulatory authorities. |
| |
| (d) | Nonaccrual loans are loans for which the accrual of interest has been discontinued. For further information regarding nonaccrual loans, refer to the Nonperforming Assets subheading in Note 1 - Basis of Presentation and Accounting Policies. A significant majority of nonaccrual loans are generally consistent with the "substandard" category and the remainder are generally consistent with the "doubtful" category as defined by regulatory authorities. |
| |
| (e) | Primarily loans to real estate developers. |
| |
| (f) | Primarily loans secured by owner-occupied real estate. |
NOTES TO CONSOLIDATED FINANCIAL STATEMENTS
Comerica Incorporated and Subsidiaries
The following table summarizes nonperforming assets.
|
| | | | | | | |
| (in millions) | December 31, 2015 | | December 31, 2014 |
| Nonaccrual loans | $ | 367 |
| | $ | 273 |
|
| Reduced-rate loans (a) | 12 |
| | 17 |
|
| Total nonperforming loans | 379 |
| | 290 |
|
| Foreclosed property | 12 |
| | 10 |
|
| Total nonperforming assets | $ | 391 |
| | $ | 300 |
|
| |
| (a) | There were no reduced-rate business loans at both December 31, 2015 and at December 31, 2014. Reduced-rate retail loans totaled $12 million and $17 million at December 31, 2015 and 2014, respectively. |
Nonaccrual loans included retail loans secured by residential real estate properties in process of foreclosure of $1 million at December 31, 2015.
Allowance for Credit Losses
The following table details the changes in the allowance for loan losses and related loan amounts.
|
| | | | | | | | | | | | | | | | | | | | | | | | | | | | | | | | |
| | 2015 | | 2014 | | 2013 |
| (in millions) | Business Loans | Retail Loans | | Total | | Business Loans | Retail Loans | | Total | | Business Loans | Retail Loans | | Total |
| | | | | | | | | | | | | | | |
| Years Ended December 31 | | | | | | | | | | | | | | |
| Allowance for loan losses: | | | | | | | | | | | | | | |
| Balance at beginning of period | $ | 534 |
| $ | 60 |
| | $ | 594 |
| | $ | 531 |
| $ | 67 |
| | $ | 598 |
| | $ | 552 |
| $ | 77 |
| | $ | 629 |
|
| Loan charge-offs | (157 | ) | (11 | ) | | (168 | ) | | (87 | ) | (15 | ) | | (102 | ) | | (130 | ) | (23 | ) | | (153 | ) |
| Recoveries on loans previously charged-off | 55 |
| 13 |
| | 68 |
| | 68 |
| 9 |
| | 77 |
| | 70 |
| 10 |
| | 80 |
|
| Net loan (charge-offs) recoveries | (102 | ) | 2 |
| | (100 | ) | | (19 | ) | (6 | ) | | (25 | ) | | (60 | ) | (13 | ) | | (73 | ) |
| Provision for loan losses | 149 |
| (7 | ) | | 142 |
| | 23 |
| (1 | ) | | 22 |
| | 39 |
| 3 |
| | 42 |
|
| Foreign currency translation adjustment | (2 | ) | — |
| | (2 | ) | | (1 | ) | — |
| | (1 | ) | | — |
| — |
| | — |
|
| Balance at end of period | $ | 579 |
| $ | 55 |
| | $ | 634 |
| | $ | 534 |
| $ | 60 |
| | $ | 594 |
| | $ | 531 |
| $ | 67 |
| | $ | 598 |
|
| | | | | | | | | | | | | | | |
| As a percentage of total loans | 1.30 | % | 1.26 | % | | 1.29 | % | | 1.20 | % | 1.43 | % | | 1.22 | % | | 1.28 | % | 1.70 | % | | 1.32 | % |
| | | | | | | | | | | | | | | |
| December 31 | | | | | | | | | | | | | | |
| Allowance for loan losses: | | | | | | | | | | | | | | |
| Individually evaluated for impairment | $ | 53 |
| $ | — |
| | $ | 53 |
| | $ | 39 |
| $ | — |
| | $ | 39 |
| | $ | 57 |
| $ | — |
| | $ | 57 |
|
| Collectively evaluated for impairment | 526 |
| 55 |
| | 581 |
| | 495 |
| 60 |
| | 555 |
| | 474 |
| 67 |
| | 541 |
|
| Total allowance for loan losses | $ | 579 |
| $ | 55 |
| | $ | 634 |
| | $ | 534 |
| $ | 60 |
| | $ | 594 |
| | $ | 531 |
| $ | 67 |
| | $ | 598 |
|
| Loans: | | | | | | | | | | | | | | |
| Individually evaluated for impairment | $ | 393 |
| $ | 31 |
| | $ | 424 |
| | $ | 177 |
| $ | 42 |
| | $ | 219 |
| | $ | 223 |
| $ | 51 |
| | $ | 274 |
|
| Collectively evaluated for impairment | 44,336 |
| 4,323 |
| | 48,659 |
| | 44,203 |
| 4,169 |
| | 48,372 |
| | 41,311 |
| 3,880 |
| | 45,191 |
|
| PCI loans (a) | — |
| 1 |
| | 1 |
| | — |
| 2 |
| | 2 |
| | 2 |
| 3 |
| | 5 |
|
| Total loans evaluated for impairment | $ | 44,729 |
| $ | 4,355 |
| | $ | 49,084 |
| | $ | 44,380 |
| $ | 4,213 |
| | $ | 48,593 |
| | $ | 41,536 |
| $ | 3,934 |
| | $ | 45,470 |
|
(a) No allowance for loan losses was required for PCI loans at December 31, 2015, 2014 and 2013.
NOTES TO CONSOLIDATED FINANCIAL STATEMENTS
Comerica Incorporated and Subsidiaries
Changes in the allowance for credit losses on lending-related commitments, included in "accrued expenses and other liabilities" on the consolidated balance sheets, are summarized in the following table.
|
| | | | | | | | | | | |
| (in millions) | | | | | |
| Years Ended December 31 | 2015 | | 2014 | | 2013 |
| Balance at beginning of period | $ | 41 |
| | $ | 36 |
| | $ | 32 |
|
| Charge-offs on lending-related commitments (a) | (1 | ) | | — |
| | — |
|
| Provision for credit losses on lending-related commitments | 5 |
| | 5 |
| | 4 |
|
| Balance at end of period | $ | 45 |
| | $ | 41 |
| | $ | 36 |
|
(a) Charge-offs result from the sale of unfunded lending-related commitments.
NOTES TO CONSOLIDATED FINANCIAL STATEMENTS
Comerica Incorporated and Subsidiaries
Individually Evaluated Impaired Loans
The following table presents additional information regarding individually evaluated impaired loans.
|
| | | | | | | | | | | | | | | | | | | |
| | Recorded Investment In: | | | | |
| (in millions) | Impaired Loans with No Related Allowance | | Impaired Loans with Related Allowance | | Total Impaired Loans | | Unpaid Principal Balance | | Related Allowance for Loan Losses |
| December 31, 2015 | | | | | | | | | |
| Business loans: | | | | | | | | | |
| Commercial | $ | 82 |
| | $ | 252 |
| | $ | 334 |
| | $ | 549 |
| | $ | 45 |
|
| Commercial mortgage: | | | | | | | | | |
| Commercial Real Estate business line (a) | 7 |
| | 8 |
| | 15 |
| | 38 |
| | 1 |
|
| Other business lines (b) | 2 |
| | 32 |
| | 34 |
| | 55 |
| | 5 |
|
| Total commercial mortgage | 9 |
| | 40 |
| | 49 |
| | 93 |
| | 6 |
|
| International | — |
| | 10 |
| | 10 |
| | 17 |
| | 2 |
|
| Total business loans | 91 |
| | 302 |
| | 393 |
| | 659 |
| | 53 |
|
| Retail loans: | | | | | | | | | |
| Residential mortgage | 13 |
| | — |
| | 13 |
| | 13 |
| | — |
|
| Consumer: | | | | | | | | | |
| Home equity | 12 |
| | — |
| | 12 |
| | 16 |
| | — |
|
| Other consumer | 6 |
| | — |
| | 6 |
| | 10 |
| | — |
|
| Total consumer | 18 |
| | — |
| | 18 |
| | 26 |
| | — |
|
| Total retail loans (c) | 31 |
| | — |
| | 31 |
| | 39 |
| | — |
|
| Total individually evaluated impaired loans | $ | 122 |
| | $ | 302 |
| | $ | 424 |
| | $ | 698 |
| | $ | 53 |
|
| December 31, 2014 | | | | | | | | | |
| Business loans: | | | | | | | | | |
| Commercial | $ | 7 |
| | $ | 103 |
| | $ | 110 |
| | $ | 148 |
| | $ | 29 |
|
| Real estate construction: | | | | | | | | | |
| Other business lines (b) | — |
| | 1 |
| | 1 |
| | 1 |
| | — |
|
| Commercial mortgage: | | | | | | | | | |
| Commercial Real Estate business line (a) | — |
| | 19 |
| | 19 |
| | 41 |
| | 8 |
|
| Other business lines (b) | 4 |
| | 43 |
| | 47 |
| | 63 |
| | 2 |
|
| Total commercial mortgage | 4 |
| | 62 |
| | 66 |
| | 104 |
| | 10 |
|
| Total business loans | 11 |
| | 166 |
| | 177 |
| | 253 |
| | 39 |
|
| Retail loans: | | | | | | | | | |
| Residential mortgage | 25 |
| | — |
| | 25 |
| | 28 |
| | — |
|
| Consumer: | | | | | | | | | |
| Home equity | 12 |
| | — |
| | 12 |
| | 16 |
| | — |
|
| Other consumer | 5 |
| | — |
| | 5 |
| | 7 |
| | — |
|
| Total consumer | 17 |
| | — |
| | 17 |
| | 23 |
| | — |
|
| Total retail loans (c) | 42 |
| | — |
| | 42 |
| | 51 |
| | — |
|
| Total individually evaluated impaired loans | $ | 53 |
| | $ | 166 |
| | $ | 219 |
| | $ | 304 |
| | $ | 39 |
|
| |
| (a) | Primarily loans to real estate developers. |
| |
| (b) | Primarily loans secured by owner-occupied real estate. |
| |
| (c) | Individually evaluated retail loans had no related allowance for loan losses, primarily due to policy which results in direct write-downs of restructured retail loans. |
NOTES TO CONSOLIDATED FINANCIAL STATEMENTS
Comerica Incorporated and Subsidiaries
The following table presents information regarding average individually evaluated impaired loans and the related interest recognized. Interest income recognized for the period primarily related to reduced-rate loans.
|
| | | | | | | | | | | | | | | | | | | | | | | |
| | Individually Evaluated Impaired Loans |
| | 2015 | | 2014 | | 2013 |
| (in millions) | Average Balance for the Period | | Interest Income Recognized for the Period | | Average Balance for the Period | | Interest Income Recognized for the Period | | Average Balance for the Period | | Interest Income Recognized for the Period |
| Years Ended December 31 | | | | | | | | | | | |
| Business loans: | | | | | | | | | | | |
| Commercial | $ | 206 |
| | $ | 5 |
| | $ | 77 |
| | $ | 2 |
| | $ | 99 |
| | $ | 2 |
|
| Real estate construction: | | | | | | | | | | | |
| Commercial Real Estate business line (a) | — |
| | — |
| | 14 |
| | — |
| | 25 |
| | — |
|
| Commercial mortgage: | | | | | | | | | | | |
| Commercial Real Estate business line (a) | 16 |
| | — |
| | 48 |
| | — |
| | 81 |
| | — |
|
| Other business lines (b) | 39 |
| | 1 |
| | 64 |
| | 2 |
| | 105 |
| | 3 |
|
| Total commercial mortgage | 55 |
| | 1 |
| | 112 |
| | 2 |
| | 186 |
| | 3 |
|
| International | 6 |
| | — |
| | 2 |
| | — |
| | 1 |
| | — |
|
| Total business loans | 267 |
| | 6 |
| | 205 |
| | 4 |
| | 311 |
| | 5 |
|
| Retail loans: | | | | | | | | | | | |
| Residential mortgage | 21 |
| | — |
| | 30 |
| | — |
| | 35 |
| | — |
|
| Consumer: | | | | | | | | | | | |
| Home equity | 12 |
| | — |
| | 12 |
| | — |
| | 8 |
| | — |
|
| Other consumer | 6 |
| | — |
| | 4 |
| | — |
| | 4 |
| | — |
|
| Total consumer | 18 |
| | — |
| | 16 |
| | — |
| | 12 |
| | — |
|
| Total retail loans | 39 |
| | — |
| | 46 |
| | — |
| | 47 |
| | — |
|
| Total individually evaluated impaired loans | $ | 306 |
| | $ | 6 |
| | $ | 251 |
| | $ | 4 |
| | $ | 358 |
| | $ | 5 |
|
| |
| (a) | Primarily loans to real estate developers. |
| |
| (b) | Primarily loans secured by owner-occupied real estate. |
NOTES TO CONSOLIDATED FINANCIAL STATEMENTS
Comerica Incorporated and Subsidiaries
Troubled Debt Restructurings
The following tables detail the recorded balance at December 31, 2015 and 2014 of loans considered to be TDRs that were restructured during the years ended December 31, 2015 and 2014, by type of modification. In cases of loans with more than one type of modification, the loans were categorized based on the most significant modification.
|
| | | | | | | | | | | | | | | | | | | | | |
| | 2015 | | 2014 |
| | Type of Modification | | | Type of Modification | |
| (in millions) | Principal Deferrals (a) | Interest Rate Reductions | Total Modifications | | Principal Deferrals (a) | Interest Rate Reductions | Total Modifications |
| Years Ended December 31 | | | | | | | | | |
| Business loans: | | | | | | | | | |
| Commercial | $ | 160 |
| | $ | — |
| $ | 160 |
| | $ | 22 |
| | $ | — |
| $ | 22 |
|
| Commercial mortgage: | | | | | | | | | |
| Commercial Real Estate business line (b) | 8 |
| | — |
| 8 |
| | — |
| | — |
| — |
|
| Other business lines (c) | 6 |
| | — |
| 6 |
| | 6 |
| | — |
| 6 |
|
| Total commercial mortgage | 14 |
| | — |
| 14 |
| | 6 |
| | — |
| 6 |
|
| International | 2 |
| | — |
| 2 |
| | — |
| | — |
| — |
|
| Total business loans | 176 |
| | — |
| 176 |
| | 28 |
| | — |
| 28 |
|
| Retail loans: | | | | | | | | | |
| Residential mortgage | — |
| | — |
| — |
| | 1 |
| (d) | — |
| 1 |
|
| Consumer: | | | | | | | | | |
| Home equity | 1 |
| (d) | 2 |
| 3 |
| | 1 |
| (d) | 3 |
| 4 |
|
| Other consumer | — |
| | — |
| — |
| | 1 |
| (d) | — |
| 1 |
|
| Total consumer | 1 |
| | 2 |
| 3 |
| | 2 |
| | 3 |
| 5 |
|
| Total retail loans | 1 |
| | 2 |
| 3 |
|
| 3 |
| | 3 |
| 6 |
|
| Total loans | $ | 177 |
| | $ | 2 |
| $ | 179 |
| | $ | 31 |
| | $ | 3 |
| $ | 34 |
|
| |
| (a) | Primarily represents loan balances where terms were extended 90 days or more at or above contractual interest rates. |
| |
| (b) | Primarily loans to real estate developers. |
| |
| (c) | Primarily loans secured by owner-occupied real estate. |
| |
| (d) | Includes bankruptcy loans for which the court has discharged the borrower's obligation and the borrower has not reaffirmed the debt. |
At December 31, 2015 and 2014, commitments to lend additional funds to borrowers whose terms have been modified in TDRs totaled $6 million and $3 million, respectively.
The majority of the modifications considered to be TDRs that occurred during the years ended December 31, 2015 and 2014 were principal deferrals. The Corporation charges interest on principal balances outstanding during deferral periods. Additionally, none of the modifications involved forgiveness of principal. As a result, the current and future financial effects of the recorded balance of loans considered to be TDRs that were restructured during the years ended December 31, 2015 and 2014 were insignificant.
On an ongoing basis, the Corporation monitors the performance of modified loans to their restructured terms. In the event of a subsequent default, the allowance for loan losses continues to be reassessed on the basis of an individual evaluation of the loan.
NOTES TO CONSOLIDATED FINANCIAL STATEMENTS
Comerica Incorporated and Subsidiaries
The following table presents information regarding the recorded balance at December 31, 2015 and 2014 of loans modified by principal deferral during the years ended December 31, 2015 and 2014, and those principal deferrals which experienced a subsequent default during the same periods. For principal deferrals, incremental deterioration in the credit quality of the loan, represented by a downgrade in the risk rating of the loan, for example, due to missed interest payments or a reduction of collateral value, is considered a subsequent default.
|
| | | | | | | | | | | | | | | |
| | 2015 | | 2014 |
| (in millions) | Balance at December 31 | Subsequent Default in the Year Ended December 31 | | Balance at December 31 | Subsequent Default in the Year Ended December 31 |
| Principal deferrals: | | | | | | | |
| Business loans: | | | | | | | |
| Commercial | $ | 160 |
| | $ | 16 |
| | $ | 22 |
| | $ | 1 |
|
| Commercial mortgage: | | | | | | | |
| Commercial Real Estate business line (a) | 8 |
| | 1 |
| | — |
| | — |
|
| Other business lines (b) | 6 |
| | 1 |
| | 6 |
| | 2 |
|
| Total commercial mortgage | 14 |
| | 2 |
| | 6 |
| | 2 |
|
| International | 2 |
| | — |
| | — |
| | — |
|
| Total business loans | 176 |
| | 18 |
| | 28 |
| | 3 |
|
| Retail loans: | | | | | | | |
| Residential mortgage | — |
| | — |
| | 1 |
| (c) | — |
|
| Consumer: | | | | | | | |
| Home equity | 1 |
| (c) | — |
| | 1 |
| (c) | — |
|
| Other consumer | — |
| | — |
| | 1 |
| (c) | — |
|
| Total consumer | 1 |
| | — |
| | 2 |
| | — |
|
| Total retail loans | 1 |
| | — |
| | 3 |
| | — |
|
| Total principal deferrals | $ | 177 |
| | $ | 18 |
| | $ | 31 |
| | $ | 3 |
|
| |
| (a) | Primarily loans to real estate developers. |
| |
| (b) | Primarily loans secured by owner-occupied real estate. |
| |
| (c) | Includes bankruptcy loans for which the court has discharged the borrower's obligation and the borrower has not reaffirmed the debt. |
During the years ended December 31, 2015 and 2014, loans with a carrying value of $2 million and $3 million at December 31, 2015 and 2014, respectively, were modified by interest rate reduction. For reduced-rate loans , a subsequent payment default is defined in terms of delinquency, when a principal or interest payment is 90 days past due. There were no subsequent payment defaults of reduced rate loans during the years ended December 31, 2015 and 2014.
NOTE 5 - SIGNIFICANT GROUP CONCENTRATIONS OF CREDIT RISK
Concentrations of credit risk may exist when a number of borrowers are engaged in similar activities, or activities in the same geographic region, and have similar economic characteristics that would cause them to be similarly impacted by changes in economic or other conditions. Concentrations of both on-balance sheet and off-balance sheet credit risk are controlled and monitored as part of credit policies. The Corporation is a regional financial services holding company with a geographic concentration of its on-balance-sheet and off-balance-sheet activities in Michigan, California and Texas.
As outlined below, the Corporation has a concentration of credit risk with the automotive industry. Loans to automotive dealers and to borrowers involved with automotive production are reported as automotive, as management believes these loans have similar economic characteristics that might cause them to react similarly to changes in economic conditions. This aggregation involves the exercise of judgment. Included in automotive production are: (a) original equipment manufacturers and Tier 1 and Tier 2 suppliers that produce components used in vehicles and whose primary revenue source is automotive-related ("primary" defined as greater than 50%) and (b) other manufacturers that produce components used in vehicles and whose primary revenue source is automotive-related. Loans less than $1 million and loans recorded in the Small Business loan portfolio were excluded from the definition. Outstanding loans, included in "commercial loans" on the consolidated balance sheets, and total exposure from loans, unused commitments and standby letters of credit to companies related to the automotive industry were as follows:
NOTES TO CONSOLIDATED FINANCIAL STATEMENTS
Comerica Incorporated and Subsidiaries
|
| | | | | | | |
| (in millions) | | | |
| December 31 | 2015 | | 2014 |
| Automotive loans: | | | |
| Production | $ | 1,266 |
| | $ | 1,236 |
|
| Dealer | 6,573 |
| | 6,431 |
|
| Total automotive loans | $ | 7,839 |
| | $ | 7,667 |
|
| Total automotive exposure: | | | |
| Production | $ | 2,452 |
| | $ | 2,408 |
|
| Dealer | 8,209 |
| | 7,763 |
|
| Total automotive exposure | $ | 10,661 |
| | $ | 10,171 |
|
Further, the Corporation's portfolio of commercial real estate loans, which includes real estate construction and commercial mortgage loans, was as follows.
|
| | | | | | | |
| (in millions) | | | |
| December 31 | 2015 | | 2014 |
| Real estate construction loans: | | | |
| Commercial Real Estate business line (a) | $ | 1,681 |
| | $ | 1,606 |
|
| Other business lines (b) | 320 |
| | 349 |
|
| Total real estate construction loans | 2,001 |
| | 1,955 |
|
| Commercial mortgage loans: | | | |
| Commercial Real Estate business line (a) | 2,104 |
| | 1,790 |
|
| Other business lines (b) | 6,873 |
| | 6,814 |
|
| Total commercial mortgage loans | 8,977 |
| | 8,604 |
|
| Total commercial real estate loans | $ | 10,978 |
| | $ | 10,559 |
|
| Total unused commitments on commercial real estate loans | $ | 3,063 |
| | $ | 2,335 |
|
| |
| (a) | Primarily loans to real estate developers. |
| |
| (b) | Primarily loans secured by owner-occupied real estate. |
NOTE 6 - PREMISES AND EQUIPMENT
A summary of premises and equipment by major category follows:
|
| | | | | | | |
| (in millions) | | | |
| December 31 | 2015 | | 2014 |
| Land | $ | 87 |
| | $ | 88 |
|
| Buildings and improvements | 862 |
| | 808 |
|
| Furniture and equipment | 490 |
| | 508 |
|
| Total cost | 1,439 |
| | 1,404 |
|
| Less: Accumulated depreciation and amortization | (889 | ) | | (872 | ) |
| Net book value | $ | 550 |
| | $ | 532 |
|
The Corporation conducts a portion of its business from leased facilities and leases certain equipment. Rental expense for leased properties and equipment amounted to $79 million, $89 million and $78 million in 2015, 2014 and 2013, respectively. Rental expense in 2014 included approximately $10 million of lease termination charges. As of December 31, 2015, future minimum rental payments under operating leases were as follows:
|
| | | |
| (in millions) | |
| Years Ending December 31 | |
| 2016 | $ | 73 |
|
| 2017 | 70 |
|
| 2018 | 62 |
|
| 2019 | 53 |
|
| 2020 | 44 |
|
| Thereafter | 154 |
|
| Total | $ | 456 |
|
NOTES TO CONSOLIDATED FINANCIAL STATEMENTS
Comerica Incorporated and Subsidiaries
NOTE 7 - GOODWILL AND CORE DEPOSIT INTANGIBLES
The following table summarizes the carrying value of goodwill for the years ended December 31, 2015, 2014 and 2013.
|
| | | | | | | | | |
| (in millions) | | | |
| December 31 | 2015 | 2014 | 2013 |
| Business Bank | $ | 380 |
| $ | 380 |
| $ | 380 |
|
| Retail Bank | 194 |
| 194 |
| 194 |
|
| Wealth Management | 61 |
| 61 |
| 61 |
|
| Total | $ | 635 |
| $ | 635 |
| $ | 635 |
|
The Corporation performs its annual evaluation of goodwill impairment in the third quarter of each year and on an interim basis if events or changes in circumstances between annual tests indicate goodwill might be impaired. In 2015 and 2014, the annual test of goodwill impairment was performed as of the beginning of the third quarter. At the conclusion of the first step of the annual and interim goodwill impairment tests performed in 2015 and 2014 the estimated fair values of all reporting units exceeded their carrying amounts, including goodwill, indicating that goodwill was not impaired. There have been no events since the annual test performed in the third quarter 2015 that would indicate that it was more likely than not that goodwill had become impaired.
A summary of core deposit intangible carrying value and related accumulated amortization follows:
|
| | | | | | | |
| (in millions) | | | |
| December 31 | 2015 | | 2014 |
| Gross carrying amount | $ | 34 |
| | $ | 34 |
|
| Accumulated amortization | (24 | ) | | (21 | ) |
| Net carrying amount | $ | 10 |
| | $ | 13 |
|
The Corporation recorded amortization expense related to the core deposit intangible of $3 million for both the years ended December 31, 2015 and 2014. At December 31, 2015, estimated future amortization expense was as follows:
|
| | | |
| (in millions) | |
| Years Ending December 31 | |
| 2016 | $ | 2 |
|
| 2017 | 2 |
|
| 2018 | 2 |
|
| 2019 | 2 |
|
| 2020 | 1 |
|
| Thereafter | 1 |
|
| Total | $ | 10 |
|
NOTE 8 - DERIVATIVE AND CREDIT-RELATED FINANCIAL INSTRUMENTS
In the normal course of business, the Corporation enters into various transactions involving derivative and credit-related financial instruments to manage exposure to fluctuations in interest rate, foreign currency and other market risks and to meet the financing needs of customers (customer-initiated derivatives). These financial instruments involve, to varying degrees, elements of market and credit risk. Market and credit risk are included in the determination of fair value.
Market risk is the potential loss that may result from movements in interest rates, foreign currency exchange rates or energy commodity prices that cause an unfavorable change in the value of a financial instrument. The Corporation manages this risk by establishing monetary exposure limits and monitoring compliance with those limits. Market risk inherent in interest rate and energy contracts entered into on behalf of customers is mitigated by taking offsetting positions, except in those circumstances when the amount, tenor and/or contract rate level results in negligible economic risk, whereby the cost of purchasing an offsetting contract is not economically justifiable. The Corporation mitigates most of the inherent market risk in foreign exchange contracts entered into on behalf of customers by taking offsetting positions and manages the remainder through individual foreign currency position limits and aggregate value-at-risk limits. These limits are established annually and reviewed quarterly. Market risk inherent in derivative instruments held or issued for risk management purposes is typically offset by changes in the fair value of the assets or liabilities being hedged.
Credit risk is the possible loss that may occur in the event of nonperformance by the counterparty to a financial instrument. The Corporation attempts to minimize credit risk arising from customer-initiated derivatives by evaluating the creditworthiness of each customer, adhering to the same credit approval process used for traditional lending activities and obtaining collateral as
NOTES TO CONSOLIDATED FINANCIAL STATEMENTS
Comerica Incorporated and Subsidiaries
deemed necessary. Derivatives with dealer counterparties are either cleared through a clearinghouse or settled directly with a single counterparty. For derivatives settled directly with dealer counterparties, the Corporation utilizes counterparty risk limits and monitoring procedures as well as master netting arrangements and bilateral collateral agreements to facilitate the management of credit risk. Master netting arrangements effectively reduce credit risk by permitting settlement of positive and negative positions and offset cash collateral held with the same counterparty on a net basis. Bilateral collateral agreements require daily exchange of cash or highly rated securities issued by the U.S. Treasury or other U.S. government entities to collateralize amounts due to either party beyond certain risk limits. At December 31, 2015, counterparties with bilateral collateral agreements had pledged $139 million of marketable investment securities and deposited $354 million of cash with the Corporation to secure the fair value of contracts in an unrealized gain position, and the Corporation had pledged $3 million of investment securities and posted $3 million of cash as collateral for contracts in an unrealized loss position. For those counterparties not covered under bilateral collateral agreements, collateral is obtained, if deemed necessary, based on the results of management's credit evaluation of the counterparty. Collateral varies, but may include cash, investment securities, accounts receivable, equipment or real estate. Included in the fair value of derivative instruments are credit valuation adjustments reflecting counterparty credit risk. These adjustments are determined by applying a credit spread for the counterparty or the Corporation, as appropriate, to the total expected exposure of the derivative.
The aggregate fair value of all derivative instruments with credit-risk-related contingent features that were in a liability position on December 31, 2015 was $2 million, for which the Corporation had pledged collateral of $1 million in the normal course of business. The credit-risk-related contingent features require the Corporation's debt to maintain an investment grade credit rating from each of the major credit rating agencies. If the Corporation's debt were to fall below investment grade, the counterparties to the derivative instruments could require additional overnight collateral on derivative instruments in net liability positions. If the credit-risk-related contingent features underlying these agreements had been triggered on December 31, 2015, the Corporation would have been required to assign an additional $1 million of collateral to its counterparties.
Derivative Instruments
Derivative instruments utilized by the Corporation are negotiated over-the-counter and primarily include swaps, caps and floors, forward contracts and options, each of which may relate to interest rates, energy commodity prices or foreign currency exchange rates. Swaps are agreements in which two parties periodically exchange cash payments based on specified indices applied to a specified notional amount until a stated maturity. Caps and floors are agreements which entitle the buyer to receive cash payments based on the difference between a specified reference rate or price and an agreed strike rate or price, applied to a specified notional amount until a stated maturity. Forward contracts are over-the-counter agreements to buy or sell an asset at a specified future date and price. Options are similar to forward contracts except the purchaser has the right, but not the obligation, to buy or sell the asset during a specified period or at a specified future date.
Over-the-counter contracts are tailored to meet the needs of the counterparties involved and, therefore, contain a greater degree of credit risk and liquidity risk than exchange-traded contracts, which have standardized terms and readily available price information. The Corporation reduces exposure to market and liquidity risks from over-the-counter derivative instruments entered into for risk management purposes, and transactions entered into to mitigate the market risk associated with customer-initiated transactions, by conducting hedging transactions with investment grade domestic and foreign financial institutions and subjecting counterparties to credit approvals, limits and collateral monitoring procedures similar to those used in making other extensions of credit. In addition, certain derivative contracts executed bilaterally with a dealer counterparty in the over-the-counter market are cleared through a clearinghouse, whereby the clearinghouse becomes the counterparty to the transaction.
NOTES TO CONSOLIDATED FINANCIAL STATEMENTS
Comerica Incorporated and Subsidiaries
The following table presents the composition of the Corporation's derivative instruments held or issued for risk management purposes or in connection with customer-initiated and other activities at December 31, 2015 and 2014. The table excludes commitments and warrants accounted for as derivatives.
|
| | | | | | | | | | | | | | | | | | | | | | | |
| | December 31, 2015 | | December 31, 2014 |
| | | | Fair Value | | | | Fair Value |
| (in millions) | Notional/ Contract Amount (a) | | Gross Derivative Assets | | Gross Derivative Liabilities | | Notional/ Contract Amount (a) | | Gross Derivative Assets | | Gross Derivative Liabilities |
| Risk management purposes | | | | | | | | | | | |
| Derivatives designated as hedging instruments | | | | | | | | | | | |
| Interest rate contracts: | | | | | | | | | | | |
| Swaps - fair value - receive fixed/pay floating | $ | 2,525 |
| | $ | 147 |
| | $ | — |
| | $ | 1,800 |
| | $ | 175 |
| | $ | — |
|
| Derivatives used as economic hedges | | | | | | | | | | | |
| Foreign exchange contracts: | | | | | | | | | | | |
| Spot, forwards and swaps | 593 |
| | 3 |
| | — |
| | 508 |
| | 4 |
| | — |
|
| Total risk management purposes | 3,118 |
| | 150 |
| | — |
| | 2,308 |
| | 179 |
| | — |
|
| Customer-initiated and other activities | | | | | | | | | | | |
| Interest rate contracts: | | | | | | | | | | | |
| Caps and floors written | 253 |
| | — |
| | — |
| | 274 |
| | — |
| | — |
|
| Caps and floors purchased | 253 |
| | — |
| | — |
| | 274 |
| | — |
| | — |
|
| Swaps | 11,722 |
| | 139 |
| | 92 |
| | 11,780 |
| | 153 |
| | 102 |
|
| Total interest rate contracts | 12,228 |
| | 139 |
| | 92 |
| | 12,328 |
| | 153 |
| | 102 |
|
| Energy contracts: | | | | | | | | | | | |
| Caps and floors written | 536 |
| | — |
| | 85 |
| | 1,218 |
| | — |
| | 173 |
|
| Caps and floors purchased | 536 |
| | 85 |
| | — |
| | 1,218 |
| | 173 |
| | — |
|
| Swaps | 2,055 |
| | 390 |
| | 387 |
| | 2,496 |
| | 354 |
| | 352 |
|
| Total energy contracts | 3,127 |
| | 475 |
| | 472 |
| | 4,932 |
| | 527 |
| | 525 |
|
| Foreign exchange contracts: | | | | | | | | | | | |
| Spot, forwards, options and swaps | 2,291 |
| | 54 |
| | 46 |
| | 1,994 |
| | 35 |
| | 34 |
|
| Total customer-initiated and other activities | 17,646 |
| | 668 |
| | 610 |
| | 19,254 |
| | 715 |
| | 661 |
|
| Total gross derivatives | $ | 20,764 |
| | 818 |
| | 610 |
| | $ | 21,562 |
| | 894 |
| | 661 |
|
| Amounts offset in the consolidated balance sheets: | | | | | | | | | | | |
| Netting adjustment - Offsetting derivative assets/liabilities | | | (127 | ) | | (127 | ) | | | | (133 | ) | | (133 | ) |
| Netting adjustment - Cash collateral received/posted | | | (291 | ) | | (3 | ) | | | | (262 | ) | | — |
|
| Net derivatives included in the consolidated balance sheets (b) |
| | 400 |
| | 480 |
| |
|
|
| 499 |
| | 528 |
|
| Amounts not offset in the consolidated balance sheets: | | | | | | | | | | | |
| Marketable securities received/pledged under bilateral collateral agreements | | | (137 | ) | | (3 | ) | | | | (239 | ) | | (2 | ) |
| Net derivatives after deducting amounts not offset in the consolidated balance sheets |
|
| | $ | 263 |
| | $ | 477 |
| |
|
| | $ | 260 |
| | $ | 526 |
|
| |
| (a) | Notional or contractual amounts, which represent the extent of involvement in the derivatives market, are used to determine the contractual cash flows required in accordance with the terms of the agreement. These amounts are typically not exchanged, significantly exceed amounts subject to credit or market risk and are not reflected in the consolidated balance sheets. |
| |
| (b) | Net derivative assets are included in "accrued income and other assets" and net derivative liabilities are included in "accrued expenses and other liabilities" on the consolidated balance sheets. Included in the fair value of net derivative assets and net derivative liabilities are credit valuation adjustments reflecting counterparty credit risk and credit risk of the Corporation. The fair value of net derivative assets included credit valuation adjustments for counterparty credit risk of $5 million at December 31, 2015 and $2 million at December 31, 2014. |
Risk Management
As an end-user, the Corporation employs a variety of financial instruments for risk management purposes, including cash instruments, such as investment securities, as well as derivative instruments. Activity related to these instruments is centered predominantly in the interest rate markets and mainly involves interest rate swaps. Various other types of instruments also may
NOTES TO CONSOLIDATED FINANCIAL STATEMENTS
Comerica Incorporated and Subsidiaries
be used to manage exposures to market risks, including interest rate caps and floors, total return swaps, foreign exchange forward contracts and foreign exchange swap agreements.
The Corporation entered into interest rate swap agreements related to medium- and long-term debt for interest rate risk management purposes. These interest rate swap agreements effectively modify the Corporation's exposure to interest rate risk by converting fixed-rate debt to a floating rate. These agreements involve the receipt of fixed-rate interest amounts in exchange for floating-rate interest payments over the life of the agreement, without an exchange of the underlying principal amount. Risk management fair value interest rate swaps generated net interest income of $70 million and $72 million for the years ended December 31, 2015 and 2014, respectively. The Corporation recognized $1 million of gain for the year ended December 31, 2015 and an insignificant amount of gain for the year ended December 31, 2014 in "other noninterest income" in the consolidated statements of income for the ineffective portion of risk management derivative instruments designated as fair value hedges of fixed-rate debt.
Foreign exchange rate risk arises from changes in the value of certain assets and liabilities denominated in foreign currencies. The Corporation employs spot and forward contracts in addition to swap contracts to manage exposure to these and other risks. The Corporation recognized an insignificant amount of net losses for each of the years ended December 31, 2015 and December 31, 2014 on risk management derivative instruments used as economic hedges in "other noninterest income" in the consolidated statements of income.
The following table summarizes the expected weighted average remaining maturity of the notional amount of risk management interest rate swaps and the weighted average interest rates associated with amounts expected to be received or paid on interest rate swap agreements as of December 31, 2015 and 2014.
|
| | | | | | | | | | | |
| | | | Weighted Average |
| (dollar amounts in millions) | Notional Amount | | Remaining Maturity (in years) | | Receive Rate | | Pay Rate (a) |
| December 31, 2015 | | | | | | | |
| Swaps - fair value - receive fixed/pay floating rate | | | | | | | |
| Medium- and long-term debt designation | $ | 2,525 |
| | 5.1 | | 3.89 | % | | 1.11 | % |
| December 31, 2014 | | | | | | | |
| Swaps - fair value - receive fixed/pay floating rate | | | | | | | |
| Medium- and long-term debt designation | 1,800 |
| | 4.6 | | 4.54 |
| | 0.49 |
|
| |
| (a) | Variable rates paid on receive fixed swaps are based on six-month LIBOR rates in effect at December 31, 2015 and 2014. |
Management believes these hedging strategies achieve the desired relationship between the rate maturities of assets and funding sources which, in turn, reduce the overall exposure of net interest income to interest rate risk, although there can be no assurance that such strategies will be successful.
Customer-Initiated and Other
The Corporation enters into derivative transactions at the request of customers and generally takes offsetting positions with dealer counterparties to mitigate the inherent market risk. Income primarily results from the spread between the customer derivative and the offsetting dealer position.
For customer-initiated foreign exchange contracts where offsetting positions have not been taken, the Corporation manages the remaining inherent market risk through individual foreign currency position limits and aggregate value-at-risk limits. These limits are established annually and reviewed quarterly. For those customer-initiated derivative contracts which were not offset or where the Corporation holds a speculative position within the limits described above, the Corporation recognized $1 million of net gains in "other noninterest income" in the consolidated statements of income for each of the years ended December 31, 2015 and 2014.
NOTES TO CONSOLIDATED FINANCIAL STATEMENTS
Comerica Incorporated and Subsidiaries
Fair values of customer-initiated and other derivative instruments represent the net unrealized gains or losses on such contracts and are recorded in the consolidated balance sheets. Changes in fair value are recognized in the consolidated statements of income. The net gains recognized in income on customer-initiated derivative instruments, net of the impact of offsetting positions, were as follows.
|
| | | | | | | | | |
| (in millions) | | | | | |
| Years Ended December 31 | | Location of Gain | 2015 | | 2014 |
| Interest rate contracts | | Other noninterest income | $ | 16 |
| | $ | 20 |
|
| Energy contracts | | Other noninterest income | 2 |
| | 2 |
|
| Foreign exchange contracts | | Foreign exchange income | 37 |
| | 38 |
|
| Total | | | $ | 55 |
| | $ | 60 |
|
Credit-Related Financial Instruments
The Corporation issues off-balance sheet financial instruments in connection with commercial and consumer lending activities. The Corporation's credit risk associated with these instruments is represented by the contractual amounts indicated in the following table.
|
| | | | | | | |
| (in millions) | | | |
| December 31 | 2015 | | 2014 |
| Unused commitments to extend credit: | | | |
| Commercial and other | $ | 26,115 |
| | $ | 27,905 |
|
| Bankcard, revolving check credit and home equity loan commitments | 2,414 |
| | 2,151 |
|
| Total unused commitments to extend credit | $ | 28,529 |
| | $ | 30,056 |
|
| Standby letters of credit | $ | 3,985 |
| | $ | 3,880 |
|
| Commercial letters of credit | 41 |
| | 75 |
|
The Corporation maintains an allowance to cover probable credit losses inherent in lending-related commitments, including unused commitments to extend credit, letters of credit and financial guarantees. At December 31, 2015 and 2014, the allowance for credit losses on lending-related commitments, included in "accrued expenses and other liabilities" on the consolidated balance sheets, was $45 million and $41 million, respectively.
Unused Commitments to Extend Credit
Commitments to extend credit are legally binding agreements to lend to a customer, provided there is no violation of any condition established in the contract. These commitments generally have fixed expiration dates or other termination clauses and may require payment of a fee. Since many commitments expire without being drawn upon, the total contractual amount of commitments does not necessarily represent future cash requirements of the Corporation. Commercial and other unused commitments are primarily variable rate commitments. The allowance for credit losses on lending-related commitments included $33 million and $30 million at December 31, 2015 and 2014, respectively, for probable credit losses inherent in the Corporation's unused commitments to extend credit.
Standby and Commercial Letters of Credit
Standby letters of credit represent conditional obligations of the Corporation which guarantee the performance of a customer to a third party. Standby letters of credit are primarily issued to support public and private borrowing arrangements, including commercial paper, bond financing and similar transactions. Commercial letters of credit are issued to finance foreign or domestic trade transactions. These contracts expire in decreasing amounts through the year 2022. The Corporation may enter into participation arrangements with third parties that effectively reduce the maximum amount of future payments which may be required under standby and commercial letters of credit. These risk participations covered $287 million and $316 million at December 31, 2015 and 2014, respectively, of the $4.0 billion of standby and commercial letters of credit outstanding at both December 31, 2015 and 2014.
The carrying value of the Corporation's standby and commercial letters of credit, included in "accrued expenses and other liabilities" on the consolidated balance sheets, totaled $49 million at December 31, 2015, including $37 million in deferred fees and $12 million in the allowance for credit losses on lending-related commitments. At December 31, 2014, the comparable amounts were $55 million, $44 million and $11 million, respectively.
The following table presents a summary of criticized standby and commercial letters of credit at December 31, 2015 and December 31, 2014. The Corporation's criticized list is consistent with the Special mention, Substandard and Doubtful categories defined by regulatory authorities. The Corporation manages credit risk through underwriting, periodically reviewing and approving its credit exposures using Board committee approved credit policies and guidelines.
NOTES TO CONSOLIDATED FINANCIAL STATEMENTS
Comerica Incorporated and Subsidiaries
|
| | | | | | | |
| (dollar amounts in millions) | December 31, 2015 | | December 31, 2014 |
| Total criticized standby and commercial letters of credit | $ | 110 |
| | $ | 79 |
|
| As a percentage of total outstanding standby and commercial letters of credit | 2.7 | % | | 2.0 | % |
Other Credit-Related Financial Instruments
The Corporation enters into credit risk participation agreements, under which the Corporation assumes credit exposure associated with a borrower's performance related to certain interest rate derivative contracts. The Corporation is not a party to the interest rate derivative contracts and only enters into these credit risk participation agreements in instances in which the Corporation is also a party to the related loan participation agreement for such borrowers. The Corporation manages its credit risk on the credit risk participation agreements by monitoring the creditworthiness of the borrowers, which is based on the normal credit review process had it entered into the derivative instruments directly with the borrower. The notional amount of such credit risk participation agreement reflects the pro-rata share of the derivative instrument, consistent with its share of the related participated loan. As of December 31, 2015 and 2014, the total notional amount of the credit risk participation agreements was approximately $559 million and $598 million, respectively, and the fair value, included in customer-initiated interest rate contracts recorded in "accrued expenses and other liabilities" on the consolidated balance sheets, was insignificant for each period. The maximum estimated exposure to these agreements, as measured by projecting a maximum value of the guaranteed derivative instruments, assuming 100 percent default by all obligors on the maximum values, was approximately $5 million and $7 million at December 31, 2015 and 2014, respectively. In the event of default, the lead bank has the ability to liquidate the assets of the borrower, in which case the lead bank would be required to return a percentage of the recouped assets to the participating banks. As of December 31, 2015, the weighted average remaining maturity of outstanding credit risk participation agreements was 2.4 years.
NOTE 9 - VARIABLE INTEREST ENTITIES (VIEs)
The Corporation evaluates its interest in certain entities to determine if these entities meet the definition of a VIE and whether the Corporation is the primary beneficiary and should consolidate the entity based on the variable interests it held both at inception and when there is a change in circumstances that requires a reconsideration.
The Corporation holds ownership interests in funds in the form of limited partnerships or limited liability companies (LLCs) investing in affordable housing projects that qualify for the LIHTC. The Corporation also directly invests in limited partnerships and LLCs which invest in community development projects which generate similar tax credits to investors. As an investor, the Corporation obtains income tax credits and deductions from the operating losses of these tax credit entities. These tax credit entities meet the definition of a VIE; however, the Corporation is not the primary beneficiary of the entities, as the general partner or the managing member has both the power to direct the activities that most significantly impact the economic performance of the entities and the obligation to absorb losses or the right to receive benefits that could be significant to the entities. While the partnership/LLC agreements allow the limited partners/investor members, through a majority vote, to remove the general partner/managing member, this right is not deemed to be substantive as the general partner/managing member can only be removed for cause.
The Corporation accounts for its interests in LIHTC entities using the proportional amortization method. Exposure to loss as a result of the Corporation's involvement with LIHTC entities at December 31, 2015 was limited to approximately $405 million. Ownership interests in other community development projects which generate similar tax credits to investors (other tax credit entities) are accounted for under either the cost or equity method. Exposure to loss as a result of the Corporation's involvement in other tax credit entities at December 31, 2015 was limited to approximately $10 million.
Investment balances, including all legally binding commitments to fund future investments, are included in "accrued income and other assets" on the consolidated balance sheets. A liability is recognized in "accrued expenses and other liabilities" on the consolidated balance sheets for all legally binding unfunded commitments to fund tax credit entities ($143 million at December 31, 2015). Amortization and other write-downs of LIHTC investments are presented on a net basis as a component of the "provision for income taxes" on the consolidated statements of income, while amortization and write-downs of other tax credit investments are recorded in "other noninterest income." The income tax credits and deductions are recorded as a reduction of income tax expense and a reduction of federal income taxes payable.
The Corporation provided no financial or other support that was not contractually required to any of the above VIEs during the years ended December 31, 2015, 2014 and 2013.
The following table summarizes the impact of these tax credit entities on line items on the Corporation's consolidated statements of income.
NOTES TO CONSOLIDATED FINANCIAL STATEMENTS
Comerica Incorporated and Subsidiaries
|
| | | | | | | | | | | |
| (in millions) | |
| Years Ended December 31 | 2015 | | 2014 | | 2013 |
| Other noninterest income: | | | | | |
| Amortization of other tax credit investments | $ | 1 |
| | $ | (5 | ) | | $ | (1 | ) |
| Provision for income taxes: | | | | | |
| Amortization of LIHTC Investments | 62 |
| | 60 |
| | 56 |
|
| Low income housing tax credits | (61 | ) | | (59 | ) | | (56 | ) |
| Other tax benefits related to tax credit entities | (22 | ) | | (28 | ) | | (21 | ) |
| Total provision for income taxes | $ | (21 | ) | | $ | (27 | ) | | $ | (21 | ) |
For further information on the Corporation's consolidation policy, see Note 1.
NOTE 10 - DEPOSITS
At December 31, 2015, the scheduled maturities of certificates of deposit and other deposits with a stated maturity were as follows:
|
| | | |
| (in millions) | |
| Years Ending December 31 | |
| 2016 | $ | 2,792 |
|
| 2017 | 503 |
|
| 2018 | 132 |
|
| 2019 | 83 |
|
| 2020 | 51 |
|
| Thereafter | 23 |
|
| Total | $ | 3,584 |
|
A maturity distribution of domestic certificates of deposit of $100,000 and over follows:
|
| | | | | | | |
| (in millions) | | | |
| December 31 | 2015 | | 2014 |
| Three months or less | $ | 532 |
| | $ | 822 |
|
| Over three months to six months | 385 |
| | 456 |
|
| Over six months to twelve months | 659 |
| | 733 |
|
| Over twelve months | 537 |
| | 795 |
|
| Total | $ | 2,113 |
| | $ | 2,806 |
|
The aggregate amount of domestic certificates of deposit that meet or exceed the current FDIC insurance limit of $250,000 was $1.4 billion and $2.0 billion at December 31, 2015 and 2014, respectively. All foreign office time deposits of $32 million and $135 million at December 31, 2015 and 2014, respectively, were in denominations of $250,000 or more.
NOTE 11 - SHORT-TERM BORROWINGS
Federal funds purchased and securities sold under agreements to repurchase generally mature within one to four days from the transaction date. Other short-term borrowings, which may consist of borrowed securities and short-term notes, generally mature within one to 120 days from the transaction date.
At December 31, 2015, Comerica Bank (the Bank), a subsidiary of the Corporation, had pledged loans totaling $24 billion which provided for up to $18 billion of available collateralized borrowing with the FRB.
NOTES TO CONSOLIDATED FINANCIAL STATEMENTS
Comerica Incorporated and Subsidiaries
The following table provides a summary of short-term borrowings.
|
| | | |
| (dollar amounts in millions) | Federal Funds Purchased and Securities Sold Under Agreements to Repurchase |
| December 31, 2015 | |
| Amount outstanding at year-end | $ | 23 |
|
| Weighted average interest rate at year-end | 0.38 | % |
| Maximum month-end balance during the year | $ | 109 |
|
| Average balance outstanding during the year | 93 |
|
| Weighted average interest rate during the year | 0.05 | % |
| December 31, 2014 | |
| Amount outstanding at year-end | $ | 116 |
|
| Weighted average interest rate at year-end | 0.04 | % |
| Maximum month-end balance during the year | $ | 238 |
|
| Average balance outstanding during the year | 200 |
|
| Weighted average interest rate during the year | 0.04 | % |
| December 31, 2013 | |
| Amount outstanding at year-end | $ | 253 |
|
| Weighted average interest rate at year-end | 0.05 | % |
| Maximum month-end balance during the year | $ | 277 |
|
| Average balance outstanding during the year | 211 |
|
| Weighted average interest rate during the year | 0.07 | % |
NOTE 12 - MEDIUM- AND LONG-TERM DEBT
Medium- and long-term debt is summarized as follows:
|
| | | | | | | |
| (in millions) | | | |
| December 31 | 2015 | | 2014 |
| Parent company | | | |
| Subordinated notes: | | | |
| 4.80% subordinated notes due 2015 (a) | $ | — |
| | $ | 304 |
|
| 3.80% subordinated notes due 2026 (a) | 259 |
| | 257 |
|
| Medium-term notes: | | | |
| 3.00% notes due 2015 | — |
| | 300 |
|
| 2.125% notes due 2019 (a) | 349 |
| | 347 |
|
| Total parent company | 608 |
| | 1,208 |
|
| Subsidiaries | | | |
| Subordinated notes: | | | |
| 5.75% subordinated notes due 2016 (a) (b) | 659 |
| | 670 |
|
| 5.20% subordinated notes due 2017 (a) | 530 |
| | 548 |
|
| 4.00% subordinated notes due 2025 (a) | 351 |
| | — |
|
| 7.875% subordinated notes due 2026 (a) | 223 |
| | 227 |
|
| Total subordinated notes | 1,763 |
| | 1,445 |
|
| Medium-term notes: | | | |
| 2.50% notes due 2020 (a) | 671 |
| | — |
|
| Other notes: | | | |
| 6.0% - 6.4% fixed-rate notes due 2015 to 2020 | 16 |
| | 22 |
|
| Total subsidiaries | 2,450 |
| | 1,467 |
|
| Total medium- and long-term debt | $ | 3,058 |
| | $ | 2,675 |
|
| |
| (a) | The fixed interest rates on these notes have been swapped to a variable rate and designated in a hedging relationship. Accordingly, carrying value has been adjusted to reflect the change in the fair value of the debt as a result of changes in the benchmark rate. |
| |
| (b) | The fixed interest rate on $250 million of $600 million total par value of these notes have been swapped to a variable rate. |
Subordinated notes with remaining maturities greater than one year qualify as Tier 2 capital.
NOTES TO CONSOLIDATED FINANCIAL STATEMENTS
Comerica Incorporated and Subsidiaries
In 2015, the Corporation early adopted accounting guidance that amended the presentation of debt issuance costs in the balance sheet as a direct deduction from the carrying amount of the related debt liability rather than as a deferred charge. The new guidance was retrospectively applied, which resulted in a decrease of $4 million to both "accrued income and other assets" and "medium- and long-term debt" on the consolidated balance sheets as of December 31, 2014. At December 31, 2015, unamortized debt issuance costs deducted from the carrying amount of medium- and long-term debt totaled $8 million.
The Bank is a member of the FHLB, which provides short- and long-term funding to its members through advances collateralized by real-estate related assets. Actual borrowing capacity is contingent upon the amount of collateral available to be pledged to the FHLB. At December 31, 2015, $14 billion of real estate-related loans were pledged to the FHLB as blanket collateral for potential future borrowings of approximately $6 billion.
At December 31, 2015, the principal maturities of medium- and long-term debt were as follows:
|
| | | |
| (in millions) | |
| Years Ending December 31 | |
| 2016 | $ | 650 |
|
| 2017 | 500 |
|
| 2018 | 2 |
|
| 2019 | 357 |
|
| 2020 | 682 |
|
| Thereafter | 750 |
|
| Total | $ | 2,941 |
|
NOTE 13 - SHAREHOLDERS' EQUITY
The Federal Reserve completed its 2015 Comprehensive Capital Analysis and Review (CCAR) of the Corporation's 2015-2016 capital plan in March 2015 and did not object to the capital distributions contemplated in the plan. The capital plan provides for up to $393 million of equity repurchases for the five-quarter period ending June 30, 2016. During the year ended December 31, 2015, the Corporation had repurchased $242 million under the equity repurchase program.
Repurchases of common stock under the equity repurchase program authorized in 2010 by the Board of Directors of the Corporation totaled 5.1 million shares at an average price paid of $45.65 per share in 2015, 5.2 million shares at an average price paid of $47.91 per share in 2014 and 7.4 million shares at an average price paid of $38.63 per share in 2013. The Corporation also repurchased 500 thousand warrants at an average price paid of $20.70 in 2015. There is no expiration date for the Corporation's equity repurchase program.
At December 31, 2015, the Corporation had 9.5 million warrants outstanding to purchase 8.5 million common shares at a weighted-average exercise price of $29.43. Outstanding warrants were exercisable at the date of grant and expire in 2018. Approximately 934 thousand and 361 thousand shares of common stock were issued upon exercise of warrants in 2015 and 2014, respectively. There were no warrant exercises in 2013.
At December 31, 2015, the Corporation had 8.5 million shares of common stock reserved for warrant exercises, 12.7 million shares of common stock reserved for stock option exercises and restricted stock unit vesting and 1.9 million shares of restricted stock outstanding to employees and directors under share-based compensation plans.
NOTES TO CONSOLIDATED FINANCIAL STATEMENTS
Comerica Incorporated and Subsidiaries
NOTE 14 - ACCUMULATED OTHER COMPREHENSIVE LOSS
The following table presents a reconciliation of the changes in the components of accumulated other comprehensive loss and details the components of other comprehensive income (loss) for the years ended December 31, 2015, 2014 and 2013, including the amount of income tax expense (benefit) allocated to each component of other comprehensive income (loss).
|
| | | | | | | | | | | |
| (in millions) | | | | | |
| Years Ended December 31 | 2015 | | 2014 | | 2013 |
| Accumulated net unrealized gains (losses) on investment securities: | | | | | |
| Balance at beginning of period, net of tax | $ | 37 |
| | $ | (68 | ) | | $ | 150 |
|
| | | | | | |
| Net unrealized holding (losses) gains arising during the period | (55 | ) | | 166 |
| | (343 | ) |
| Less: (Benefit) provision for income taxes | (21 | ) | | 60 |
| | (126 | ) |
| Net unrealized holding (losses) gains arising during the period, net of tax | (34 | ) | | 106 |
| | (217 | ) |
| Less: | | | | | |
| Net realized (losses) gains included in net securities (losses) gains | (2 | ) | | 1 |
| | 1 |
|
| Less: Benefit for income taxes | (1 | ) | | — |
| | — |
|
| Reclassification adjustment for net securities (losses) gains included in net income, net of tax | (1 | ) | | 1 |
| | 1 |
|
| Less: | | | | | |
| Net losses realized as a yield adjustment in interest on investment securities | (8 | ) | | — |
| | — |
|
| Less: Benefit for income taxes | (3 | ) | | — |
| | — |
|
| Reclassification adjustment for net losses realized as a yield adjustment included in net income, net of tax | (5 | ) | | — |
| | — |
|
| Change in net unrealized (losses) gains on investment securities, net of tax | (28 | ) | | 105 |
| | (218 | ) |
| Balance at end of period, net of tax | $ | 9 |
| | $ | 37 |
| | $ | (68 | ) |
| | | | | | |
| Accumulated defined benefit pension and other postretirement plans adjustment: | | | | | |
| Balance at beginning of period, net of tax | $ | (449 | ) | | $ | (323 | ) | | $ | (563 | ) |
| | | | | | |
| Actuarial (loss) gain arising during the period | (57 | ) | | (240 | ) | | 286 |
|
| Prior service credit arising during the period | 3 |
| | — |
| | — |
|
| Net defined benefit pension and other postretirement adjustment arising during the period | (54 | ) | | (240 | ) | | 286 |
|
| Less: (Benefit) provision for income taxes | (19 | ) | | (87 | ) | | 103 |
|
| Net defined benefit pension and other postretirement adjustment arising during the period, net of tax | (35 | ) | | (153 | ) | | 183 |
|
| Amounts recognized in salaries and benefits expense: | | | | | |
| Amortization of actuarial net loss | 70 |
| | 39 |
| | 89 |
|
| Amortization of prior service cost | 1 |
| | 3 |
| | 2 |
|
| Total amounts recognized in salaries and benefits expense | 71 |
| | 42 |
| | 91 |
|
| Less: Benefit for income taxes | 25 |
| | 15 |
| | 34 |
|
| Adjustment for amounts recognized as components of net periodic benefit cost during the period, net of tax | 46 |
| | 27 |
| | 57 |
|
| Change in defined benefit pension and other postretirement plans adjustment, net of tax | 11 |
| | (126 | ) | | 240 |
|
| Balance at end of period, net of tax | $ | (438 | ) | | $ | (449 | ) | | $ | (323 | ) |
| Total accumulated other comprehensive loss at end of period, net of tax | $ | (429 | ) | | $ | (412 | ) | | $ | (391 | ) |
NOTES TO CONSOLIDATED FINANCIAL STATEMENTS
Comerica Incorporated and Subsidiaries
NOTE 15 - NET INCOME PER COMMON SHARE
Basic and diluted net income per common share are presented in the following table.
|
| | | | | | | | | | | |
| (in millions, except per share data) | | | | | |
| Years Ended December 31 | 2015 | | 2014 | | 2013 |
| Basic and diluted | | | | | |
| Net income | $ | 521 |
| | $ | 593 |
| | $ | 541 |
|
| Less income allocated to participating securities | 6 |
| | 7 |
| | 8 |
|
| Net income attributable to common shares | $ | 515 |
| | $ | 586 |
| | $ | 533 |
|
| | | | | | |
| Basic average common shares | 176 |
| | 179 |
| | 183 |
|
| | | | | | |
| Basic net income per common share | $ | 2.93 |
| | $ | 3.28 |
| | $ | 2.92 |
|
| | | | | | |
| Basic average common shares | 176 |
| | 179 |
| | 183 |
|
| Dilutive common stock equivalents: | | | | | |
| Net effect of the assumed exercise of stock options | 2 |
| | 2 |
| | 1 |
|
| Net effect of the assumed exercise of warrants | 3 |
| | 4 |
| | 3 |
|
| Diluted average common shares | 181 |
| | 185 |
| | 187 |
|
| | | | | | |
| Diluted net income per common share | $ | 2.84 |
| | $ | 3.16 |
| | $ | 2.85 |
|
The following average shares related to outstanding options to purchase shares of common stock were not included in the computation of diluted net income per common share because the prices of the options and warrants were greater than the average market price of common shares for the period.
|
| | | | | |
| (shares in millions) | | | | | |
| Years Ended December 31 | 2015 | | 2014 | | 2013 |
| Average outstanding options | 5.1 | | 7.2 | | 10.8 |
| Range of exercise prices | $46.68 - $60.82 | | $47.24 - $61.94 | | $34.78 - $61.94 |
NOTE 16 - SHARE-BASED COMPENSATION
Share-based compensation expense is charged to "salaries and benefits" expense on the consolidated statements of income. The components of share-based compensation expense for all share-based compensation plans and related tax benefits are as follows.
|
| | | | | | | | | | | |
| (in millions) | | | | | |
| Years Ended December 31 | 2015 | | 2014 | | 2013 |
| Total share-based compensation expense | $ | 38 |
| | $ | 38 |
| | $ | 35 |
|
| Related tax benefits recognized in net income | $ | 14 |
| | $ | 14 |
| | $ | 13 |
|
The following table summarizes unrecognized compensation expense for all share-based plans:
|
| | | |
| (dollar amounts in millions) | December 31, 2015 |
| Total unrecognized share-based compensation expense | $ | 49 |
|
| Weighted-average expected recognition period (in years) | 2.8 |
|
The Corporation has share-based compensation plans under which it awards shares of restricted stock and restricted stock units to executive officers, directors and key personnel, and stock options to executive officers and key personnel of the Corporation and its subsidiaries. Restricted stock vests over periods ranging from three years to five years, restricted stock units vest over periods ranging from one year to three years, and stock options vest over periods ranging from one year to four years. The maturity of each option is determined at the date of grant; however, no options may be exercised later than ten years from the date of grant. The options may have restrictions regarding exercisability. The plans originally provided for a grant of up to 19.4 million common shares, plus shares under certain plans that are forfeited, expire or are canceled, which become available for re-grant. At December 31, 2015, 9.8 million shares were available for grant.
NOTES TO CONSOLIDATED FINANCIAL STATEMENTS
Comerica Incorporated and Subsidiaries
The Corporation used a binomial model to value stock options granted in the periods presented. Option valuation models require several inputs, including the expected stock price volatility, and changes in input assumptions can materially affect the fair value estimates. The model used may not necessarily provide a reliable single measure of the fair value of employee and director stock options. The risk-free interest rate assumption used in the binomial option-pricing model as outlined in the table below was based on the federal ten-year treasury interest rate. The expected dividend yield was based on the historical and projected dividend yield patterns of the Corporation's common shares. Expected volatility assumptions considered both the historical volatility of the Corporation's common stock over a ten-year period and implied volatility based on actively traded options on the Corporation's common stock with pricing terms and trade dates similar to the stock options granted.
The estimated weighted-average grant-date fair value per option and the underlying binomial option-pricing model assumptions are summarized in the following table:
|
| | | | | | | | | | | |
| Years Ended December 31 | 2015 | | 2014 | | 2013 |
| Weighted-average grant-date fair value per option | $ | 11.31 |
| | $ | 13.21 |
| | $ | 9.07 |
|
| Weighted-average assumptions: | | | | | |
| Risk-free interest rates | 1.83 | % | | 2.95 | % | | 1.94 | % |
| Expected dividend yield | 3.00 |
| | 3.00 |
| | 3.00 |
|
| Expected volatility factors of the market price of Comerica common stock | 33 |
| | 31 |
| | 34 |
|
| Expected option life (in years) | 6.9 |
| | 5.8 |
| | 6.4 |
|
A summary of the Corporation's stock option activity and related information for the year ended December 31, 2015 follows:
|
| | | | | | | | | | | | | |
| | | | Weighted-Average | | |
| | Number of Options (in thousands) | | Exercise Price per Share | | Remaining Contractual Term (in years) | | Aggregate Intrinsic Value (in millions) |
| Outstanding-January 1, 2015 | 14,003 |
| | $ | 44.28 |
| | | | |
| Granted | 1,035 |
| | 42.32 |
| | | | |
| Forfeited or expired | (2,405 | ) | | 53.88 |
| | | | |
| Exercised | (841 | ) | | 33.46 |
| | | | |
| Outstanding-December 31, 2015 | 11,792 |
| | 42.92 |
| | 4.1 |
| | $ | 53 |
|
| Outstanding, net of expected forfeitures-December 31, 2014 | 11,520 |
| | 43.04 |
| | 4.0 |
| | 52 |
|
| Exercisable-December 31, 2015 | 9,146 |
| | 43.70 |
| | 3.0 |
| | 43 |
|
The aggregate intrinsic value of outstanding options shown in the table above represents the total pretax intrinsic value at December 31, 2015, based on the Corporation's closing stock price of $41.83 at December 31, 2015.
The total intrinsic value of stock options exercised was $12 million, $23 million and $14 million for the years ended December 31, 2015, 2014 and 2013, respectively.
A summary of the Corporation's restricted stock activity and related information for the year ended December 31, 2015 follows:
|
| | | | | | |
| | Number of Shares (in thousands) | | Weighted-Average Grant-Date Fair Value per Share |
| Outstanding-January 1, 2015 | 2,140 |
| | $ | 35.38 |
|
| Granted | 413 |
| | 42.45 |
|
| Forfeited | (106 | ) | | 37.02 |
|
| Vested | (537 | ) | | 33.29 |
|
| Outstanding-December 31, 2015 | 1,910 |
| | $ | 37.41 |
|
The total fair value of restricted stock awards that fully vested was $18 million for the years ended both December 31, 2015 and 2014 and $10 million for the year ended December 31, 2013.
NOTES TO CONSOLIDATED FINANCIAL STATEMENTS
Comerica Incorporated and Subsidiaries
A summary of the Corporation's restricted stock unit activity and related information for the year ended December 31, 2015 follows:
|
| | | | | | | | | | | | | |
| | Service-Based Units | | Performance-Based Units |
| | Number of Units (in thousands) | | Weighted-Average Grant-Date Fair Value per Share | | Number of Units (in thousands) | | Weighted-Average Grant-Date Fair Value per Share |
| Outstanding-January 1, 2015 | 387 |
| | $ | 34.58 |
| | 319 |
| | $ | 45.44 |
|
| Granted | 18 |
| | 46.83 |
| | 266 |
| | 42.32 |
|
| Converted | 41 |
| | 33.79 |
| | (41 | ) | | 33.79 |
|
| Forfeited | (33 | ) | | 37.78 |
| | (34 | ) | | 43.27 |
|
| Outstanding-December 31, 2015 | 413 |
| | 34.77 |
| | 510 |
| | 44.89 |
|
The Corporation expects to satisfy the exercise of stock options, the vesting of restricted stock units and future grants of restricted stock by issuing shares of common stock out of treasury. At December 31, 2015, the Corporation held 52.5 million shares in treasury.
For further information on the Corporation's share-based compensation plans, refer to Note 1.
NOTE 17 - EMPLOYEE BENEFIT PLANS
Defined Benefit Pension and Postretirement Benefit Plans
The Corporation has a qualified and a non-qualified defined benefit pension plan, which together provide benefits for substantially all full-time employees hired before January 1, 2007 who continue to meet the eligibility requirements of the plans. Salaries and benefits expense included defined benefit pension expense of $47 million, $39 million and $86 million in the years ended December 31, 2015, 2014 and 2013, respectively, for the plans. Benefits under the defined benefit plans are based primarily on years of service, age and compensation during the five highest paid consecutive calendar years occurring during the last ten years before retirement.
The Corporation's postretirement benefit plan continues to provide postretirement health care and life insurance benefits for retirees as of December 31, 1992. The plan also provides certain postretirement health care and life insurance benefits for a limited number of retirees who retired prior to January 1, 2000. For all other employees hired prior to January 1, 2000, a nominal benefit is provided. Employees hired on or after January 1, 2000 and prior to January 1, 2007 are eligible to participate in the plan on a full contributory basis until Medicare-eligible. Employees hired on or after January 1, 2007 are not eligible to participate in the plan. The Corporation funds the pre-1992 retiree plan benefits with bank-owned life insurance. Employee benefits expense included postretirement benefit expense of $1 million in each of the years ended December 31, 2015 and December 31, 2014, and $2 million in the year ended December 31, 2013.
NOTES TO CONSOLIDATED FINANCIAL STATEMENTS
Comerica Incorporated and Subsidiaries
The following table sets forth reconciliations of plan assets and the projected benefit obligation, the weighted-average assumptions used to determine year-end benefit obligations, and the amounts recognized in accumulated other comprehensive income (loss) for the Corporation's defined benefit pension plans and postretirement benefit plan at December 31, 2015 and 2014. The Corporation used a measurement date of December 31, 2015 for these plans.
|
| | | | | | | | | | | | | | | | | | | | | | | | | |
| | Defined Benefit Pension Plans | | | | |
| | Qualified | | | Non-Qualified | | Postretirement Benefit Plan |
| (dollar amounts in millions) | 2015 | | 2014 | | 2015 | | 2014 | | 2015 | | 2014 |
| Change in fair value of plan assets: | | | | | | | | | | | | | |
| Fair value of plan assets at January 1 | $ | 2,541 |
| | | $ | 2,035 |
| | | $ | — |
| | $ | — |
| | $ | 67 |
| | $ | 67 |
|
| Actual return on plan assets | (73 | ) | | | 278 |
| | | — |
| | — |
| | — |
| | 3 |
|
| Employer contributions | — |
| | | 350 |
| | | — |
| | — |
| | — |
| | 2 |
|
| Benefits paid | (122 | ) | (a) | | (122 | ) | (a) | | — |
| | — |
| | (6 | ) | | (5 | ) |
| Fair value of plan assets at December 31 | $ | 2,346 |
| | | $ | 2,541 |
| | | $ | — |
| | $ | — |
| | $ | 61 |
| | $ | 67 |
|
| Change in projected benefit obligation: | | | | | | | | | | | | | |
| Projected benefit obligation at January 1 | $ | 2,070 |
| | | $ | 1,731 |
| | | $ | 235 |
| | $ | 195 |
| | $ | 73 |
| | $ | 69 |
|
| Service cost | 35 |
| | | 29 |
| | | 4 |
| | 3 |
| | — |
| | — |
|
| Interest cost | 88 |
| | | 88 |
| | | 10 |
| | 10 |
| | 3 |
| | 3 |
|
| Actuarial (gain) loss | (155 | ) | | | 344 |
| | | (16 | ) | | 37 |
| | (8 | ) | | 6 |
|
| Benefits paid | (122 | ) | (a) | | (122 | ) | (a) | | (11 | ) | | (10 | ) | | (6 | ) | | (5 | ) |
| Plan amendment | — |
| | | — |
| | | — |
| | — |
| | (3 | ) | | — |
|
| Projected benefit obligation at December 31 | $ | 1,916 |
| | | $ | 2,070 |
| | | $ | 222 |
| | $ | 235 |
| | $ | 59 |
| | $ | 73 |
|
| Accumulated benefit obligation | $ | 1,756 |
| | | $ | 1,905 |
| | | $ | 191 |
| | $ | 203 |
| | $ | 59 |
| | $ | 73 |
|
| Funded status at December 31 (b) (c) | $ | 430 |
| | | $ | 471 |
| | | $ | (222 | ) | | $ | (235 | ) | | $ | 2 |
| | $ | (6 | ) |
| Weighted-average assumptions used: | | | | | | | | | | | | | |
| Discount rate | 4.82 | % | | | 4.28 | % | | | 4.82 | % | | 4.28 | % | | 4.53 | % | | 3.99 | % |
| Rate of compensation increase | 3.75 |
| | | 3.75 |
| | | 3.75 |
| | 3.75 |
| | n/a |
| | n/a |
|
| Healthcare cost trend rate: | | | | | | | | | | | | | |
| Cost trend rate assumed for next year | n/a |
| | | n/a |
| | | n/a |
| | n/a |
| | 7.00 |
| | 7.00 |
|
| Rate to which the cost trend rate is assumed to decline (the ultimate trend rate) | n/a |
| | | n/a |
| | | n/a |
| | n/a |
| | 5.00 |
| | 5.00 |
|
| Year when rate reaches the ultimate trend rate | n/a |
| | | n/a |
| | | n/a |
| | n/a |
| | 2027 |
| | 2026 |
|
| Amounts recognized in accumulated other comprehensive income (loss) before income taxes: | | | | | | | | | | | | | |
| Net actuarial loss | $ | (586 | ) | | | $ | (568 | ) | | | $ | (78 | ) | | $ | (104 | ) | | $ | (22 | ) | | $ | (27 | ) |
| Prior service (cost) credit | (21 | ) | | | (25 | ) | | | 21 |
| | 25 |
| | 1 |
| | (3 | ) |
| Balance at December 31 | $ | (607 | ) | | | $ | (593 | ) | | | $ | (57 | ) | | $ | (79 | ) | | $ | (21 | ) | | $ | (30 | ) |
| |
| (a) | Included $56 million and $63 million in benefit payments made to certain terminated vested eligible participants who elected to receive lump-sum settlements in 2015 and 2014, respectively. |
| |
| (b) | Based on projected benefit obligation for defined benefit pension plans and accumulated benefit obligation for postretirement benefit plan. |
| |
| (c) | The Corporation recognizes the overfunded and underfunded status of the plans in "accrued income and other assets" and "accrued expenses and other liabilities," respectively, on the consolidated balance sheets. |
n/a - not applicable
The accumulated benefit obligation exceeded the fair value of plan assets for the non-qualified defined benefit pension plan at December 31, 2015 and December 31, 2014. The accumulated benefit obligation exceeded the fair value of plan assets for the postretirement benefit plan at December 31, 2014.
NOTES TO CONSOLIDATED FINANCIAL STATEMENTS
Comerica Incorporated and Subsidiaries
The following table details the changes in plan assets and benefit obligations recognized in other comprehensive income (loss) for the year ended December 31, 2015.
|
| | | | | | | | | | | | | | | |
| | Defined Benefit Pension Plans | | | | |
| (in millions) | Qualified | | Non-Qualified | | Postretirement Benefit Plan | | Total |
| Actuarial (loss) gain arising during the period | $ | (77 | ) | | $ | 16 |
| | $ | 4 |
| | $ | (57 | ) |
| Prior service credit arising during the period | — |
| | — |
| | 3 |
| | 3 |
|
| Amortization of net actuarial loss | 59 |
| | 10 |
| | 1 |
| | 70 |
|
| Amortization of prior service cost (credit) | 4 |
| | (4 | ) | | 1 |
| | 1 |
|
| Total recognized in other comprehensive income (loss) | $ | (14 | ) | | $ | 22 |
| | $ | 9 |
| | $ | 17 |
|
Components of net periodic defined benefit cost and postretirement benefit cost, the actual return on plan assets and the weighted-average assumptions used were as follows.
|
| | | | | | | | | | | | | | | | | | | | | | | |
| | Defined Benefit Pension Plans |
| (dollar amounts in millions) | Qualified | | Non-Qualified |
| Years Ended December 31 | 2015 | | 2014 | | 2013 | | 2015 | | 2014 | | 2013 |
| Service cost | $ | 35 |
| | $ | 29 |
| | $ | 37 |
| | $ | 4 |
| | $ | 3 |
| | $ | 4 |
|
| Interest cost | 88 |
| | 88 |
| | 80 |
| | 10 |
| | 10 |
| | 9 |
|
| Expected return on plan assets | (159 | ) | | (131 | ) | | (132 | ) | | — |
| | — |
| | — |
|
| Amortization of prior service cost (credit) | 4 |
| | 6 |
| | 7 |
| | (4 | ) | | (4 | ) | | (6 | ) |
| Amortization of net loss | 59 |
| | 31 |
| | 76 |
| | 10 |
| | 7 |
| | 11 |
|
| Net periodic defined benefit cost | $ | 27 |
| | $ | 23 |
| | $ | 68 |
| | $ | 20 |
| | $ | 16 |
| | $ | 18 |
|
| Actual return on plan assets | $ | (73 | ) | | $ | 278 |
| | $ | 136 |
| | n/a |
| | n/a |
| | n/a |
|
| Actual rate of return on plan assets | (2.95 | )% | | 13.88 | % | | 7.05 | % | | n/a |
| | n/a |
| | n/a |
|
| Weighted-average assumptions used: | | | | | | | | | | | |
| Discount rate | 4.28 | % | | 5.17 | % | | 4.20 | % | | 4.28 | % | | 5.17 | % | | 4.20 | % |
| Expected long-term return on plan assets | 6.75 |
| | 6.75 |
| | 7.25 |
| | n/a |
| | n/a |
| | n/a |
|
| Rate of compensation increase | 3.75 |
| | 4.00 |
| | 4.00 |
| | 3.75 |
| | 4.00 |
| | 4.00 |
|
n/a - not applicable
|
| | | | | | | | | | | |
| (dollar amounts in millions) | Postretirement Benefit Plan |
| Years Ended December 31 | 2015 | | 2014 | | 2013 |
| Interest cost | $ | 3 |
| | $ | 3 |
| | $ | 3 |
|
| Expected return on plan assets | (4 | ) | | (4 | ) | | (4 | ) |
| Amortization of prior service cost | 1 |
| | 1 |
| | 1 |
|
| Amortization of net loss | 1 |
| | 1 |
| | 2 |
|
| Net periodic postretirement benefit cost | $ | 1 |
| | $ | 1 |
| | $ | 2 |
|
| Actual return on plan assets | $ | — |
| | $ | 3 |
| | $ | (2 | ) |
| Actual rate of return on plan assets | (0.53 | )% | | 4.62 | % | | (2.29 | )% |
| Weighted-average assumptions used: | | | | | |
| Discount rate | 3.99 | % | | 4.59 | % | | 3.81 | % |
| Expected long-term return on plan assets | 5.00 |
| | 5.00 |
| | 5.00 |
|
| Healthcare cost trend rate: | | | | | |
| Cost trend rate assumed | 7.00 |
| | 7.50 |
| | 8.00 |
|
| Rate to which the cost trend rate is assumed to decline (the ultimate trend rate) | 5.00 |
| | 5.00 |
| | 5.00 |
|
| Year that the rate reaches the ultimate trend rate | 2026 |
| | 2033 |
| | 2033 |
|
The expected long-term rate of return of plan assets is the average rate of return expected to be realized on funds invested or expected to be invested over the life of the plan, which has an estimated average life of approximately 15 years as of December 31, 2015. The expected long-term rate of return on plan assets is set after considering both long-term returns in the general market and long-term returns experienced by the assets in the plan. The returns on the various asset categories are blended to derive one long-term rate of return. The Corporation reviews its pension plan assumptions on an annual basis with its actuarial consultants to determine if assumptions are reasonable and adjusts the assumptions to reflect changes in future expectations.
NOTES TO CONSOLIDATED FINANCIAL STATEMENTS
Comerica Incorporated and Subsidiaries
The estimated portion of balances remaining in accumulated other comprehensive income (loss) that are expected to be recognized as a component of net periodic benefit cost in the year ended December 31, 2016 are as follows.
|
| | | | | | | | | | | | | | | |
| | Defined Benefit Pension Plans | | | | |
| (in millions) | Qualified | | Non-Qualified | | Postretirement Benefit Plan | | Total |
| Net loss | $ | 30 |
| | $ | 7 |
| | $ | 1 |
| | $ | 38 |
|
| Prior service cost (credit) | 4 |
| | (4 | ) | | — |
| | — |
|
Assumed healthcare cost trend rates have a significant effect on the amounts reported for the postretirement benefit plan. A one-percentage-point change in 2015 assumed healthcare and prescription drug cost trend rates would have the following effects.
|
| | | | | | | |
| | One-Percentage-Point |
| (in millions) | Increase | | Decrease |
| Effect on postretirement benefit obligation | $ | 4 |
| | $ | (3 | ) |
| Effect on total service and interest cost | — |
| | — |
|
Plan Assets
The Corporation's overall investment goals for the qualified defined benefit pension plan are to maintain a portfolio of assets of appropriate liquidity and diversification; to generate investment returns (net of operating costs) that are reasonably anticipated to maintain the plan's fully funded status or to reduce a funding deficit, after taking into account various factors, including reasonably anticipated future contributions and expense and the interest rate sensitivity of the plan's assets relative to that of the plan's liabilities; and to generate investment returns (net of operating costs) that meet or exceed a customized benchmark as defined in the plan investment policy. Derivative instruments are permissible for hedging and transactional efficiency, but only to the extent that the derivative use enhances the efficient execution of the plan's investment policy. The plan does not directly invest in securities issued by the Corporation and its subsidiaries. The Corporation's target allocations for plan investments are 36 percent to 56 percent equity securities and 44 percent to 64 percent fixed income, including cash. Equity securities include collective investment and mutual funds and common stock. Fixed income securities include U.S. Treasury and other U.S. government agency securities, mortgage-backed securities, corporate bonds and notes, municipal bonds, collateralized mortgage obligations and money market funds.
Fair Value Measurements
The Corporation's qualified defined benefit pension plan utilizes fair value measurements to record fair value adjustments and to determine fair value disclosures. The Corporation's qualified benefit pension plan categorizes investments recorded at fair value into a three-level hierarchy, based on the markets in which the investment are traded and the reliability of the assumptions used to determine fair value. Refer to Note 1 for a description of the three-level hierarchy.
Following is a description of the valuation methodologies and key inputs used to measure the fair value of the Corporation's qualified defined benefit pension plan investments, including an indication of the level of the fair value hierarchy in which the investments are classified.
Collective investment funds
Fair value measurement is based upon the net asset value (NAV) provided by the administrator of the fund. Collective investment fund NAVs are based primarily on observable inputs, generally the quoted prices for underlying assets owned by the fund, and are included in Level 2 of the fair value hierarchy.
Mutual funds
Fair value measurement is based upon the NAV provided by the administrator of the fund. Mutual fund NAVs are quoted in an active market exchange, such as the New York Stock Exchange, and are included in Level 1 of the fair value hierarchy.
Common stock
Fair value measurement is based upon the closing price quoted in an active market exchange, such as the New York Stock Exchange. Level 1 common stock includes domestic and foreign stock and real estate investment trusts.
U.S. Treasury and other U.S. government agency securities
Fair value measurement is based upon quoted prices in an active market exchange, such as the New York Stock Exchange. Level 1 securities include U.S. Treasury securities that are traded by dealers or brokers in active over-the-counter markets.
NOTES TO CONSOLIDATED FINANCIAL STATEMENTS
Comerica Incorporated and Subsidiaries
Corporate and municipal bonds and notes
Fair value measurement is based upon quoted prices of securities with similar characteristics or pricing models based on observable market data inputs, primarily interest rates, spreads and prepayment information. Level 2 securities include corporate bonds, municipal bonds, foreign bonds and foreign notes.
Collateralized mortgage obligations, U.S. government agency mortgage-backed securities and TBA mortgage-backed securities
Fair value measurement is based upon independent pricing models or other model-based valuation techniques such as the present value of future cash flows, adjusted for the security's credit rating, prepayment assumptions and other factors, such as credit loss and liquidity assumptions, and are included in Level 2 of the fair value hierarchy.
Private placements
Fair value is measured using the NAV provided by fund management as quoted prices in active markets are not available. Management considers additional discounts to the provided NAV for market and credit risk. Private placements are included in Level 3 of the fair value hierarchy.
Fair Values
The fair values of the Corporation's qualified defined benefit pension plan investments measured at fair value on a recurring basis at December 31, 2015 and 2014, by asset category and level within the fair value hierarchy, are detailed in the table below.
|
| | | | | | | | | | | | | | | |
| (in millions) | Total | | Level 1 | | Level 2 | | Level 3 |
| December 31, 2015 | | | | | | | |
| Cash equivalent securities: | | | | | | | |
| Mutual funds | $ | 43 |
| | $ | 43 |
| | $ | — |
| | $ | — |
|
| Equity securities: | | | | | | | |
| Collective investment funds | 527 |
| | — |
| | 527 |
| | — |
|
| Mutual funds | 69 |
| | 69 |
| | — |
| | — |
|
| Common stock | 480 |
| | 478 |
| | 2 |
| | — |
|
| Fixed income securities: | | | | | | | |
| U.S. Treasury and other U.S. government agency securities | 356 |
| | 356 |
| | — |
| | — |
|
| Corporate and municipal bonds and notes | 729 |
| | — |
| | 729 |
| | — |
|
| Collateralized mortgage obligations | 18 |
| | — |
| | 18 |
| | — |
|
| U.S. government agency mortgage-backed securities | 8 |
| | — |
| | 8 |
| | — |
|
| Private placements | 105 |
| | — |
| | — |
| | 105 |
|
| Other assets: | | | | | | | |
| TBA mortgage-backed securities | 12 |
| | — |
| | 12 |
| | — |
|
| Total investments at fair value | $ | 2,347 |
| | $ | 946 |
| | $ | 1,296 |
| | $ | 105 |
|
| December 31, 2014 | | | | | | | |
| Cash equivalent securities: | | | | | | | |
| Mutual funds | $ | 390 |
| | $ | 390 |
| | $ | — |
| | $ | — |
|
| Equity securities: | | | | | | | |
| Collective investment funds | 466 |
| | — |
| | 466 |
| | — |
|
| Mutual funds | 76 |
| | 76 |
| | — |
| | — |
|
| Common stock | 499 |
| | 499 |
| | — |
| | — |
|
| Fixed income securities: | | | | | | | |
| U.S. Treasury and other U.S. government agency securities | 359 |
| | 359 |
| | — |
| | — |
|
| Corporate and municipal bonds and notes | 659 |
| | — |
| | 659 |
| | — |
|
| Collateralized mortgage obligations | 9 |
| | — |
| | 9 |
| | — |
|
| Private placements | 73 |
| |
|
| | — |
| | 73 |
|
| Total investments at fair value | $ | 2,531 |
| | $ | 1,324 |
| | $ | 1,134 |
| | $ | 73 |
|
NOTES TO CONSOLIDATED FINANCIAL STATEMENTS
Comerica Incorporated and Subsidiaries
The table below provides a summary of changes in the Corporation's qualified defined benefit pension plan's Level 3 investments measured at fair value on a recurring basis for the years ended December 31, 2015 and 2014.
|
| | | | | | | | | | | | | | | | | | | | | | | |
| | Balance at Beginning of Period | | | | | | | | | | Balance at End of Period |
| | | Net Gains (Losses) | | | | | |
| (in millions) | | Realized | | Unrealized | | Purchases | | Sales | |
| Year Ended December 31, 2015 | | | | | | | | | | | |
| Private placements | $ | 73 |
| | $ | — |
| | $ | (5 | ) | | $ | 108 |
| | $ | (71 | ) | | $ | 105 |
|
| Year Ended December 31, 2014 | | | | | | | | | | | |
| Private placements | $ | 36 |
| | $ | 1 |
| | $ | 4 |
| | $ | 60 |
| | $ | (28 | ) | | $ | 73 |
|
There were no assets in the non-qualified defined benefit pension plan at December 31, 2015 and 2014. The postretirement benefit plan is fully invested in bank-owned life insurance policies. The fair value of bank-owned life insurance policies is based on the cash surrender values of the policies as reported by the insurance companies and is classified in Level 2 of the fair value hierarchy.
Cash Flows
The Corporation currently expects to make no employer contributions to the qualified and non-qualified defined benefit pension plans and postretirement benefit plan for the year ended December 31, 2016.
|
| | | | | | | | | | | |
| | Estimated Future Benefit Payments |
| (in millions) Years Ended December 31 | Qualified Defined Benefit Pension Plan | | Non-Qualified Defined Benefit Pension Plan | | Postretirement Benefit Plan (a) |
| 2016 | $ | 72 |
| | $ | 11 |
| | $ | 6 |
|
| 2017 | 77 |
| | 12 |
| | 6 |
|
| 2018 | 83 |
| | 12 |
| | 6 |
|
| 2019 | 89 |
| | 13 |
| | 6 |
|
| 2020 | 94 |
| | 13 |
| | 6 |
|
| 2021 - 2025 | 550 |
| | 70 |
| | 24 |
|
| |
| (a) | Estimated benefit payments in the postretirement benefit plan are net of estimated Medicare subsidies. |
Defined Contribution Plans
Substantially all of the Corporation's employees are eligible to participate in the Corporation's principal defined contribution plan (a 401(k) plan). Under this plan, the Corporation makes core matching cash contributions of 100 percent of the first 4 percent of qualified earnings contributed by employees (up to the current IRS compensation limit), invested based on employee investment elections. Employee benefits expense included expense for the plan of $22 million for each of the years ended December 31, 2015 and December 31, 2014, and $21 million for the year ended December 31, 2013.
The Corporation also provides a profit sharing plan for the benefit of substantially all employees who work at least 1,000 hours in a plan year and are not accruing a benefit in the defined benefit pension plan. Under the profit sharing plan, the Corporation makes an annual discretionary allocation to the individual account of each eligible employee ranging from 3 percent to 8 percent of annual compensation, determined based on combined age and years of service. The allocations are invested based on employee investment elections. The employee fully vests in the defined contribution pension plan after three years of service, at age 65 if still employed, or in the event of death while an employee. Before an employee is eligible to participate, the plan requires the equivalent of one year of service. The Corporation recognized $10 million in employee benefits expense for this plan for each of the years ended December 31, 2015 and December 31, 2014, and $7 million for the year ended December 31, 2013.
Deferred Compensation Plans
The Corporation offers optional deferred compensation plans under which certain employees may make an irrevocable election to defer incentive compensation and/or a portion of base salary until retirement or separation from the Corporation. The employee may direct deferred compensation into one or more deemed investment options. Although not required to do so, the Corporation invests actual funds into the deemed investments as directed by employees, resulting in a deferred compensation asset, recorded in "other short-term investments" on the consolidated balance sheets that offsets the liability to employees under the plan, recorded in "accrued expenses and other liabilities." The earnings from the deferred compensation asset are recorded in "interest on short-term investments" and "other noninterest income" and the related change in the liability to employees under the plan is recorded in "salaries" expense on the consolidated statements of income.
NOTES TO CONSOLIDATED FINANCIAL STATEMENTS
Comerica Incorporated and Subsidiaries
NOTE 18 - INCOME TAXES AND TAX-RELATED ITEMS
The provision for income taxes is calculated as the sum of income taxes due for the current year and deferred taxes. Income taxes due for the current year is computed by applying federal and state tax statutes to current year taxable income. Deferred taxes arise from temporary differences between the income tax basis and financial accounting basis of assets and liabilities. Tax-related interest and penalties and foreign taxes are then added to the tax provision.
The current and deferred components of the provision for income taxes were as follows:
|
| | | | | | | | | | | |
| (in millions) | | | | | |
| December 31 | 2015 | | 2014 | | 2013 |
| Current: | | | | | |
| Federal | $ | 275 |
| | $ | 127 |
| | $ | 242 |
|
| Foreign | 5 |
| | 6 |
| | 6 |
|
| State and local | 20 |
| | 14 |
| | 17 |
|
| Total current | 300 |
| | 147 |
| | 265 |
|
| Deferred: | | | | | |
| Federal | (68 | ) | | 123 |
| | (20 | ) |
| State and local | (3 | ) | | 7 |
| | — |
|
| Total deferred | (71 | ) | | 130 |
| | (20 | ) |
| Total | $ | 229 |
| | $ | 277 |
| | $ | 245 |
|
Income before income taxes of $750 million for the year ended December 31, 2015 included $34 million of foreign-source income.
The income tax provision on securities transactions for the year ended December 31, 2015 was a benefit of $1 million and there was no tax provision on securities transactions for the years ended December 31, 2014 and December 31, 2013.
The provision for income taxes does not reflect the tax effects of unrealized gains and losses on investment securities available-for-sale or the change in defined benefit pension and other postretirement plans adjustment included in accumulated other comprehensive loss. Refer to Note 14 for additional information on accumulated other comprehensive loss.
The income tax effects of transactions under the Corporation's share-based compensation plans reduced both shareholders' equity and deferred tax assets by $12 million, $11 million and $5 million in 2015, 2014, and 2013 respectively.
A reconciliation of expected income tax expense at the federal statutory rate to the Corporation's provision for income taxes and effective tax rate follows:
|
| | | | | | | | | | | | | | | | | | | | |
| (dollar amounts in millions) | 2015 | | 2014 | | 2013 |
| Years Ended December 31 | Amount | | Rate | | Amount | | Rate | | Amount | | Rate |
| Tax based on federal statutory rate | $ | 262 |
| | 35.0 | % | | $ | 305 |
| | 35.0 | % | | $ | 275 |
| | 35.0 | % |
| State income taxes | 10 |
| | 1.3 |
| | 13 |
| | 1.5 |
| | 11 |
| | 1.4 |
|
| Affordable housing and historic credits | (22 | ) | | (2.9 | ) | | (24 | ) | | (2.8 | ) | | (21 | ) | | (2.6 | ) |
| Bank-owned life insurance | (15 | ) | | (2.0 | ) | | (15 | ) | | (1.7 | ) | | (15 | ) | | (1.9 | ) |
| Other changes in unrecognized tax benefits | — |
| | — |
| | 2 |
| | 0.2 |
| | (2 | ) | | (0.2 | ) |
| Lease termination transactions | (5 | ) | | (0.7 | ) | | — |
| | — |
| | — |
| | — |
|
| Tax-related interest and penalties | 1 |
| | 0.1 |
| | (3 | ) | | (0.3 | ) | | (1 | ) | | (0.1 | ) |
| Other | (2 | ) | | (0.3 | ) | | (1 | ) | | (0.1 | ) | | (2 | ) | | (0.4 | ) |
| Provision for income taxes | $ | 229 |
| | 30.5 | % | | $ | 277 |
| | 31.8 | % | | $ | 245 |
| | 31.2 | % |
The liability for tax-related interest and penalties included in "accrued expenses and other liabilities" on the consolidated balance sheets was $3 million and $2 million at December 31, 2015 and 2014, respectively.
In the ordinary course of business, the Corporation enters into certain transactions that have tax consequences. From time to time, the Internal Revenue Service (IRS) may review and/or challenge specific interpretive tax positions taken by the Corporation with respect to those transactions. The Corporation believes that its tax returns were filed based upon applicable statutes, regulations and case law in effect at the time of the transactions. The IRS, an administrative authority or a court, if presented with the transactions, could disagree with the Corporation's interpretation of the tax law.
NOTES TO CONSOLIDATED FINANCIAL STATEMENTS
Comerica Incorporated and Subsidiaries
A reconciliation of the beginning and ending amount of net unrecognized tax benefits follows:
|
| | | | | | | | | | | |
| (in millions) | 2015 | | 2014 | | 2013 |
| Balance at January 1 | $ | 14 |
| | $ | 11 |
| | $ | 42 |
|
| Increases as a result of tax positions taken during a prior period | 8 |
| | 3 |
| | — |
|
| Decrease related to settlements with tax authorities | — |
| | — |
| | (31 | ) |
| Balance at December 31 | $ | 22 |
| | $ | 14 |
| | $ | 11 |
|
The Corporation anticipates that it is reasonably possible that settlements with tax authorities will result in an $8 million decrease in net unrecognized tax benefits within the next twelve months.
After consideration of the effect of the federal tax benefit available on unrecognized state tax benefits, the total amount of unrecognized tax benefits that, if recognized, would affect the Corporation's effective tax rate was approximately $4 million at December 31, 2015 and $2 million at December 31, 2014.
The following tax years for significant jurisdictions remain subject to examination as of December 31, 2015:
|
| |
| Jurisdiction | Tax Years |
| Federal | 2010-2014 |
| California | 2003-2014 |
Based on current knowledge and probability assessment of various potential outcomes, the Corporation believes that current tax reserves are adequate, and the amount of any potential incremental liability arising is not expected to have a material adverse effect on the Corporation's consolidated financial condition or results of operations. Probabilities and outcomes are reviewed as events unfold, and adjustments to the reserves are made when necessary.
The principal components of deferred tax assets and liabilities were as follows:
|
| | | | | | | |
| (in millions) | | | |
| December 31 | 2015 | | 2014 |
| Deferred tax assets: | | | |
| Allowance for loan losses | $ | 223 |
| | $ | 208 |
|
| Deferred compensation | 113 |
| | 123 |
|
| Loan purchase accounting adjustments | 2 |
| | 5 |
|
| Deferred loan origination fees and costs | 24 |
| | 28 |
|
| Other temporary differences, net | 67 |
| | 44 |
|
| Total deferred tax asset before valuation allowance | 429 |
| | 408 |
|
| Valuation allowance | (3 | ) | | — |
|
| Total deferred tax assets | 426 |
| | 408 |
|
| Deferred tax liabilities: | | | |
| Lease financing transactions | (183 | ) | | (206 | ) |
| Defined benefit plans | (32 | ) | | (38 | ) |
| Net unrealized gains on investment securities available-for-sale | (5 | ) | | (21 | ) |
| Allowance for depreciation | (7 | ) | | (13 | ) |
| Total deferred tax liabilities | (227 | ) | | (278 | ) |
| Net deferred tax asset | $ | 199 |
| | $ | 130 |
|
Included in deferred tax assets at December 31, 2015 were $5 million of state net operating loss carryforwards, which expire between 2016 and 2026. The Corporation believes it is more likely than not that the benefit from certain of these state net operating loss carryforwards will not be realized and, accordingly, established a valuation allowance of $3 million at December 31, 2015. There was no valuation allowance on deferred tax assets at December 31, 2014. The determination regarding valuation allowances was based on available evidence of loss carryback capacity, projected future reversals of existing taxable temporary differences and assumptions made regarding future events. For further information on the Corporation's valuation policy for deferred tax assets, refer to Note 1.
NOTES TO CONSOLIDATED FINANCIAL STATEMENTS
Comerica Incorporated and Subsidiaries
NOTE 19 - TRANSACTIONS WITH RELATED PARTIES
The Corporation's banking subsidiaries had, and expect to have in the future, transactions with the Corporation's directors and executive officers, companies with which these individuals are associated, and certain related individuals. Such transactions were made in the ordinary course of business and included extensions of credit, leases and professional services. With respect to extensions of credit, all were made on substantially the same terms, including interest rates and collateral, as those prevailing at the same time for comparable transactions with other customers and did not, in management's opinion, involve more than normal risk of collectibility or present other unfavorable features. The aggregate amount of loans attributable to persons who were related parties at December 31, 2015, totaled $79 million at the beginning of 2015 and $121 million at the end of 2015. During 2015, new loans to related parties aggregated $453 million and repayments totaled $411 million.
NOTE 20 - REGULATORY CAPITAL AND RESERVE REQUIREMENTS
Reserves required to be maintained and/or deposited with the FRB are classified in interest-bearing deposits with banks. These reserve balances vary, depending on the level of customer deposits in the Corporation's banking subsidiaries. The average required reserve balances were $473 million and $430 million for the years ended December 31, 2015 and 2014, respectively.
Banking regulations limit the transfer of assets in the form of dividends, loans or advances from the bank subsidiaries to the parent company. Under the most restrictive of these regulations, the aggregate amount of dividends which can be paid to the parent company, with prior approval from bank regulatory agencies, approximated $398 million at January 1, 2016, plus 2016 net profits. Substantially all the assets of the Corporation's banking subsidiaries are restricted from transfer to the parent company of the Corporation in the form of loans or advances.
The Corporation's subsidiary banks declared dividends of $437 million, $380 million and $480 million in 2015, 2014 and 2013, respectively.
The Corporation and its U.S. banking subsidiaries are subject to various regulatory capital requirements administered by federal and state banking agencies. The U.S. adoption of the Basel III regulatory capital framework (Basel III) became effective for the Corporation on January 1, 2015; December 31, 2014 data is based on Basel I rules. Basel III sets forth two comprehensive methodologies for calculating risk-weighted assets (RWA), a standardized approach and an advanced approach. The Corporation and its U.S. banking subsidiaries are subject to the standardized approach under the rules. Under the standardized approach, RWA is generally based on supervisory risk-weightings which vary by counterparty type and asset class. Under the Basel III standardized approach, capital is required for credit risk RWA, to cover the risk of unexpected losses due to failure of a customer or counterparty to meet its financial obligations in accordance with contractual terms; and if trading assets and liabilities exceed certain thresholds, capital is also required for market risk RWA, to cover the risk of losses due to adverse market movements or from position-specific factors.
Under Basel III, there are three categories of risk-based capital: CET1 capital, Tier 1 capital and Tier 2 capital. CET1 capital predominantly includes common shareholders' equity, less certain deductions for goodwill, intangible assets and deferred tax assets that arise from net operating losses and tax credit carry-forwards. Additionally, the Corporation has elected to permanently exclude capital in accumulated other comprehensive income related to debt and equity securities classified as available-for-sale as well as for defined benefit postretirement plans from CET1, an option available to standardized approach entities under Basel III. Tier 1 capital incrementally includes noncumulative perpetual preferred stock. Tier 2 capital includes Tier 1 capital as well as subordinated debt qualifying as Tier 2 and qualifying allowance for credit losses. Total capital is Tier 1 capital plus Tier 2 capital.
Quantitative measures established by regulation to ensure capital adequacy require the maintenance of minimum amounts and ratios of CET1, Tier 1 and total capital (as defined in the regulations) to average and/or risk-weighted assets. Failure to meet minimum capital requirements can initiate certain mandatory and possibly additional discretionary actions by regulators that, if undertaken, could have a direct material effect on the Corporation's financial statements. At December 31, 2015 and 2014, the Corporation and its U.S. banking subsidiaries exceeded the ratios required for an institution to be considered "well capitalized" For U.S. banking subsidiaries, those requirements were total risk-based capital, Tier 1 risk-based capital, CET1 risk-based capital and leverage ratios greater than 10 percent, 8 percent, 6.5 percent and 5 percent, respectively, at December 31, 2015; and total risk-based capital, Tier 1 risk-based capital and leverage ratios greater than 10 percent, 6 percent and 5 percent, respectively, at December 31, 2014. For the Corporation, requirements to be considered "well capitalized" were total risk-based capital and Tier 1 risk-based capital ratios greater than 10 percent and 6 percent, respectively, at December 31, 2015 and 2014. There have been no conditions or events since December 31, 2015 that management believes have changed the capital adequacy classification of the Corporation or its U.S. banking subsidiaries.
NOTES TO CONSOLIDATED FINANCIAL STATEMENTS
Comerica Incorporated and Subsidiaries
The following is a summary of the capital position of the Corporation and Comerica Bank, its principal banking subsidiary.
|
| | | | | | | |
| (dollar amounts in millions) | Comerica Incorporated (Consolidated) | | Comerica Bank |
| December 31, 2015 | | | |
| CET1 capital (minimum $3.1 billion (Consolidated)) | $ | 7,350 |
| | $ | 7,081 |
|
| Tier 1 capital (minimum-$4.2 billion (Consolidated)) | 7,350 |
| | 7,081 |
|
| Total capital (minimum-$5.6 billion (Consolidated)) | 8,852 |
| | 8,366 |
|
| Risk-weighted assets | 69,731 |
| | 69,438 |
|
| Average assets (fourth quarter) | 71,943 |
| | 71,629 |
|
| CET1 capital to risk-weighted assets (minimum-4.5%) | 10.54 | % | | 10.20 | % |
| Tier 1 capital to risk-weighted assets (minimum-6.0%) | 10.54 |
| | 10.20 |
|
| Total capital to risk-weighted assets (minimum-8.0%) | 12.69 |
| | 12.05 |
|
| Tier 1 capital to average assets (minimum-4.0%) | 10.22 |
| | 9.89 |
|
| December 31, 2014 | | | |
| Tier 1 capital (minimum-$2.7 billion (Consolidated)) | $ | 7,169 |
| | $ | 7,051 |
|
| Total capital (minimum-$5.5 billion (Consolidated)) | 8,543 |
| | 8,175 |
|
| Risk-weighted assets | 68,273 |
| | 68,037 |
|
| Average assets (fourth quarter) | 69,284 |
| | 69,092 |
|
| Tier 1 capital to risk-weighted assets (minimum-4.0%) | 10.50 | % | | 10.36 | % |
| Total capital to risk-weighted assets (minimum-8.0%) | 12.51 |
| | 12.02 |
|
| Tier 1 capital to average assets (minimum-3.0%) | 10.35 |
| | 10.20 |
|
NOTE 21 - CONTINGENT LIABILITIES
Legal Proceedings
Comerica Bank, a wholly owned subsidiary of the Corporation, was named in November 2011 as a third-party defendant in Butte Local Development v. Masters Group v. Comerica Bank ("the case"), for lender liability. The case was tried in January 2014, in the Montana Second District Judicial Court for Silver Bow County in Butte, Montana ("the court"). On January 17, 2014, a jury awarded Masters $52 million against the Bank. On July 1, 2015, after an appeal filed by the Corporation, the Montana Supreme court ("the court") reversed the judgment against the Corporation and remanded the case for a new trial with instructions that Michigan law should apply. The court also reversed punitive and consequential damages previously awarded by the jury. The Corporation believes it has meritorious defenses to the remaining claims in this case and intends to continue to defend itself vigorously. Management believes that current reserves related to this case are adequate in the event of a negative outcome.
The Corporation and certain of its subsidiaries are subject to various other pending or threatened legal proceedings arising out of the normal course of business or operations. The Corporation believes it has meritorious defenses to the claims asserted against it in its other currently outstanding legal proceedings and, with respect to such legal proceedings, intends to continue to defend itself vigorously, litigating or settling cases according to management's judgment as to what is in the best interests of the Corporation and its shareholders. Settlement may result from the Corporation's determination that it may be more prudent financially to settle, rather than litigate, and should not be regarded as an admission of liability. On at least a quarterly basis, the Corporation assesses its potential liabilities and contingencies in connection with outstanding legal proceedings utilizing the latest information available. On a case-by-case basis, reserves are established for those legal claims for which it is probable that a loss will be incurred either as a result of a settlement or judgment, and the amount of such loss can be reasonably estimated. The actual costs of resolving these claims may be substantially higher or lower than the amounts reserved. Based on current knowledge, and after consultation with legal counsel, management believes that current reserves are adequate, and the amount of any incremental liability arising from these matters is not expected to have a material adverse effect on the Corporation's consolidated financial condition, consolidated results of operations or consolidated cash flows. Legal fees of $21 million for the year ended December 31, 2015, and $24 million for each of the years ended December 31, 2014 and 2013, were included in "other noninterest expenses" on the consolidated statements of income.
For matters where a loss is not probable, the Corporation has not established legal reserves. The Corporation believes the estimate of the aggregate range of reasonably possible losses, in excess of reserves established, for all legal proceedings in which it is involved is from zero to approximately $33 million at December 31, 2015. This estimated aggregate range of reasonably possible losses is based upon currently available information for those proceedings in which the Corporation is involved, taking into account the Corporation's best estimate of such losses for those cases for which such estimate can be made. For certain cases, the Corporation does not believe that an estimate can currently be made. The Corporation's estimate involves significant judgment,
NOTES TO CONSOLIDATED FINANCIAL STATEMENTS
Comerica Incorporated and Subsidiaries
given the varying stages of the proceedings (including the fact that many are currently in preliminary stages), the existence in certain proceedings of multiple defendants (including the Corporation) whose share of liability has yet to be determined, the numerous yet-unresolved issues in many of the proceedings (including issues regarding class certification and the scope of many of the claims) and the attendant uncertainty of the various potential outcomes of such proceedings. Accordingly, the Corporation's estimate will change from time to time, and actual losses may be more or less than the current estimate.
In the event of unexpected future developments, it is possible that the ultimate resolution of these matters, if unfavorable, may be material to the Corporation's consolidated financial condition, consolidated results of operations or consolidated cash flows.
For information regarding income tax contingencies, refer to Note 18.
NOTE 22 - BUSINESS SEGMENT INFORMATION
The Corporation has strategically aligned its operations into three major business segments: the Business Bank, the Retail Bank and Wealth Management. These business segments are differentiated based on the type of customer and the related products and services provided. In addition to the three major business segments, the Finance Division is also reported as a segment. Business segment results are produced by the Corporation's internal management accounting system. This system measures financial results based on the internal business unit structure of the Corporation. The performance of the business segments is not comparable with the Corporation's consolidated results and is not necessarily comparable with similar information for any other financial institution. Additionally, because of the interrelationships of the various segments, the information presented is not indicative of how the segments would perform if they operated as independent entities. The management accounting system assigns balance sheet and income statement items to each business segment using certain methodologies, which are regularly reviewed and refined. From time to time, the Corporation may make reclassifications among the segments to more appropriately reflect management's current view of the segments, and methodologies may be modified as the management accounting system is enhanced and changes occur in the organizational structure and/or product lines. For comparability purposes, amounts in all periods are based on business unit structure and methodologies in effect at December 31, 2015.
Net interest income for each business segment is the total of interest income generated by earning assets less interest expense on interest-bearing liabilities plus the net impact from associated internal funds transfer pricing (FTP) funding credits and charges. The FTP methodology provides the business segments credits for deposits and other funds provided and charges the business segments for loans and other assets utilizing funds. This credit or charge is based on matching stated or implied maturities for these assets and liabilities. The FTP credit provided for deposits reflects the long-term value of deposits generated based on their implied maturity. The FTP charge for funding assets reflects a matched cost of funds based on the pricing and term characteristics of the assets. For acquired loans and deposits, matched maturity funding is determined based on origination date. Accordingly, the FTP process reflects the transfer of interest rate risk exposures to the Treasury group within the Finance segment, where such exposures are centrally managed. The allowance for loan losses is allocated to the business segments based on the methodology used to estimate the consolidated allowance for loan losses described in Note 1. The related provision for loan losses is assigned based on the amount necessary to maintain an allowance for loan losses appropriate for each business segment. Noninterest income and expenses directly attributable to a line of business are assigned to that business segment. Direct expenses incurred by areas whose services support the overall Corporation are allocated to the business segments as follows: product processing expenditures are allocated based on standard unit costs applied to actual volume measurements; administrative expenses are allocated based on estimated time expended; and corporate overhead is assigned 50 percent based on the ratio of the business segment's noninterest expenses to total noninterest expenses incurred by all business segments and 50 percent based on the ratio of the business segment's attributed equity to total attributed equity of all business segments. Equity is attributed based on credit, operational and interest rate risks. Most of the equity attributed relates to credit risk, which is determined based on the credit score and expected remaining life of each loan, letter of credit and unused commitment recorded in the business segments. Operational risk is allocated based on loans and letters of credit, deposit balances, non-earning assets, trust assets under management, certain noninterest income items, and the nature and extent of expenses incurred by business units. Virtually all interest rate risk is assigned to Finance, as are the Corporation's hedging activities.
In 2014, the Corporation enhanced the approach used to determine the standard reserve factors used in estimating the allowance for credit losses, which had the effect of capturing certain elements in the standard reserve component that had formerly been included in the qualitative assessment. The impact of the change was largely neutral to the total allowance for loan losses at June 30, 2014. However, because standard reserves are allocated to the segments at the loan level, while qualitative reserves are allocated at the portfolio level, the impact of the methodology change on the allowance of each segment reflected the characteristics of the individual loans within each segment's portfolio, causing segment reserves to increase or decrease accordingly. As a result, the 2014 provision for credit losses within each segment is not comparable to 2013 amounts.
NOTES TO CONSOLIDATED FINANCIAL STATEMENTS
Comerica Incorporated and Subsidiaries
Effective January 1, 2015, changes to the terms of card program contract resulted in a change to the presentation of the related revenue and expenses. In 2015, under the current contract, total revenue before related expenses was recorded in noninterest income, and related expenses were recorded in noninterest expense; whereas in 2014, under the terms of the prior contract, revenue was recorded in noninterest income net of the related expenses. The effect of this change was an increase of $181 million to both noninterest income and noninterest expenses in the Business Bank and Other Markets in 2015.
The following discussion provides information about the activities of each business segment. A discussion of the financial results and the factors impacting 2015 performance can be found in the section entitled "Business Segments" in the financial review.
The Business Bank meets the needs of middle market businesses, multinational corporations and governmental entities by offering various products and services, including commercial loans and lines of credit, deposits, cash management, capital market products, international trade finance, letters of credit, foreign exchange management services and loan syndication services.
The Retail Bank includes small business banking and personal financial services, consisting of consumer lending, consumer deposit gathering and mortgage loan origination. In addition to a full range of financial services provided to small business customers, this business segment offers a variety of consumer products, including deposit accounts, installment loans, credit cards, student loans, home equity lines of credit and residential mortgage loans.
Wealth Management offers products and services consisting of fiduciary services, private banking, retirement services, investment management and advisory services, investment banking and brokerage services. This business segment also offers the sale of annuity products, as well as life, disability and long-term care insurance products.
The Finance segment includes the Corporation's securities portfolio and asset and liability management activities. This segment is responsible for managing the Corporation's funding, liquidity and capital needs, performing interest sensitivity analysis and executing various strategies to manage the Corporation's exposure to liquidity, interest rate risk and foreign exchange risk.
The Other category includes the income and expense impact of equity and cash, tax benefits not assigned to specific business segments, charges of an unusual or infrequent nature that are not reflective of the normal operations of the business segments and miscellaneous other expenses of a corporate nature.
NOTES TO CONSOLIDATED FINANCIAL STATEMENTS
Comerica Incorporated and Subsidiaries
Business segment financial results are as follows:
|
| | | | | | | | | | | | | | | | | | | | | | | |
| (dollar amounts in millions) | Business Bank | | Retail Bank | | Wealth Management | | Finance | | Other | | Total |
| Year Ended December 31, 2015 |
| Earnings summary: | | | | | | | | | | | |
| Net interest income (expense) (FTE) | $ | 1,511 |
| | $ | 626 |
| | $ | 179 |
| | $ | (632 | ) | | $ | 9 |
| | $ | 1,693 |
|
| Provision for credit losses | 158 |
| | 8 |
| | (20 | ) | | — |
| | 1 |
| | 147 |
|
| Noninterest income | 574 |
| | 185 |
| | 235 |
| | 57 |
| | (1 | ) | | 1,050 |
|
| Noninterest expenses | 786 |
| | 734 |
| | 305 |
| | 9 |
| | 8 |
| | 1,842 |
|
| Provision (benefit) for income taxes (FTE) | 376 |
| | 22 |
| | 44 |
| | (209 | ) | | — |
| | 233 |
|
| Net income (loss) | $ | 765 |
| | $ | 47 |
| | $ | 85 |
| | $ | (375 | ) | | $ | (1 | ) | | $ | 521 |
|
| Net loan charge-offs (recoveries) | $ | 89 |
| | $ | 28 |
| | $ | (17 | ) | | $ | — |
| | $ | — |
| | $ | 100 |
|
| | | | | | | | | | | | |
| Selected average balances: | | | | | | | | | | | |
| Assets | $ | 38,942 |
| | $ | 6,474 |
| | $ | 5,153 |
| | $ | 12,180 |
| | $ | 7,498 |
| | $ | 70,247 |
|
| Loans | 37,883 |
| | 5,792 |
| | 4,953 |
| | — |
| | — |
| | 48,628 |
|
| Deposits | 30,882 |
| | 22,876 |
| | 4,151 |
| | 149 |
| | 268 |
| | 58,326 |
|
| | | | | | | | | | | | |
| Statistical data: | | | | | | | | | | | |
| Return on average assets (a) | 1.96 | % | | 0.20 | % | | 1.65 | % | | N/M |
| | N/M |
| | 0.74 | % |
| Efficiency ratio (b) | 37.71 |
| | 90.37 |
| | 73.23 |
| | N/M |
| | N/M |
| | 67.10 |
|
|
| | | | | | | | | | | | | | | | | | | | | | | |
| (dollar amounts in millions) | Business Bank | | Retail Bank | | Wealth Management | | Finance | | Other | | Total |
| Year Ended December 31, 2014 |
| Earnings summary: | | | | | | | | | | | |
| Net interest income (expense) (FTE) | $ | 1,507 |
| | $ | 606 |
| | $ | 181 |
| | $ | (662 | ) | | $ | 27 |
| | $ | 1,659 |
|
| Provision for credit losses | 56 |
| | (7 | ) | | (21 | ) | | — |
| | (1 | ) | | 27 |
|
| Noninterest income | 392 |
| | 169 |
| | 241 |
| | 60 |
| | 6 |
| | 868 |
|
| Noninterest expenses | 589 |
| | 715 |
| | 310 |
| | (21 | ) | | 33 |
| | 1,626 |
|
| Provision (benefit) for income taxes (FTE) | 432 |
| | 23 |
| | 49 |
| | (224 | ) | | 1 |
| | 281 |
|
| Net income (loss) | $ | 822 |
| | $ | 44 |
| | $ | 84 |
| | $ | (357 | ) | | $ | — |
| | $ | 593 |
|
| Net loan charge-offs (recoveries) | $ | 16 |
| | $ | 10 |
| | $ | (1 | ) | | $ | — |
| | $ | — |
| | $ | 25 |
|
| | | | | | | | | | | | |
| Selected average balances: | | | | | | | | | | | |
| Assets | $ | 37,178 |
| | $ | 6,255 |
| | $ | 4,988 |
| | $ | 11,359 |
| | $ | 6,556 |
| | $ | 66,336 |
|
| Loans | 36,198 |
| | 5,585 |
| | 4,805 |
| | — |
| | — |
| | 46,588 |
|
| Deposits | 28,526 |
| | 21,967 |
| | 3,805 |
| | 233 |
| | 253 |
| | 54,784 |
|
| | | | | | | | | | | | |
| Statistical data: | | | | | | | | | | | |
| Return on average assets (a) | 2.21 | % | | 0.19 | % | | 1.69 | % | | N/M |
| | N/M |
| | 0.89 | % |
| Efficiency ratio (b) | 30.97 |
| | 92.10 |
| | 73.67 |
| | N/M |
| | N/M |
| | 64.31 |
|
(Table continues on following page)
NOTES TO CONSOLIDATED FINANCIAL STATEMENTS
Comerica Incorporated and Subsidiaries
|
| | | | | | | | | | | | | | | | | | | | | | | |
| (dollar amounts in millions) | Business Bank | | Retail Bank | | Wealth Management | | Finance | | Other | | Total |
| Year Ended December 31, 2013 |
| Earnings summary: | | | | | | | | | | | |
| Net interest income (expense) (FTE) | $ | 1,495 |
| | $ | 622 |
| | $ | 180 |
| | $ | (653 | ) | | $ | 31 |
| | $ | 1,675 |
|
| Provision for credit losses | 42 |
| | 24 |
| | (17 | ) | | — |
| | (3 | ) | | 46 |
|
| Noninterest income | 398 |
| | 176 |
| | 235 |
| | 61 |
| | 12 |
| | 882 |
|
| Noninterest expenses | 642 |
| | 719 |
| | 309 |
| | 10 |
| | 42 |
| | 1,722 |
|
| Provision (benefit) for income taxes (FTE) | 410 |
| | 19 |
| | 44 |
| | (226 | ) | | 1 |
| | 248 |
|
| Net income (loss) | $ | 799 |
| | $ | 36 |
| | $ | 79 |
| | $ | (376 | ) | | $ | 3 |
| | $ | 541 |
|
| Net loan charge-offs | $ | 32 |
| | $ | 33 |
| | $ | 8 |
| | $ | — |
| | $ | — |
| | $ | 73 |
|
| | | | | | | | | | | | |
| Selected average balances: | | | | | | | | | | | |
| Assets | $ | 35,326 |
| | $ | 6,185 |
| | $ | 4,799 |
| | $ | 11,422 |
| | $ | 6,201 |
| | $ | 63,933 |
|
| Loans | 34,268 |
| | 5,500 |
| | 4,644 |
| | — |
| | — |
| | 44,412 |
|
| Deposits | 26,131 |
| | 21,513 |
| | 3,547 |
| | 312 |
| | 208 |
| | 51,711 |
|
| | | | | | | | | | | | |
| Statistical data: | | | | | | | | | | | |
| Return on average assets (a) | 2.26 | % | | 0.16 | % | | 1.64 | % | | N/M |
| | N/M |
| | 0.85 | % |
| Efficiency ratio (b) | 33.89 |
| | 89.77 |
| | 74.86 |
| | N/M |
| | N/M |
| | 67.32 |
|
| |
| (a) | Return on average assets is calculated based on the greater of average assets or average liabilities and attributed equity. |
(b) Noninterest expenses as a percentage of the sum of net interest income (FTE) and noninterest income excluding net securities gains.
FTE – Fully Taxable Equivalent
N/M – not meaningful
The Corporation operates in three primary markets - Texas, California, and Michigan, as well as in Arizona and Florida, with select businesses operating in several other states, and in Canada and Mexico. The Corporation produces market segment results for the Corporation's three primary geographic markets as well as Other Markets. Other Markets includes Florida, Arizona, the International Finance division and businesses with a national perspective. The Finance & Other category includes the Finance segment and the Other category as previously described. Market segment results are provided as supplemental information to the business segment results and may not meet all operating segment criteria as set forth in GAAP. For comparability purposes, amounts in all periods are based on market segments and methodologies in effect at December 31, 2015.
A discussion of the financial results and the factors impacting performance can be found in the section entitled "Market Segments" in the financial review.
Market segment financial results are as follows:
|
| | | | | | | | | | | | | | | | | | | | | | | |
| (dollar amounts in millions) | Michigan | | California | | Texas | | Other Markets | | Finance & Other | | Total |
| Year Ended December 31, 2015 |
| Earnings summary: | | | | | | | | | | | |
| Net interest income (expense) (FTE) | $ | 720 |
| | $ | 736 |
| | $ | 521 |
| | $ | 339 |
| | $ | (623 | ) | | $ | 1,693 |
|
| Provision for credit losses | (27 | ) | | 17 |
| | 131 |
| | 25 |
| | 1 |
| | 147 |
|
| Noninterest income | 333 |
| | 153 |
| | 133 |
| | 375 |
| | 56 |
| | 1,050 |
|
| Noninterest expenses | 598 |
| | 408 |
| | 389 |
| | 430 |
| | 17 |
| | 1,842 |
|
| Provision (benefit) for income taxes (FTE) | 157 |
| | 167 |
| | 55 |
| | 63 |
| | (209 | ) | | 233 |
|
| Net income (loss) | $ | 325 |
| | $ | 297 |
| | $ | 79 |
| | $ | 196 |
| | $ | (376 | ) | | $ | 521 |
|
| Net loan charge-offs | $ | 8 |
| | $ | 18 |
| | $ | 45 |
| | $ | 29 |
| | $ | — |
| | $ | 100 |
|
| | | | | | | | | | | | |
| Selected average balances: | | | | | | | | | | | |
| Assets | $ | 13,761 |
| | $ | 16,881 |
| | $ | 11,778 |
| | $ | 8,149 |
| | $ | 19,678 |
| | $ | 70,247 |
|
| Loans | 13,180 |
| | 16,613 |
| | 11,168 |
| | 7,667 |
| | — |
| | 48,628 |
|
| Deposits | 21,872 |
| | 17,763 |
| | 10,882 |
| | 7,392 |
| | 417 |
| | 58,326 |
|
| | | | | | | | | | | | |
| Statistical data: | | | | | | | | | | | |
| Return on average assets (a) | 1.42 | % | | 1.57 | % | | 0.63 | % | | 2.41 | % | | N/M |
| | 0.74 | % |
| Efficiency ratio (b) | 56.72 |
| | 45.96 |
| | 59.52 |
| | 59.97 |
| | N/M |
| | 67.10 |
|
(Table continues on following page)
NOTES TO CONSOLIDATED FINANCIAL STATEMENTS
Comerica Incorporated and Subsidiaries
|
| | | | | | | | | | | | | | | | | | | | | | | |
| (dollar amounts in millions) | Michigan | | California | | Texas | | Other Markets | | Finance & Other | | Total |
| Year Ended December 31, 2014 |
| Earnings summary: | | | | | | | | | | | |
| Net interest income (expense) (FTE) | $ | 718 |
| | $ | 722 |
| | $ | 542 |
| | $ | 312 |
| | $ | (635 | ) | | $ | 1,659 |
|
| Provision for credit losses | (32 | ) | | 28 |
| | 50 |
| | (18 | ) | | (1 | ) | | 27 |
|
| Noninterest income | 345 |
| | 147 |
| | 142 |
| | 168 |
| | 66 |
| | 868 |
|
| Noninterest expenses | 643 |
| | 398 |
| | 370 |
| | 203 |
| | 12 |
| | 1,626 |
|
| Provision (benefit) for income taxes (FTE) | 164 |
| | 169 |
| | 96 |
| | 75 |
| | (223 | ) | | 281 |
|
| Net income (loss) | $ | 288 |
| | $ | 274 |
| | $ | 168 |
| | $ | 220 |
| | $ | (357 | ) | | $ | 593 |
|
| Net loan charge-offs (recoveries) | $ | 8 |
| | $ | 22 |
| | $ | 9 |
| | $ | (14 | ) | | $ | — |
| | $ | 25 |
|
| | | | | | | | | | | | |
| Selected average balances: | | | | | | | | | | | |
| Assets | $ | 13,749 |
| | $ | 15,668 |
| | $ | 11,645 |
| | $ | 7,359 |
| | $ | 17,915 |
| | $ | 66,336 |
|
| Loans | 13,336 |
| | 15,390 |
| | 10,954 |
| | 6,908 |
| | — |
| | 46,588 |
|
| Deposits | 21,023 |
| | 16,142 |
| | 10,764 |
| | 6,369 |
| | 486 |
| | 54,784 |
|
| | | | | | | | | | | | |
| Statistical data: | | | | | | | | | | | |
| Return on average assets (a) | 1.31 | % | | 1.59 | % | | 1.39 | % | | 3.00 | % | | N/M |
| | 0.89 | % |
| Efficiency ratio (b) | 60.48 |
| | 45.79 |
| | 54.00 |
| | 42.30 |
| | N/M |
| | 64.31 |
|
|
| | | | | | | | | | | | | | | | | | | | | | | |
| (dollar amounts in millions) | Michigan | | California | | Texas | | Other Markets | | Finance & Other | | Total |
| Year Ended December 31, 2013 |
| Earnings summary: | | | | | | | | | | | |
| Net interest income (expense) (FTE) | $ | 751 |
| | $ | 692 |
| | $ | 541 |
| | $ | 313 |
| | $ | (622 | ) | | $ | 1,675 |
|
| Provision for credit losses | (11 | ) | | 17 |
| | 35 |
| | 8 |
| | (3 | ) | | 46 |
|
| Noninterest income | 343 |
| | 151 |
| | 142 |
| | 173 |
| | 73 |
| | 882 |
|
| Noninterest expenses | 713 |
| | 396 |
| | 364 |
| | 197 |
| | 52 |
| | 1,722 |
|
| Provision (benefit) for income taxes (FTE) | 140 |
| | 160 |
| | 101 |
| | 72 |
| | (225 | ) | | 248 |
|
| Net income (loss) | $ | 252 |
| | $ | 270 |
| | $ | 183 |
| | $ | 209 |
| | $ | (373 | ) | | $ | 541 |
|
| Net loan charge-offs | $ | 6 |
| | $ | 27 |
| | $ | 20 |
| | $ | 20 |
| | $ | — |
| | $ | 73 |
|
| | | | | | | | | | | | |
| Selected average balances: | | | | | | | | | | | |
| Assets | $ | 13,879 |
| | $ | 14,233 |
| | $ | 10,694 |
| | $ | 7,504 |
| | $ | 17,623 |
| | $ | 63,933 |
|
| Loans | 13,461 |
| | 13,979 |
| | 9,988 |
| | 6,984 |
| | — |
| | 44,412 |
|
| Deposits | 20,346 |
| | 14,705 |
| | 10,247 |
| | 5,893 |
| | 520 |
| | 51,711 |
|
| | | | | | | | | | | | |
| Statistical data: | | | | | | | | | | | |
| Return on average assets (a) | 1.18 | % | | 1.72 | % | | 1.59 | % | | 2.79 | % | | N/M |
| | 0.85 | % |
| Efficiency ratio (b) | 65.09 |
| | 47.00 |
| | 53.22 |
| | 40.52 |
| | N/M |
| | 67.32 |
|
| |
| (a) | Return on average assets is calculated based on the greater of average assets or average liabilities and attributed equity. |
(b) Noninterest expenses as a percentage of the sum of net interest income (FTE) and noninterest income excluding net securities gains.
FTE – Fully Taxable Equivalent
N/M – not meaningful
NOTES TO CONSOLIDATED FINANCIAL STATEMENTS
Comerica Incorporated and Subsidiaries
NOTE 23 - PARENT COMPANY FINANCIAL STATEMENTS
BALANCE SHEETS - COMERICA INCORPORATED
|
| | | | | | | |
| (in millions, except share data) | | | |
| December 31 | 2015 | | 2014 |
| Assets | | | |
| Cash and due from subsidiary bank | $ | 4 |
| | $ | — |
|
| Short-term investments with subsidiary bank | 569 |
| | 1,133 |
|
| Other short-term investments | 89 |
| | 94 |
|
| Investment in subsidiaries, principally banks | 7,523 |
| | 7,411 |
|
| Premises and equipment | 3 |
| | 2 |
|
| Other assets | 137 |
| | 138 |
|
| Total assets | $ | 8,325 |
| | $ | 8,778 |
|
| Liabilities and Shareholders' Equity | | | |
| Medium- and long-term debt | $ | 608 |
| | $ | 1,208 |
|
| Other liabilities | 157 |
| | 168 |
|
| Total liabilities | 765 |
| | 1,376 |
|
| Common stock - $5 par value: | | | |
| Authorized - 325,000,000 shares | | | |
| Issued - 228,164,824 shares | 1,141 |
| | 1,141 |
|
| Capital surplus | 2,173 |
| | 2,188 |
|
| Accumulated other comprehensive loss | (429 | ) | | (412 | ) |
| Retained earnings | 7,084 |
| | 6,744 |
|
| Less cost of common stock in treasury - 52,457,113 shares at 12/31/15 and 49,146,225 shares at 12/31/14 | (2,409 | ) | | (2,259 | ) |
| Total shareholders' equity | 7,560 |
| | 7,402 |
|
| Total liabilities and shareholders' equity | $ | 8,325 |
| | $ | 8,778 |
|
STATEMENTS OF INCOME - COMERICA INCORPORATED
|
| | | | | | | | | | | |
| (in millions) | | | | | |
| Years Ended December 31 | 2015 | | 2014 | | 2013 |
| Income | | | | | |
| Income from subsidiaries: | | | | | |
| Dividends from subsidiaries | $ | 441 |
| | $ | 384 |
| | $ | 490 |
|
| Other interest income | 1 |
| | 1 |
| | 1 |
|
| Intercompany management fees | 123 |
| | 118 |
| | 110 |
|
| Other noninterest income | 1 |
| | 7 |
| | 14 |
|
| Total income | 566 |
| | 510 |
| | 615 |
|
| Expenses | | | | | |
| Interest on medium- and long-term debt | 14 |
| | 14 |
| | 11 |
|
| Salaries and benefits expense | 112 |
| | 114 |
| | 118 |
|
| Net occupancy expense | 5 |
| | 5 |
| | 4 |
|
| Equipment expense | 1 |
| | 1 |
| | 1 |
|
| Other noninterest expenses | 70 |
| | 70 |
| | 78 |
|
| Total expenses | 202 |
| | 204 |
| | 212 |
|
| Income before benefit for income taxes and equity in undistributed earnings of subsidiaries | 364 |
| | 306 |
| | 403 |
|
| Benefit for income taxes | (27 | ) | | (27 | ) | | (30 | ) |
| Income before equity in undistributed earnings of subsidiaries | 391 |
| | 333 |
| | 433 |
|
| Equity in undistributed earnings of subsidiaries, principally banks | 130 |
| | 260 |
| | 108 |
|
| Net income | 521 |
| | 593 |
| | 541 |
|
| Less income allocated to participating securities | 6 |
| | 7 |
| | 8 |
|
| Net income attributable to common shares | $ | 515 |
| | $ | 586 |
| | $ | 533 |
|
NOTES TO CONSOLIDATED FINANCIAL STATEMENTS
Comerica Incorporated and Subsidiaries
STATEMENTS OF CASH FLOWS - COMERICA INCORPORATED
|
| | | | | | | | | | | |
| (in millions) | | | | | |
| Years Ended December 31 | 2015 | | 2014 | | 2013 |
| Operating Activities | | | | | |
| Net income | $ | 521 |
| | $ | 593 |
| | $ | 541 |
|
| Adjustments to reconcile net income to net cash provided by operating activities: | | | | | |
| Undistributed earnings of subsidiaries, principally banks | (130 | ) | | (260 | ) | | (108 | ) |
| Depreciation and amortization | 1 |
| | 1 |
| | 1 |
|
| Net periodic defined benefit cost | 5 |
| | 4 |
| | 8 |
|
| Share-based compensation expense | 14 |
| | 16 |
| | 14 |
|
| Provision for deferred income taxes | — |
| | — |
| | 3 |
|
| Excess tax benefits from share-based compensation arrangements | (3 | ) | | (7 | ) | | (3 | ) |
| Other, net | 5 |
| | 16 |
| | 2 |
|
| Net cash provided by operating activities | 413 |
| | 363 |
| | 458 |
|
| Investing Activities | | | | | |
| Net change in premises and equipment | (1 | ) | | 2 |
| | — |
|
| Net cash (used in) provided by investing activities | (1 | ) | | 2 |
| | — |
|
| Financing Activities | | | | | |
| Medium- and long-term debt: | | | | | |
| Maturities and redemptions | (600 | ) | | — |
| | — |
|
| Issuances | — |
| | 596 |
| | — |
|
| Common Stock: | | | | | |
| Repurchases | (240 | ) | | (260 | ) | | (291 | ) |
| Cash dividends paid | (147 | ) | | (137 | ) | | (123 | ) |
| Issuances of common stock under employee stock plans | 22 |
| | 49 |
| | 33 |
|
| Purchase and retirement of warrants | (10 | ) | | — |
| | — |
|
| Excess tax benefits from share-based compensation arrangements | 3 |
| | 7 |
| | 3 |
|
| Net cash (used in) provided by financing activities | (972 | ) | | 255 |
| | (378 | ) |
| Net (decrease) increase in cash and cash equivalents | (560 | ) | | 620 |
| | 80 |
|
| Cash and cash equivalents at beginning of period | 1,133 |
| | 513 |
| | 433 |
|
| Cash and cash equivalents at end of period | $ | 573 |
| | $ | 1,133 |
| | $ | 513 |
|
| Interest paid | $ | 16 |
| | $ | 12 |
| | $ | 11 |
|
| Income taxes recovered | $ | (62 | ) | | $ | (33 | ) | | $ | (27 | ) |
NOTES TO CONSOLIDATED FINANCIAL STATEMENTS
Comerica Incorporated and Subsidiaries
NOTE 24 - SUMMARY OF QUARTERLY FINANCIAL STATEMENTS (UNAUDITED)
The following quarterly information is unaudited. However, in the opinion of management, the information reflects all adjustments, which are necessary for the fair presentation of the results of operations, for the periods presented.
|
| | | | | | | | | | | | | | | |
| | 2015 |
| (in millions, except per share data) | Fourth Quarter | | Third Quarter | | Second Quarter | | First Quarter |
| Interest income | $ | 457 |
| | $ | 448 |
| | $ | 444 |
| | $ | 435 |
|
| Interest expense | 24 |
| | 26 |
| | 23 |
| | 22 |
|
| Net interest income | 433 |
| | 422 |
| | 421 |
| | 413 |
|
| Provision for credit losses | 60 |
| | 26 |
| | 47 |
| | 14 |
|
| Net securities losses | — |
| | — |
| | — |
| | (2 | ) |
| Noninterest income excluding net securities losses | 270 |
| | 264 |
| | 261 |
| | 257 |
|
| Noninterest expenses | 486 |
| | 461 |
| | 436 |
| | 459 |
|
| Provision for income taxes | 41 |
| | 63 |
| | 64 |
| | 61 |
|
| Net income | 116 |
| | 136 |
| | 135 |
| | 134 |
|
| Less income allocated to participating securities | 1 |
| | 2 |
| | 1 |
| | 2 |
|
| Net income attributable to common shares | $ | 115 |
| | $ | 134 |
| | $ | 134 |
| | $ | 132 |
|
| Earnings per common share: | | | | | | | |
| Basic | $ | 0.65 |
| | $ | 0.76 |
| | $ | 0.76 |
| | $ | 0.75 |
|
| Diluted | 0.64 |
| | 0.74 |
| | 0.73 |
| | 0.73 |
|
| Comprehensive income | 31 |
| | 187 |
| | 109 |
| | 176 |
|
|
| | | | | | | | | | | | | | | |
| | 2014 |
| (in millions, except per share data) | Fourth Quarter | | Third Quarter | | Second Quarter | | First Quarter |
| Interest income | $ | 438 |
| | $ | 436 |
| | $ | 441 |
| | $ | 435 |
|
| Interest expense | 23 |
| | 22 |
| | 25 |
| | 25 |
|
| Net interest income | 415 |
| | 414 |
| | 416 |
| | 410 |
|
| Provision for credit losses | 2 |
| | 5 |
| | 11 |
| | 9 |
|
| Net securities (losses) gains | — |
| | (1 | ) | | — |
| | 1 |
|
| Noninterest income excluding net securities (losses) gains | 225 |
| | 216 |
| | 220 |
| | 207 |
|
| Noninterest expenses | 419 |
| | 397 |
| | 404 |
| | 406 |
|
| Provision for income taxes | 70 |
| | 73 |
| | 70 |
| | 64 |
|
| Net income | 149 |
| | 154 |
| | 151 |
| | 139 |
|
| Less income allocated to participating securities | 1 |
| | 2 |
| | 2 |
| | 2 |
|
| Net income attributable to common shares | $ | 148 |
| | $ | 152 |
| | $ | 149 |
| | $ | 137 |
|
| Earnings per common share: | | | | | | | |
| Basic | $ | 0.83 |
| | $ | 0.85 |
| | $ | 0.83 |
| | $ | 0.76 |
|
| Diluted | 0.80 |
| | 0.82 |
| | 0.80 |
| | 0.73 |
|
| Comprehensive income | 54 |
| | 141 |
| | 172 |
| | 205 |
|
NOTE 25 - SUBSEQUENT EVENTS
As disclosed on February 16, 2016, the Corporation's previously reported results for the fourth quarter and full year 2015 were reduced by $14 million ($22 million, pre-tax) for recently discovered irregularities with a single customer loan relationship in the Retail Bank. The Corporation increased its provision for credit losses and recorded a charge-off for $25 million, and decreased incentive compensation expense by approximately $3 million based on the revised results. The results reported in this Annual Report reflect the impact of this event.
Subsequent to December 31, 2015, oil and gas prices dropped significantly. The allowance for loan losses allocation for energy and energy-related loans was based upon energy prices and conditions in existence at the balance sheet date.
REPORT OF MANAGEMENT
The management of Comerica Incorporated (the Corporation) is responsible for the accompanying consolidated financial statements and all other financial information in this Annual Report. The consolidated financial statements have been prepared in conformity with U.S. generally accepted accounting principles and include amounts which of necessity are based on management's best estimates and judgments and give due consideration to materiality. The other financial information herein is consistent with that in the consolidated financial statements.
In meeting its responsibility for the reliability of the consolidated financial statements, management develops and maintains effective internal controls, including those over financial reporting, as defined in the Securities and Exchange Act of 1934, as amended. The Corporation's internal control over financial reporting includes policies and procedures that (1) pertain to the maintenance of records that, in reasonable detail, accurately and fairly reflect the transactions and dispositions of the assets of the Corporation; (2) provide reasonable assurance that transactions are recorded as necessary to permit preparation of the consolidated financial statements in conformity with U.S. generally accepted accounting principles, and that receipts and expenditures of the Corporation are made only in accordance with authorizations of management and directors of the Corporation; and (3) provide reasonable assurance regarding prevention or timely detection of unauthorized acquisition, use or disposition of the Corporation's assets that could have a material effect on the consolidated financial statements.
Management assessed, with participation of the Corporation's Chief Executive Officer and Chief Financial Officer, internal control over financial reporting as it relates to the Corporation's consolidated financial statements presented in conformity with U.S. generally accepted accounting principles as of December 31, 2015. The assessment was based on criteria for effective internal control over financial reporting described in Internal Control—Integrated Framework issued by the Committee of Sponsoring Organizations of the Treadway Commission (2013 framework) (the COSO criteria). Based on this assessment, management determined that internal control over financial reporting is effective as it relates to the Corporation's consolidated financial statements presented in conformity with U.S. generally accepted accounting principles as of December 31, 2015.
Because of inherent limitations, internal control over financial reporting may not prevent or detect misstatements. Also, projections of any evaluation of effectiveness to future periods are subject to risk that controls may become inadequate because of changes in conditions, or that the degree of compliance with the policies or procedures may deteriorate.
The Corporation's internal control over financial reporting as of December 31, 2015 has been audited by Ernst & Young LLP, an independent registered public accounting firm, as stated in their accompanying report.
The Corporation's Board of Directors oversees management's internal control over financial reporting and financial reporting responsibilities through its Audit Committee as well as various other committees. The Audit Committee, which consists of directors who are not officers or employees of the Corporation, meets regularly with management, internal audit and the independent public accountants to assure that the Audit Committee, management, internal auditors and the independent public accountants are carrying out their responsibilities, and to review auditing, internal control and financial reporting matters.
|
| | | | |
| Ralph W. Babb Jr. | | Karen L. Parkhill | | Muneera S. Carr |
| Chairman and | | Vice Chairman and | | Executive Vice President and |
| Chief Executive Officer | | Chief Financial Officer | | Chief Accounting Officer |
REPORT OF INDEPENDENT REGISTERED PUBLIC ACCOUNTING FIRM
Board of Directors and Shareholders
Comerica Incorporated
We have audited Comerica Incorporated and subsidiaries' internal control over financial reporting as of December 31, 2015, based on criteria established in Internal Control-Integrated Framework issued by the Committee of Sponsoring Organizations of the Treadway Commission (2013 framework) (the COSO criteria). Comerica Incorporated and subsidiaries' management is responsible for maintaining effective internal control over financial reporting, and for its assessment of the effectiveness of internal control over financial reporting included in the accompanying Report of Management. Our responsibility is to express an opinion on the Corporation's internal control over financial reporting based on our audit.
We conducted our audit in accordance with the standards of the Public Company Accounting Oversight Board (United States). Those standards require that we plan and perform the audit to obtain reasonable assurance about whether effective internal control over financial reporting was maintained in all material respects. Our audit included obtaining an understanding of internal control over financial reporting, assessing the risk that a material weakness exists, testing and evaluating the design and operating effectiveness of internal control based on the assessed risk, and performing such other procedures as we considered necessary in the circumstances. We believe that our audit provides a reasonable basis for our opinion.
A company's internal control over financial reporting is a process designed to provide reasonable assurance regarding the reliability of financial reporting and the preparation of financial statements for external purposes in accordance with generally accepted accounting principles. A company's internal control over financial reporting includes those policies and procedures that (1) pertain to the maintenance of records that, in reasonable detail, accurately and fairly reflect the transactions and dispositions of the assets of the company; (2) provide reasonable assurance that transactions are recorded as necessary to permit preparation of financial statements in accordance with generally accepted accounting principles, and that receipts and expenditures of the company are being made only in accordance with authorizations of management and directors of the company; and (3) provide reasonable assurance regarding prevention or timely detection of unauthorized acquisition, use or disposition of the company's assets that could have a material effect on the financial statements.
Because of its inherent limitations, internal control over financial reporting may not prevent or detect misstatements. Also, projections of any evaluation of effectiveness to future periods are subject to the risk that controls may become inadequate because of changes in conditions, or that the degree of compliance with the policies or procedures may deteriorate.
In our opinion, Comerica Incorporated and subsidiaries maintained, in all material respects, effective internal control over financial reporting as of December 31, 2015, based on the COSO criteria.
We also have audited, in accordance with the standards of the Public Company Accounting Oversight Board (United States), the 2015 consolidated financial statements of Comerica Incorporated and subsidiaries and our report dated February 26, 2016 expressed an unqualified opinion thereon.
/s/ Ernst & Young LLP
Dallas, TX
February 26, 2016
REPORT OF INDEPENDENT REGISTERED PUBLIC ACCOUNTING FIRM
Board of Directors and Shareholders
Comerica Incorporated
We have audited the accompanying consolidated balance sheets of Comerica Incorporated and subsidiaries as of December 31, 2015 and 2014, and the related consolidated statements of income, comprehensive income, changes in shareholders' equity and cash flows for each of the three years in the period ended December 31, 2015. These financial statements are the responsibility of the Corporation's management. Our responsibility is to express an opinion on these financial statements based on our audits.
We conducted our audits in accordance with the standards of the Public Company Accounting Oversight Board (United States). Those standards require that we plan and perform the audit to obtain reasonable assurance about whether the financial statements are free of material misstatement. An audit includes examining, on a test basis, evidence supporting the amounts and disclosures in the financial statements. An audit also includes assessing the accounting principles used and significant estimates made by management, as well as evaluating the overall financial statement presentation. We believe that our audits provide a reasonable basis for our opinion.
In our opinion, the financial statements referred to above present fairly, in all material respects, the consolidated financial position of Comerica Incorporated and subsidiaries at December 31, 2015 and 2014, and the consolidated results of their operations and their cash flows for each of the three years in the period ended December 31, 2015, in conformity with U.S. generally accepted accounting principles.
We also have audited, in accordance with the standards of the Public Company Accounting Oversight Board (United States), Comerica Incorporated and subsidiaries' internal control over financial reporting as of December 31, 2015, based on criteria established in Internal Control-Integrated Framework issued by the Committee of Sponsoring Organizations of the Treadway Commission (2013 framework) and our report dated February 26, 2016 expressed an unqualified opinion thereon.
/s/ Ernst & Young LLP
Dallas, TX
February 26, 2016
HISTORICAL REVIEW - AVERAGE BALANCE SHEETS
Comerica Incorporated and Subsidiaries
CONSOLIDATED FINANCIAL INFORMATION
|
| | | | | | | | | | | | | | | | | | | |
| (in millions) | | | | | | | | | |
| Years Ended December 31 | 2015 | | 2014 | | 2013 | | 2012 | | 2011 |
| ASSETS | | | | | | | | | |
| Cash and due from banks | $ | 1,059 |
| | $ | 934 |
| | $ | 987 |
| | $ | 983 |
| | $ | 921 |
|
| | | | | | | | | | |
| Interest-bearing deposits with banks | 6,158 |
| | 5,513 |
| | 4,930 |
| | 4,128 |
| | 3,746 |
|
| Other short-term investments | 106 |
| | 109 |
| | 112 |
| | 134 |
| | 129 |
|
| | | | | | | | | | |
| Investment securities | 10,237 |
| | 9,350 |
| | 9,637 |
| | 9,915 |
| | 8,171 |
|
| | | | | | | | | | |
| Commercial loans | 31,501 |
| | 29,715 |
| | 27,971 |
| | 26,224 |
| | 22,208 |
|
| Real estate construction loans | 1,884 |
| | 1,909 |
| | 1,486 |
| | 1,390 |
| | 1,843 |
|
| Commercial mortgage loans | 8,697 |
| | 8,706 |
| | 9,060 |
| | 9,842 |
| | 10,025 |
|
| Lease financing | 783 |
| | 834 |
| | 847 |
| | 864 |
| | 950 |
|
| International loans | 1,441 |
| | 1,376 |
| | 1,275 |
| | 1,272 |
| | 1,191 |
|
| Residential mortgage loans | 1,878 |
| | 1,778 |
| | 1,620 |
| | 1,505 |
| | 1,580 |
|
| Consumer loans | 2,444 |
| | 2,270 |
| | 2,153 |
| | 2,209 |
| | 2,278 |
|
| Total loans | 48,628 |
| | 46,588 |
| | 44,412 |
| | 43,306 |
| | 40,075 |
|
| Less allowance for loan losses | (621 | ) | | (601 | ) | | (622 | ) | | (693 | ) | | (838 | ) |
| Net loans | 48,007 |
| | 45,987 |
| | 43,790 |
| | 42,613 |
| | 39,237 |
|
| Accrued income and other assets | 4,680 |
| | 4,443 |
| | 4,477 |
| | 4,796 |
| | 4,710 |
|
| Total assets | $ | 70,247 |
| | $ | 66,336 |
| | $ | 63,933 |
| | $ | 62,569 |
| | $ | 56,914 |
|
| LIABILITIES AND SHAREHOLDERS' EQUITY | | | | | | | | | |
| Noninterest-bearing deposits | $ | 28,087 |
| | $ | 25,019 |
| | $ | 22,379 |
| | $ | 21,004 |
| | $ | 16,994 |
|
| | | | | | | | | | |
| Money market and interest-bearing checking deposits | 24,073 |
| | 22,891 |
| | 21,704 |
| | 20,622 |
| | 19,088 |
|
| Savings deposits | 1,841 |
| | 1,744 |
| | 1,657 |
| | 1,593 |
| | 1,550 |
|
| Customer certificates of deposit | 4,209 |
| | 4,869 |
| | 5,471 |
| | 5,902 |
| | 5,719 |
|
| Other time deposits | — |
| | — |
| | — |
| | — |
| | 23 |
|
| Foreign office time deposits | 116 |
| | 261 |
| | 500 |
| | 412 |
| | 388 |
|
| Total interest-bearing deposits | 30,239 |
| | 29,765 |
| | 29,332 |
| | 28,529 |
| | 26,768 |
|
| Total deposits | 58,326 |
| | 54,784 |
| | 51,711 |
| | 49,533 |
| | 43,762 |
|
| Short-term borrowings | 93 |
| | 200 |
| | 211 |
| | 76 |
| | 138 |
|
| Accrued expenses and other liabilities | 1,389 |
| | 1,016 |
| | 1,074 |
| | 1,133 |
| | 1,147 |
|
| Medium- and long-term debt | 2,905 |
| | 2,963 |
| | 3,972 |
| | 4,818 |
| | 5,519 |
|
| Total liabilities | 62,713 |
| | 58,963 |
| | 56,968 |
| | 55,560 |
| | 50,566 |
|
| Total shareholders' equity | 7,534 |
| | 7,373 |
| | 6,965 |
| | 7,009 |
| | 6,348 |
|
| Total liabilities and shareholders' equity | $ | 70,247 |
| | $ | 66,336 |
| | $ | 63,933 |
| | $ | 62,569 |
| | $ | 56,914 |
|
HISTORICAL REVIEW - STATEMENTS OF INCOME
Comerica Incorporated and Subsidiaries
CONSOLIDATED FINANCIAL INFORMATION
|
| | | | | | | | | | | | | | | | | | | |
| (in millions, except per share data) | | | | | | | | | |
| Years Ended December 31 | 2015 | | 2014 | | 2013 | | 2012 | | 2011 |
| INTEREST INCOME | | | | | | | | | |
| Interest and fees on loans | $ | 1,551 |
| | $ | 1,525 |
| | $ | 1,556 |
| | $ | 1,617 |
| | $ | 1,564 |
|
| Interest on investment securities | 216 |
| | 211 |
| | 214 |
| | 234 |
| | 233 |
|
| Interest on short-term investments | 17 |
| | 14 |
| | 14 |
| | 12 |
| | 12 |
|
| Total interest income | 1,784 |
| | 1,750 |
| | 1,784 |
| | 1,863 |
| | 1,809 |
|
| INTEREST EXPENSE | | | | | | | | | |
| Interest on deposits | 43 |
| | 45 |
| | 55 |
| | 70 |
| | 90 |
|
| Interest on medium- and long-term debt | 52 |
| | 50 |
| | 57 |
| | 65 |
| | 66 |
|
| Total interest expense | 95 |
| | 95 |
| | 112 |
| | 135 |
| | 156 |
|
| Net interest income | 1,689 |
| | 1,655 |
| | 1,672 |
| | 1,728 |
| | 1,653 |
|
| Provision for credit losses | 147 |
| | 27 |
| | 46 |
| | 79 |
| | 144 |
|
| Net interest income after provision for loan losses | 1,542 |
| | 1,628 |
| | 1,626 |
| | 1,649 |
| | 1,509 |
|
| NONINTEREST INCOME | | | | | | | | | |
| Card fees | 290 |
| | 92 |
| | 86 |
| | 77 |
| | 88 |
|
| Service charges on deposit accounts | 223 |
| | 215 |
| | 214 |
| | 214 |
| | 208 |
|
| Fiduciary income | 187 |
| | 180 |
| | 171 |
| | 158 |
| | 151 |
|
| Commercial lending fees | 99 |
| | 98 |
| | 99 |
| | 96 |
| | 87 |
|
| Letter of credit fees | 53 |
| | 57 |
| | 64 |
| | 71 |
| | 73 |
|
| Bank-owned life insurance | 40 |
| | 39 |
| | 40 |
| | 39 |
| | 37 |
|
| Foreign exchange income | 40 |
| | 40 |
| | 36 |
| | 38 |
| | 40 |
|
| Brokerage fees | 17 |
| | 17 |
| | 17 |
| | 19 |
| | 22 |
|
| Net securities (losses) gains | (2 | ) | | — |
| | (1 | ) | | 12 |
| | 14 |
|
| Other noninterest income | 103 |
| | 130 |
| | 156 |
| | 146 |
| | 123 |
|
| Total noninterest income | 1,050 |
| | 868 |
| | 882 |
| | 870 |
| | 843 |
|
| NONINTEREST EXPENSES | | | | | | | | | |
| Salaries and benefits expense | 1,009 |
| | 980 |
| | 1,009 |
| | 1,018 |
| | 975 |
|
| Outside processing fee expense | 332 |
| | 122 |
| | 119 |
| | 107 |
| | 101 |
|
| Net occupancy expense | 159 |
| | 171 |
| | 160 |
| | 163 |
| | 169 |
|
| Equipment expense | 53 |
| | 57 |
| | 60 |
| | 65 |
| | 66 |
|
| Software expense | 99 |
| | 95 |
| | 90 |
| | 90 |
| | 88 |
|
| FDIC insurance expense | 37 |
| | 33 |
| | 33 |
| | 38 |
| | 43 |
|
| Advertising expense | 24 |
| | 23 |
| | 21 |
| | 27 |
| | 28 |
|
| Litigation-related expenses | (32 | ) | | 4 |
| | 52 |
| | 23 |
| | 10 |
|
| Gain on debt redemption | — |
| | (32 | ) | | (1 | ) | | — |
| | — |
|
| Merger and restructuring charges | — |
| | — |
| | — |
| | 35 |
| | 75 |
|
| Other noninterest expenses | 161 |
| | 173 |
| | 179 |
| | 191 |
| | 216 |
|
| Total noninterest expenses | 1,842 |
| | 1,626 |
| | 1,722 |
| | 1,757 |
| | 1,771 |
|
| Income before income taxes | 750 |
| | 870 |
| | 786 |
| | 762 |
| | 581 |
|
| Provision for income taxes | 229 |
| | 277 |
| | 245 |
| | 241 |
| | 188 |
|
| NET INCOME | $ | 521 |
| | $ | 593 |
| | $ | 541 |
| | $ | 521 |
| | $ | 393 |
|
| Less income allocated to participating securities | 6 |
| | 7 |
| | 8 |
| | 6 |
| | 4 |
|
| Net income attributable to common shares | $ | 515 |
| | $ | 586 |
| | $ | 533 |
| | $ | 515 |
| | $ | 389 |
|
| Earnings per common share: | | | | | | | | | |
| Basic | 2.93 |
| | 3.28 |
| | 2.92 |
| | 2.68 |
| | 2.11 |
|
| Diluted | 2.84 |
| | 3.16 |
| | 2.85 |
| | 2.67 |
| | 2.09 |
|
| | | | | | | | | | |
| Comprehensive income | 504 |
| | 572 |
| | 563 |
| | 464 |
| | 426 |
|
| | | | | | | | | | |
| Cash dividends declared on common stock | 147 |
| | 143 |
| | 126 |
| | 106 |
| | 75 |
|
| Cash dividends declared per common share | 0.83 |
| | 0.79 |
| | 0.68 |
| | 0.55 |
| | 0.40 |
|
HISTORICAL REVIEW - STATISTICAL DATA
Comerica Incorporated and Subsidiaries
CONSOLIDATED FINANCIAL INFORMATION
|
| | | | | | | | | | | | | | | | | | | |
| Years Ended December 31 | 2015 | | 2014 | | 2013 | | 2012 | | 2011 |
| Average Rates (Fully Taxable Equivalent Basis) | | | | | | | | | |
| Interest-bearing deposits with banks | 0.26 | % | | 0.26 | % | | 0.26 | % | | 0.26 | % | | 0.24 | % |
| Other short-term investments | 0.81 |
| | 0.57 |
| | 1.22 |
| | 1.65 |
| | 2.17 |
|
| | | | | | | | | | |
| Investment securities | 2.13 |
| | 2.26 |
| | 2.25 |
| | 2.43 |
| | 2.91 |
|
| | | | | | | | | | |
| Commercial loans | 3.07 |
| | 3.12 |
| | 3.28 |
| | 3.44 |
| | 3.69 |
|
| Real estate construction loans | 3.48 |
| | 3.41 |
| | 3.85 |
| | 4.44 |
| | 4.37 |
|
| Commercial mortgage loans | 3.41 |
| | 3.75 |
| | 4.11 |
| | 4.44 |
| | 4.23 |
|
| Lease financing | 3.17 |
| | 2.33 |
| | 3.23 |
| | 3.01 |
| | 3.51 |
|
| International loans | 3.58 |
| | 3.65 |
| | 3.74 |
| | 3.73 |
| | 3.83 |
|
| Residential mortgage loans | 3.77 |
| | 3.82 |
| | 4.09 |
| | 4.55 |
| | 5.27 |
|
| Consumer loans | 3.26 |
| | 3.20 |
| | 3.30 |
| | 3.42 |
| | 3.50 |
|
| Total loans | 3.20 |
| | 3.28 |
| | 3.51 |
| | 3.74 |
| | 3.91 |
|
| Interest income as a percentage of earning assets | 2.75 |
| | 2.85 |
| | 3.03 |
| | 3.27 |
| | 3.49 |
|
| | | | | | | | | | |
| Domestic deposits | 0.14 |
| | 0.14 |
| | 0.18 |
| | 0.24 |
| | 0.33 |
|
| Deposits in foreign offices | 1.02 |
| | 0.82 |
| | 0.52 |
| | 0.63 |
| | 0.48 |
|
| Total interest-bearing deposits | 0.14 |
| | 0.15 |
| | 0.19 |
| | 0.25 |
| | 0.33 |
|
| Short-term borrowings | 0.05 |
| | 0.04 |
| | 0.07 |
| | 0.12 |
| | 0.13 |
|
| Medium- and long-term debt | 1.80 |
| | 1.68 |
| | 1.45 |
| | 1.36 |
| | 1.20 |
|
| Interest expense as a percentage of interest-bearing sources | 0.29 |
| | 0.29 |
| | 0.33 |
| | 0.41 |
| | 0.48 |
|
| Interest rate spread | 2.46 |
| | 2.56 |
| | 2.70 |
| | 2.86 |
| | 3.01 |
|
| Impact of net noninterest-bearing sources of funds | 0.14 |
| | 0.14 |
| | 0.14 |
| | 0.17 |
| | 0.18 |
|
| Net interest margin as a percentage of earning assets | 2.60 | % | | 2.70 | % | | 2.84 | % | | 3.03 | % | | 3.19 | % |
| | | | | | | | | | |
| Ratios | | | | | | | | | |
| Return on average common shareholders' equity | 6.91 | % | | 8.05 | % | | 7.76 | % | | 7.43 | % | | 6.18 | % |
| Return on average assets | 0.74 |
| | 0.89 |
| | 0.85 |
| | 0.83 |
| | 0.69 |
|
| Efficiency ratio (a) | 67.10 |
| | 64.31 |
| | 68.83 |
| | 69.24 |
| | 72.73 |
|
| Common equity tier 1 capital as a percentage of risk weighted assets (b) | 10.54 |
| | n/a |
| | n/a |
| | n/a |
| | n/a |
|
| Tier 1 common capital as a percentage of risk-weighted assets (c) | n/a |
| | 10.50 |
| | 10.64 |
| | 10.14 |
| | 10.37 |
|
| Tier 1 capital as a percentage of risk-weighted assets (b) | 10.54 |
| | 10.50 |
| | 10.64 |
| | 10.14 |
| | 10.41 |
|
| Total capital as a percentage of risk-weighted assets | 12.69 |
| | 12.51 |
| | 13.10 |
| | 13.15 |
| | 14.25 |
|
| Tangible common equity as a percentage of tangible assets (c) | 9.70 |
| | 9.85 |
| | 10.07 |
| | 9.76 |
| | 10.27 |
|
| | | | | | | | | | |
| Per Common Share Data | | | | | | | | | |
| Book value at year-end | $ | 43.03 |
| | $ | 41.35 |
| | $ | 39.22 |
| | $ | 36.86 |
| | $ | 34.79 |
|
| Market value at year-end | 41.83 |
| | 46.84 |
| | 47.54 |
| | 30.34 |
| | 25.80 |
|
| Market value for the year | | | | | | | | | |
| High | 53.45 |
| | 53.50 |
| | 48.69 |
| | 34.00 |
| | 43.53 |
|
| Low | 39.52 |
| | 42.73 |
| | 30.73 |
| | 26.25 |
| | 21.48 |
|
| | | | | | | | | | |
| Other Data (share data in millions) | | | | | | | | | |
| Average common shares outstanding - basic | 176 |
| | 179 |
| | 183 |
| | 191 |
| | 185 |
|
| Average common shares outstanding - diluted | 181 |
| | 185 |
| | 187 |
| | 192 |
| | 186 |
|
| Number of banking centers | 477 |
| | 481 |
| | 483 |
| | 489 |
| | 494 |
|
| Number of employees (full-time equivalent) | 8,880 |
| | 8,876 |
| | 8,948 |
| | 9,035 |
| | 9,468 |
|
| |
| (a) | Noninterest expenses as a percentage of the sum of net interest income (FTE) and noninterest income excluding net securities gains (losses). |
| |
| (b) | Ratios calculated based on the risk-based capital requirements in effect at the time. The U.S. implementation of the Basel III regulatory capital framework became effective on January 1, 2015, with transitional provisions. |
| |
| (c) | See Supplemental Financial Data section for reconcilements of non-GAAP financial measures. |
n/a - not applicable
SIGNATURES
Pursuant to the requirements of Section 13 or 15(d) of the Securities Exchange Act of 1934, the registrant has duly caused this report to be signed on its behalf by the undersigned, thereunto duly authorized as of February 26, 2016.
|
| | | |
| | COMERICA INCORPORATED |
| | | | |
| | By: | | /s/ Ralph W. Babb, Jr. |
| | | | Ralph W. Babb, Jr. Chairman and Chief Executive Officer |
Pursuant to the requirements of the Securities Exchange Act of 1934, this report has been signed by the following persons on behalf of the registrant in the capacities indicated as of February 26, 2016.
|
| | |
| /s/ Ralph W. Babb, Jr. | | Chairman and Chief Executive Officer and |
| Ralph W. Babb, Jr. | | Director (Principal Executive Officer) |
| | | |
| /s/ Karen L. Parkhill | | Vice Chairman and Chief Financial Officer |
| Karen L. Parkhill | | (Principal Financial Officer) |
| | | |
| /s/ Muneera S. Carr | | Executive Vice President and Chief Accounting Officer |
| Muneera S. Carr | | (Principal Accounting Officer) |
| | | |
| /s/ Roger A. Cregg | | |
| Roger A. Cregg | | Director |
| | | |
| /s/ T. Kevin DeNicola | | |
| T. Kevin DeNicola | | Director |
| | | |
| /s/ Jacqueline P. Kane | | |
| Jacqueline P. Kane | | Director |
| | | |
| /s/ Richard G. Lindner | | |
| Richard G. Lindner | | Director |
| | | |
| /s/ Alfred A. Piergallini | | |
| Alfred A. Piergallini | | Director |
| | | |
| /s/ Robert S. Taubman | | |
| Robert S. Taubman | | Director |
| | | |
| /s/ Reginald M. Turner, Jr. | | |
| Reginald M. Turner, Jr. | | Director |
| | | |
| /s/ Nina G. Vaca | | |
| Nina G. Vaca | | Director |
EXHIBIT INDEX
|
| | |
| 2.1 | | Agreement and Plan of Merger, dated as of January 16, 2011, by and among Comerica Incorporated, Sterling Bancshares, Inc., and, from and after its accession to the Agreement, Sub (as defined therein) (the schedules and exhibits have been omitted pursuant to Item 601(b)(2) of Regulation S-K) (filed as Exhibit 2.1 to Registrant's Current Report on Form 8-K dated January 16, 2011, and incorporated herein by reference). |
| | | |
| 3.1 | | Restated Certificate of Incorporation of Comerica Incorporated (filed as Exhibit 3.2 to Registrant's Current Report on Form 8-K dated August 4, 2010, and incorporated herein by reference). |
| | | |
| 3.2 | | Certificate of Amendment to Restated Certificate of Incorporation of Comerica Incorporated (filed as Exhibit 3.2 to Registrant's Quarterly Report on Form 10-Q for the quarter ended March 31, 2011, and incorporated herein by reference). |
| | | |
| 3.3 | | Amended and Restated Bylaws of Comerica Incorporated (filed as Exhibit 3.3 to Registrant's Quarterly Report on Form 10-Q for the quarter ended March 31, 2011, and incorporated herein by reference). |
| | | |
| 4 | | [Reference is made to Exhibits 3.1, 3.2 and 3.3 in respect of instruments defining the rights of security holders. In accordance with Regulation S-K Item No. 601(b)(4)(iii), the Registrant is not filing copies of instruments defining the rights of holders of long-term debt because none of those instruments authorizes debt in excess of 10% of the total assets of the registrant and its subsidiaries on a consolidated basis. The Registrant hereby agrees to furnish a copy of any such instrument to the SEC upon request.] |
| | | |
| 4.1 | | Warrant Agreement, dated May 6, 2010, between the registrant and Wells Fargo Bank, N.A. (filed as Exhibit 4.1 to Registrant's Registration Statement on Form 8-A dated May 7, 2010, and incorporated herein by reference). |
| | | |
| 4.2 | | Form of Warrant (filed as Exhibit 4.1 to Registrant's Registration Statement on Form 8-A dated May 7, 2010, and incorporated herein by reference). |
| | | |
| 4.3 | | Warrant Agreement, dated as of June 9, 2010, between Comerica Incorporated (as successor to Sterling Bancshares, Inc.) and American Stock Transfer & Trust Company, LLC (filed as Exhibit 4.1 to Sterling Bancshares, Inc.'s Registration Statement on Form 8-A12B filed on June 10, 2010 (File No. 001-34768) and incorporated herein by reference). |
| | | |
| 4.3A | | Appointment of Wells Fargo Bank, N.A. as successor Warrant Agent under the Warrant Agreement, dated as of June 9, 2010, of Comerica Incorporated (as successor to Sterling Bancshares, Inc.) (filed as Exhibit 4.1 to Registrant's Quarterly Report on Form 10-Q for the quarter ended September 30, 2015, and incorporated herein by reference). |
| | | |
| 4.4 | | Form of Warrant (filed as Exhibit 4.2 to Registrant's Registration Statement on Form S-4 (File No. 333-172211), and incorporated herein by reference). |
| | | |
| 9 | | (not applicable) |
| | | |
| 10.1† | | Comerica Incorporated 2006 Amended and Restated Long-Term Incentive Plan (filed as Exhibit 10.1 to Registrant's Current Report on Form 8-K dated April 23, 2013, and incorporated herein by reference). |
| | | |
| 10.1A† | | Form of Standard Comerica Incorporated Non-Qualified Stock Option Agreement under the Comerica Incorporated Amended and Restated 2006 Long-Term Incentive Plan (filed as Exhibit 10.7 to Registrant's Annual Report on Form 10-K for the year ended December 31, 2006, and incorporated herein by reference). |
| | | |
| 10.1B† | | Form of Standard Comerica Incorporated Non-Qualified Stock Option Agreement under the Comerica Incorporated Amended and Restated 2006 Long-Term Incentive Plan (2011 version) (filed as Exhibit 10.44 to Registrant's Annual Report on Form 10-K for the year ended December 31, 2010, and incorporated herein by reference). |
| | | |
| 10.1C† | | Form of Standard Comerica Incorporated Non-Qualified Stock Option Agreement under the Comerica Incorporated Amended and Restated 2006 Long-Term Incentive Plan (2012 version) (filed as Exhibit 10.1C to Registrant's Annual Report on Form 10-K for the year ended December 31, 2011, and incorporated herein by reference) . |
| | | |
| 10.1D† | | Form of Standard Comerica Incorporated Non-Qualified Stock Option Agreement under the Comerica Incorporated Amended and Restated 2006 Long-Term Incentive Plan (2014 version) (filed as Exhibit 10.1 to Registrant's Current Report on Form 8-K dated January 21, 2014, and incorporated herein by reference). |
| | | |
| 10.1E† | | Form of Standard Comerica Incorporated Non-Qualified Stock Option Agreement under the Comerica Incorporated Amended and Restated 2006 Long-Term Incentive Plan (2014 version 2) (filed as Exhibit 10.1 to Registrant's Current Report on Form 8-K dated July 22, 2014, and incorporated herein by reference). |
| | | |
| 10.1F† | | Form of Standard Comerica Incorporated Non-Qualified Stock Option Agreement under the Comerica Incorporated Amended and Restated 2006 Long-Term Incentive Plan (2015 version) (filed as Exhibit 10.2 to Registrant's Current Report on Form 8-K dated November 10, 2015, and incorporated herein by reference). |
| | | |
|
| | |
| 10.1G† | | Form of Standard Comerica Incorporated Restricted Stock Award Agreement (non-cliff vesting) under the Amended and Restated Comerica Incorporated 2006 Long-Term Incentive Plan (filed as Exhibit 10.11 to Registrant's Annual Report on Form 10-K for the year ended December 31, 2006, and incorporated herein by reference). |
| | | |
| 10.1H† | | Form of Standard Comerica Incorporated Restricted Stock Award Agreement (non-cliff vesting) under the Amended and Restated Comerica Incorporated 2006 Long-Term Incentive Plan (2011 version) (filed as Exhibit 10.46 to Registrant's Annual Report on Form 10-K for the year ended December 31, 2010, and incorporated herein by reference). |
| | | |
| 10.1I† | | Form of Standard Comerica Incorporated Restricted Stock Award Agreement (non-cliff vesting) under the Amended and Restated Comerica Incorporated 2006 Long-Term Incentive Plan (2012 version) (filed as Exhibit 10.1F to Registrant's Annual Report on Form 10-K for the year ended December 31, 2011, and incorporated herein by reference). |
| | | |
| 10.1J† | | Form of Standard Comerica Incorporated Restricted Stock Award Agreement (non-cliff vesting) under the Amended and Restated Comerica Incorporated 2006 Long-Term Incentive Plan (2014 version) (filed as Exhibit 10.2 to Registrant's Current Report on Form 8-K dated January 21, 2014, and incorporated herein by reference). |
| | | |
| 10.1K† | | Form of Standard Comerica Incorporated Restricted Stock Award Agreement (non-cliff vesting) under the Amended and Restated Comerica Incorporated 2006 Long-Term Incentive Plan (2014 version 2) (filed as Exhibit 10.2 to Registrant's Current Report on Form 8-K dated July 22, 2014, and incorporated herein by reference). |
| | | |
| 10.1L† | | Form of Standard Comerica Incorporated Restricted Stock Award Agreement (cliff vesting) under the Comerica Incorporated 2006 Amended and Restated Long-Term Incentive Plan (filed as Exhibit 99.1 to Registrant's Current Report on Form 8-K dated January 22, 2007, and incorporated herein by reference). |
| | | |
| 10.1M† | | Form of Standard Comerica Incorporated Restricted Stock Award Agreement (cliff vesting) under the Comerica Incorporated 2006 Amended and Restated Long-Term Incentive Plan (2011 version) (filed as Exhibit 10.45 to Registrant's Annual Report on Form 10-K for the year ended December 31, 2010, and incorporated herein by reference). |
| | | |
| 10.1N† | | Form of Standard Comerica Incorporated Restricted Stock Award Agreement (cliff vesting) under the Comerica Incorporated 2006 Amended and Restated Long-Term Incentive Plan (2012 version) (filed as Exhibit 10.1I to Registrant's Annual Report on Form 10-K for the year ended December 31, 2011, and incorporated herein by reference). |
| | | |
| 10.1O† | | Form of Standard Comerica Incorporated Restricted Stock Award Agreement (cliff vesting) under the Comerica Incorporated 2006 Amended and Restated Long-Term Incentive Plan (long-term restricted version) (filed as Exhibit 10.41 to Registrant's Annual Report on Form 10-K for the year ended December 31, 2009, and incorporated herein by reference). |
| | | |
| 10.1P† | | Form of Standard Comerica Incorporated Restricted Stock Unit Agreement under the Amended and Restated Comerica Incorporated 2006 Long-Term Incentive Plan (2011 version) (filed as Exhibit 10.47 to Registrant's Annual Report on Form 10-K for the year ended December 31, 2010, and incorporated herein by reference). |
| | | |
| 10.1Q† | | Form of Standard Comerica Incorporated Restricted Stock Unit Agreement under the Amended and Restated Comerica Incorporated 2006 Long-Term Incentive Plan (2011 version 2) (filed as Exhibit 10.5 to Registrant's Quarterly Report on Form 10-Q for the quarter ended September 30, 2011, and incorporated herein by reference). |
| | | |
| 10.1R† | | Form of Standard Comerica Incorporated Performance Restricted Stock Unit Agreement under the Amended and Restated Comerica Incorporated 2006 Long-Term Incentive Plan (2012 version) (filed as Exhibit 10.1 to Registrant's Current Report on Form 8-K dated November 19, 2012, and incorporated herein by reference). |
| | | |
| 10.1S† | | Form of Standard Comerica Incorporated Senior Executive Long-Term Performance Restricted Stock Unit Award Agreement under the Amended and Restated Comerica Incorporated 2006 Long-Term Incentive Plan (filed as Exhibit 10.3 to Registrant's Current Report on Form 8-K dated January 21, 2014, and incorporated herein by reference). |
| | | |
| 10.1T† | | Form of Standard Comerica Incorporated Senior Executive Long-Term Performance Restricted Stock Unit Award Agreement under the Amended and Restated Comerica Incorporated 2006 Long-Term Incentive Plan (2014 version 2) (filed as Exhibit 10.3 to Registrant's Current Report on Form 8-K dated July 22, 2014, and incorporated herein by reference). |
| | | |
| 10.1U† | | Form of Standard Comerica Incorporated Senior Executive Long-Term Performance Restricted Stock Unit Award Agreement under the Amended and Restated Comerica Incorporated 2006 Long-Term Incentive Plan (2015 version) (filed as Exhibit 10.1 to Registrant's Current Report on Form 8-K dated November 10, 2015, and incorporated herein by reference). |
| | | |
| 10.2† | | Comerica Incorporated 1997 Amended and Restated Long-Term Incentive Plan (filed as Exhibit 10.1 to Registrant's Annual Report on Form 10-K for the year ended December 31, 2001, and incorporated herein by reference). |
| | | |
|
| | |
| 10.2A† | | Form of Standard Comerica Incorporated Non-Qualified Stock Option Agreement under the Amended and Restated Comerica Incorporated 1997 Long-Term Incentive Plan (filed as Exhibit 10.4 to Registrant's Quarterly Report on Form 10-Q for the quarter ended September 30, 2004, and incorporated herein by reference). |
| | | |
| 10.3† | | Amended and Restated Sterling Bancshares, Inc. 2003 Stock Incentive and Compensation Plan effective April 30, 2007 (filed as Exhibit 10.1 to Sterling Bancshares, Inc.'s Current Report on Form 8-K dated August 14, 2007 (File No. 000-20750), and incorporated herein by reference). |
| | | |
| 10.4† | | 1994 Incentive Stock Option Plan of Sterling Bancshares, Inc. (filed as Exhibit 10.1 Sterling Bancshares, Inc.'s Annual Report on Form 10-K for the year ended December 31, 1994 (File No. 000-20750), and incorporated herein by reference). |
| | | |
| 10.5† | | Comerica Incorporated Amended and Restated Employee Stock Purchase Plan (amended and restated October 22, 2013) (filed as Exhibit 10.5 to Registrant's Annual Report on Form 10-K for the year ended December 31, 2013, and incorporated herein by reference). |
| | | |
| 10.6† | | Comerica Incorporated 2011 Management Incentive Plan (filed as Exhibit 10.1 to Registrant's Current Report on Form 8-K dated April 26, 2011, and incorporated herein by reference). |
| | | |
| 10.6A† | | Form of Standard Comerica Incorporated No Sale Agreement under the Comerica Incorporated Amended and Restated Management Incentive Plan (filed as Exhibit 10.5 to Registrant's Quarterly Report on Form 10-Q for the quarter ended September 30, 2004, and incorporated herein by reference). |
| | | |
| 10.7† | | Amended and Restated Benefit Equalization Plan for Employees of Comerica Incorporated (amended and restated March 24, 2009, with amendments effective January 1, 2009) (filed as Exhibit 10.1 to Registrant's Current Report on Form 8-K dated March 24, 2009, and incorporated herein by reference). |
| | | |
| 10.8† | | 1999 Comerica Incorporated Amended and Restated Deferred Compensation Plan (amended and restated on July 26, 2011) (filed as Exhibit 10.1 to Registrant's Current Report on Form 8-K dated July 26, 2011, and incorporated herein by reference). |
| | | |
| 10.9† | | 1999 Comerica Incorporated Amended and Restated Common Stock Deferred Incentive Award Plan (amended and restated on July 26, 2011) (filed as Exhibit 10.2 to Registrant's Current Report on Form 8-K dated July 26, 2011, and incorporated herein by reference). |
| | | |
| 10.10† | | Sterling Bancshares, Inc. Deferred Compensation Plan (as Amended and Restated) (filed as Exhibit 4.4 to Registrant's Registration Statement on Form S-8 dated July 28, 2011 (Registration No. 333-175857) and incorporated herein by reference). |
| | | |
| 10.11† | | Amended and Restated Comerica Incorporated Stock Option Plan For Non-Employee Directors (amended and restated on May 22, 2001) (filed as Exhibit 10.12 to Registrant's Annual Report on Form 10-K for the year ended December 31, 2002, and incorporated herein by reference). |
| | | |
| 10.12† | | Amended and Restated Comerica Incorporated Stock Option Plan For Non-Employee Directors of Comerica Bank and Affiliated Banks (amended and restated May 22, 2001) (filed as Exhibit 10.13 to Registrant's Annual Report on Form 10-K for the year ended December 31, 2002, and incorporated herein by reference). |
| | | |
| 10.13† | | Amended and Restated Comerica Incorporated Non-Employee Director Fee Deferral Plan (amended and restated on January 27, 2015) (filed as Exhibit 10.13 to Registrant's Annual Report on Form 10-K for the year ended December 31, 2014, and incorporated herein by reference). |
| | | |
| 10.14† | | Amended and Restated Comerica Incorporated Common Stock Non-Employee Director Fee Deferral Plan (amended and restated on January 27, 2015) (filed as Exhibit 10.14 to Registrant's Annual Report on Form 10-K for the year ended December 31, 2014, and incorporated herein by reference). |
| | | |
| 10.15† | | Comerica Incorporated Amended and Restated Incentive Plan for Non-Employee Directors (amended and restated effective May 14, 2014) (filed as Exhibit 10.3 to Registrant's Quarterly Report on Form 10-Q for the quarter ended March 31, 2015, and incorporated herein by reference). |
| | | |
| 10.15A† | | Form of Standard Comerica Incorporated Non-Employee Director Restricted Stock Unit Agreement under the Comerica Incorporated Amended and Restated Incentive Plan for Non-Employee Directors (filed as Exhibit 10.2 to Registrant's Quarterly Report on Form 10-Q for the quarter ended June 30, 2005, and incorporated herein by reference). |
| | | |
| 10.15B† | | Form of Standard Comerica Incorporated Non-Employee Director Restricted Stock Unit Agreement under the Comerica Incorporated Amended and Restated Incentive Plan for Non-Employee Directors (Version 2) (filed as Exhibit 10.6 to Registrant's Quarterly Report on Form 10-Q for the quarter ended June 30, 2006, and incorporated herein by reference). |
| | | |
|
| | |
| 10.15C† | | Form of Standard Comerica Incorporated Non-Employee Director Restricted Stock Unit Agreement under the Comerica Incorporated Amended and Restated Incentive Plan for Non-Employee Directors (Version 2.5) (filed as Exhibit 10.48 to Registrant's Annual Report on Form 10-K for the year ended December 31, 2010, and incorporated herein by reference). |
| | | |
| 10.15D† | | Form of Standard Comerica Incorporated Non-Employee Director Restricted Stock Unit Agreement under the Comerica Incorporated Amended and Restated Incentive Plan for Non-Employee Directors (Version 3) (filed as Exhibit 10.1 to Registrant's Quarterly Report on Form 10-Q for the quarter ended June 30, 2009, and incorporated herein by reference). |
| | | |
| 10.15E† | | Form of Standard Comerica Incorporated Non-Employee Director Restricted Stock Unit Agreement under the Comerica Incorporated Amended and Restated Incentive Plan for Non-Employee Directors (Version 4) (filed as Exhibit 10.4 to Registrant's Quarterly Report on Form 10-Q for the quarter ended June 30, 2011, and incorporated herein by reference). |
| | | |
| 10.16† | | 2015 Comerica Incorporated Incentive Plan for Non-Employee Directors (filed as Exhibit 10.4 to Registrant's Quarterly Report on Form 10-Q for the quarter ended March 31, 2015, and incorporated herein by reference). |
| | | |
| 10.16A† | | Form of Standard Comerica Incorporated Non-Employee Director Restricted Stock Unit Agreement under the 2015 Comerica Incorporated Incentive Plan for Non-Employee Directors (filed as Exhibit 10.1 to Registrant's Quarterly Report on Form 10-Q for the quarter ended September 30, 2015, and incorporated herein by reference). |
| | | |
| 10.17† | | Form of Indemnification Agreement between Comerica Incorporated and certain of its directors and officers (filed as Exhibit 10.6 to Registrant's Annual Report on Form 10-K for the year ended December 31, 2002, and incorporated herein by reference). |
| | | |
| 10.18† | | Supplemental Benefit Agreement with Eugene A. Miller (filed as Exhibit 10.1 to Registrant's Quarterly Report on Form 10-Q for the quarter ended September 30, 2002, and incorporated herein by reference). |
| | | |
| 10.19† | | Supplemental Pension and Retiree Medical Agreement with Ralph W. Babb Jr. (filed as Exhibit 10.2 to Registrant's Quarterly Report on Form 10-Q for the quarter ended June 30, 1998, and incorporated herein by reference). |
| | | |
| 10.20A† | | Restrictive Covenants and General Release Agreement by and between J. Michael Fulton and Comerica Incorporated dated April 3, 2014 (filed as Exhibit 10.1 to Registrant's Current Report on Form 8-K dated April 3, 2014, and incorporated herein by reference). |
| | | |
| 10.20B† | | Restrictive Covenants and General Release Agreement by and between Elizabeth S. Acton and Comerica Incorporated dated April 20, 2012 (filed as Exhibit 10.1 to Registrant's Current Report on Form 8-K dated April 25, 2012, and incorporated herein by reference). |
| | | |
| 10.21† | | Form of Change of Control Employment Agreement (BE4 and Higher Version without gross-up or window period-2009 version) (filed as Exhibit 10.42 to Registrant's Annual Report on Form 10-K for the year ended December 31, 2009, and incorporated herein by reference). |
| | | |
| 10.21A† | | Schedule of Named Executive Officers Party to Change of Control Employment Agreement (BE4 and Higher Version without gross-up or window period-2009 version). |
| | | |
| 10.22† | | Form of Change of Control Employment Agreement (BE4 and Higher Version) (filed as Exhibit 10.1 to Registrant's Current Report on Form 8-K dated November 18, 2008, and incorporated herein by reference). |
| | | |
| 10.22A† | | Schedule of Named Executive Officers Party to Change of Control Employment Agreement (BE4 and Higher Version). |
| | | |
| 10.23† | | Form of Change of Control Employment Agreement (BE2-BE3 Version) (filed as Exhibit 10.2 to Registrant's Current Report on Form 8-K dated November 18, 2008, and incorporated herein by reference). |
| | | |
| 10.24† | | Form of Change of Control Employment Agreement (BE4 and Higher Version without gross-up or window period-current) (filed as Exhibit 10.2 to Registrant's Quarterly Report on Form 10-Q for the quarter ended September 30, 2015, and incorporated herein by reference). |
| | | |
| 10.25† | | Waiver of Senior Executive Officers dated November 14, 2008 (filed as Exhibit 10.2 to Registrant's Current Report on Form 8-K dated November 13, 2008, regarding U.S. Department of Treasury's Capital Purchase Program, and incorporated herein by reference). |
| | | |
| 11 | | Statement regarding Computation of Net Income Per Common Share (incorporated by reference from Note 15 on page F-91 of this Annual Report on Form 10-K). |
| | | |
| 12 | | (not applicable) |
| | | |
| 13 | | (not applicable) |
| | | |
|
| | |
| 14 | | (not applicable) |
| | | |
| 16 | | (not applicable) |
| | | |
| 18 | | (not applicable) |
| | | |
| 21 | | Subsidiaries of Registrant. |
| | | |
| 22 | | (not applicable) |
| | | |
| 23.1 | | Consent of Ernst & Young LLP. |
| | | |
| 24 | | (not applicable) |
| | | |
| 31.1 | | Chairman and CEO Rule 13a-14(a)/15d-14(a) Certification of Periodic Report (pursuant to Section 302 of the Sarbanes-Oxley Act of 2002). |
| | | |
| 31.2 | | Vice Chairman and CFO Rule 13a-14(a)/15d-14(a) Certification of Periodic Report (pursuant to Section 302 of the Sarbanes-Oxley Act of 2002). |
| | | |
| 32 | | Section 1350 Certification of Periodic Report (pursuant to Section 906 of the Sarbanes-Oxley Act of 2002). |
| | | |
| 33 | | (not applicable) |
| | | |
| 34 | | (not applicable) |
| | | |
| 35 | | (not applicable) |
| | | |
| 95 | | (not applicable) |
| | | |
| 99 | | (not applicable) |
| | | |
| 100 | | (not applicable) |
| | | |
| 101 | | Financial statements from Annual Report on Form 10-K of the Registrant for the year ended December 31, 2015, formatted in Extensible Business Reporting Language: (i) the Consolidated Balance Sheets, (ii) the Consolidated Statements of Income, (iii) the Consolidated Statements of Changes in Shareholders' Equity, (iv) the Consolidated Statements of Cash Flows and (v) the Notes to Consolidated Financial Statements. |
| | | |
| † | | Management contract or compensatory plan or arrangement. |
| | | |
| | | File No. for all filings under Exchange Act, unless otherwise noted: 1-10706. |