
| YEAR ENDED DECEMBER 31 | 2017 | 2016 | % Change |
|---|---|---|---|
| Financial Performance | |||
| Net interest income | $2,061 | $1,797 | 15% |
| Net interest margin | 3.12% | 2.71% | % |
| Provision for credit losses | 74 | 248 | (70) |
| Net charge-off ratio | 0.19% | 0.32% | % |
| Noninterest income | 1,107 | 1,051 | 5 |
| Noninterest expense | 1,860 | 1,930 | (4) |
| Provision for income tax | 491 | 193 | 154 |
| Net income available to common shareholders | 738 | 473 | 56 |
| Diluted net income per share | 4.14 | 2.68 | 54 |
| Book value per share | 46.07 | 44.47 | 4 |
| Selected Ratios | |||
| Return on average common shareholders’ equity | 9.34% | 6.22% | 50 |
| Return on average assets | 1.04 | 0.67 | 55 |
| Common equity Tier 1 capital ratio (12/31/17) | 11.68 | 11.09 | 4 |
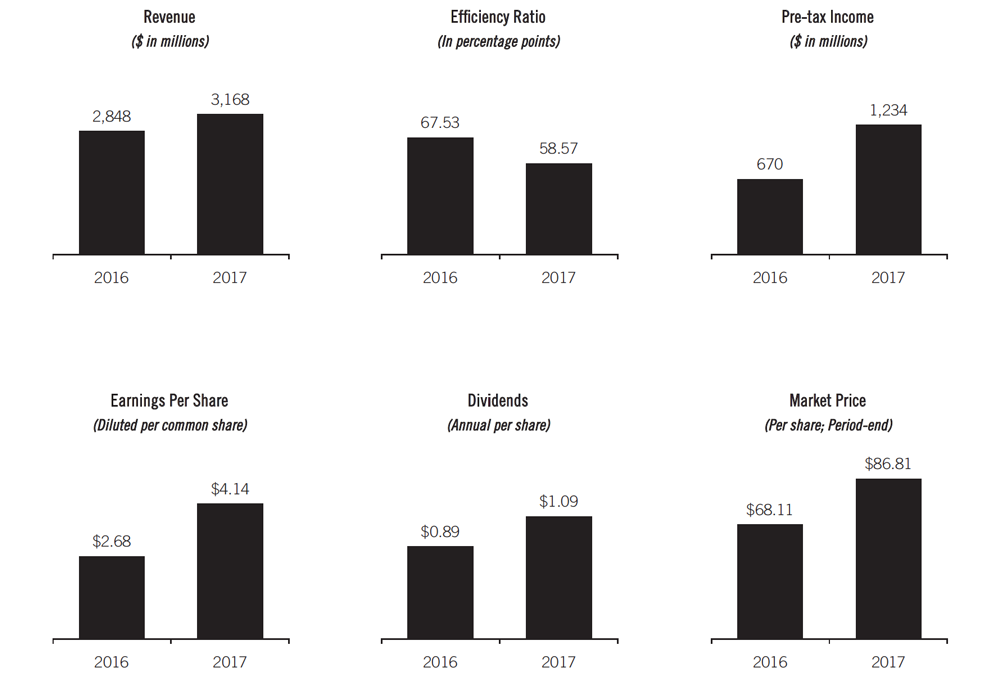

We began 2017 with clear strategic objectives, and we delivered solid outcomes, including record revenue, an 84 percent increase in pre-tax income and significant increases in our returns. In diligent fashion, our team made substantial progress on our goals of further enhancing financial performance, technology, products, corporate responsibility, diversity and community involvement. Our stock’s performance continued to positively reflect the advancements we have made.
We continued to successfully implement our action-oriented improvement plan—GEAR Up—which was launched in mid-2016 to drive efficiencies and revenue. It’s working. A 5 percent increase in fee income and a 4 percent decrease in expenses in 2017 demonstrate that we are reaping substantial and sustainable benefits from this enterprise-wide initiative. With enhanced training, improved customer analytics and increased marketing capacity, we are starting to see growth in our revenue base from developing deeper customer relationships. On the expense side, we obtained significant savings from several of our larger initiatives, most notably from the retirement program redesign and banking center consolidations. Through GEAR Up, we realized $30 million in revenue benefits and reached $150 million in expense savings through 2017. Our goal is to drive additional annual pre-tax income of $305 million by the end of 2019, relative to when the initiative began. Benefits we expect to realize in 2018 include the migration of a significant number of our applications to the secure cloud. Also, we expect to complete the automation and streamlining of our end-to-end credit process.
As we continue to grow our business and position Comerica for the future, we’ve been encouraged by external factors, such as higher interest rates, tax reform and the potential for regulatory relief. Our balance sheet remains well positioned to benefit from rate increases, with over 90 percent of our loans tied to floating rates and about half of our deposits noninterest-bearing at year-end 2017. The Federal Reserve increased interest rates four times since December 2016, resulting in more than a $200 million increase in our net interest income, as we prudently managed loan and deposit pricing. The Fed signaled in December that it could raise rates three more times in 2018.
While it is still too early to determine the full impact, it appears that the tax reform act Congress passed in December will be great for Comerica and our customers, as well as help drive U.S. economic growth. We distributed some of the benefit of lower taxes to our hardworking team by raising our minimum wage to $15 per hour and paid approximately 4,500 non-officer colleagues (more than half of our workforce) a one-time bonus of $1,000. We value our team and strive to provide competitive compensation packages that attract and retain the best talent.
On the regulatory front, we have recently witnessed some positive developments as well, including a white paper issued by the Treasury and a bipartisan compromise on regulatory relief bills for financial institutions. The changes outlined could allow us to actively manage capital and liquidity on a real-time basis. They also have the potential to lower related expenses, for example by reducing the amount of data management required and simplifying regulatory compliance processes. As one of the smallest banks subject to CCAR and LCR and with a relatively simple business model, we are subject to a disproportionate burden. We are closely monitoring the developments and hope to see additional action in 2018. The ultimate benefit will depend on what changes are made, as well as how they are interpreted and implemented.
We remain committed to being a trusted advisor to our customers as we’ve been preparing for a new age in banking. Our technology transformation strategy, TechVision2020, is one of our top priorities. We have been investing and will continue to invest in technology to enhance the customer experience, increase efficiency through simplification and take risk management to the next level. While the list of projects is long, here are a few examples. We rolled out improved information reporting and mobility tools for our commercial customers. We also deployed new platforms for consumer loans and mortgages. We’re upgrading our customer contact centers to leverage biometric authentication, natural language processing and robotics. We are employing tools, such as robust data analytics, to match our customers’ banking habits with products and services to meet their needs. In risk management, we will be utilizing state-of-the-art behavioral monitoring to reduce fraud.
Additionally, we are installing a new customer relationship management platform across the bank. We believe TechVision2020 provides us the blueprint to strengthen our core technology infrastructure as we continue our transformation.
Comerica demonstrated its resiliency in 2017 as we dealt with some unique challenges. For instance, we weathered several major natural disasters. In addition to the California wildfires, Hurricanes Harvey and Irma temporarily disrupted business at some of our locations, affecting our customers and colleagues. But thanks to the preparedness of our team, we were able to unite, recover and assist those in need. Furthermore, in support of our communities, we proudly partnered with the American Red Cross plus other organizations to donate more than $100,000 to assist in the hurricane-related disaster recovery efforts.
Revenue grew 11 percent in 2017, an all-time record. This included a 15 percent increase in net interest income, which benefited from higher interest rates as we prudently managed loan and deposit pricing. In addition, successful execution of our GEAR Up initiative helped increase fee income and lowered expenses. Credit quality remained strong with a net charge-off ratio of 19 basis points, well below our historical norm, even as we continued to navigate the energy cycle. Our tax provision included a $107 million charge to adjust deferred taxes resulting from the enactment of the Tax Cuts and Jobs Act. Altogether, we generated net income of $743 million, an increase of 56 percent over 2016, and drove significant increases in our returns as well as an efficiency ratio of 58 percent.
Excluding cyclical declines in Energy and Mortgage Banker, average loans increased $670 million. Loans grew in most other businesses, led by National Dealer Services as well as Corporate and Private Banking. Average noninterest-bearing deposits grew 4 percent; however, this was more than offset by a decline in interest-bearing deposits. The decrease was primarily due to customers using their excess liquidity for working capital needs and acquisitions, our deliberate approach to relationship pricing, as well as strategic actions we took in light of Liquidity Coverage Ratio requirements.
Our capital position remains strong. The first and most important use of capital is to invest in profitable growth. Since we are generating more capital than we can deploy, 3returning excess capital to our shareholders is a priority. We repurchased approximately 7.3 million shares in 2017 under our equity repurchase program. With increases in July and October, our board of directors raised our quarterly dividend a total of 30 percent. Through the share buyback and dividends, we returned $724 million to our shareholders, a 58 percent increase over 2016.
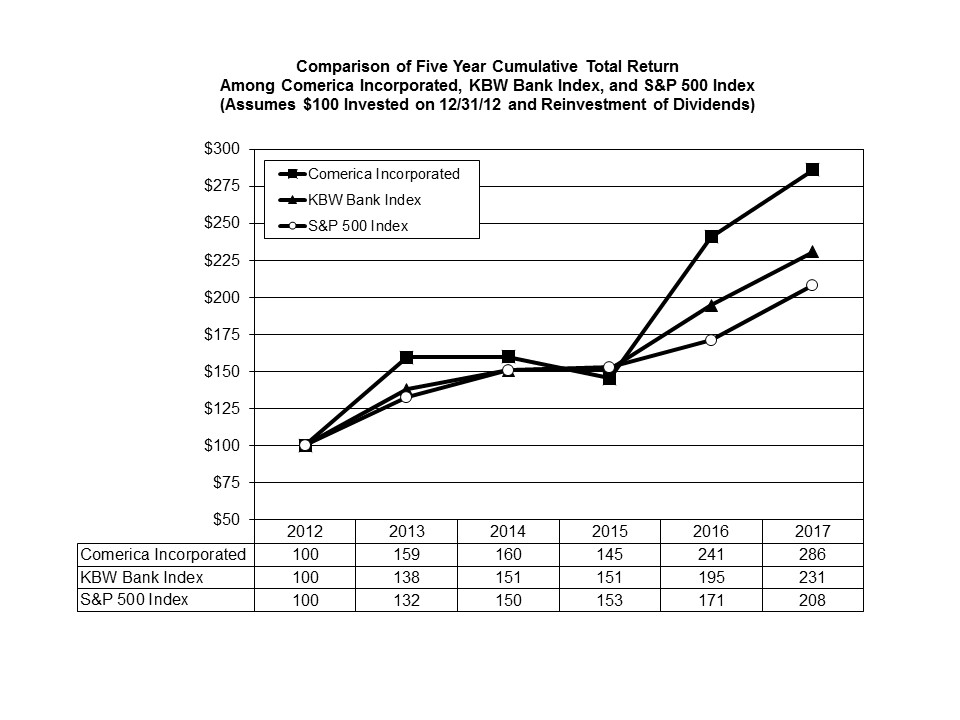
We believe our stock’s market value, which increased 27 percent in 2017, reflects our solid financial performance, which included the benefit of deliberate balance sheet positioning and delivering on GEAR Up targets, as well as investors’ acknowledgement of the value of our relationship banking model. For the second consecutive year, Comerica’s stock outperformed all our peers, as well as the KBW Bank Index and the S&P500 Index.
We recognize that customer loyalty begins with building connections. Being a trusted advisor means we are committed to forming enduring relationships, rather than short-term gains. With long-tenured employees who have deep expertise in the businesses they serve, we deliver high-quality financial services. For example, the average Middle Market banker has been with Comerica for 11 years, and the average tenure of their managers is 22 years. Our relationship-based strategy, combined with our attractive geographic footprint, helps drive our success.
We have a unique geographic footprint that is well situated with a strong presence in the major metropolitan areas of Texas, California and Michigan, providing us with a balanced market presence. We also have locations in Arizona and Florida, with certain businesses operating in several other states, as well as Canada and Mexico. A single, integrated platform across our markets provides significant synergies that are highly efficient, yet cost effective. While our markets are not contiguous, they are complementary. Our footprint provides diversity to our portfolio, reduces risk, and provides important counterbalances for us as economic conditions change.
Our headquarters is located in Dallas, Texas, and we have over 120 banking centers in the Dallas, Houston, Austin and San Antonio areas. Over the past two years, our Texas growth has been affected by the energy cycle. Strategically, we have reduced the size of our energy portfolio by $1.2 billion since year-end 2015 and have successfully managed credit losses.
We believe this will be less of a headwind going forward, and the Texas economy is expected to grow faster than the national average in 2018.
We are a market leader in Michigan, where we have been operating for 169 years. With over 190 banking centers, we maintain a strong deposit base. Over 50 percent of our loans in Michigan are to middle market companies. After several years of contraction, loans have begun to increase, and we expect this to continue as the Michigan economy grows and diversifies. We are very excited about the renaissance underway in Detroit. We look forward to participating in its continued revitalization through our financial support of new developments along the Woodward Corridor and in Corktown, in addition to our continued support of many of Detroit’s sports teams.
California, the largest economy in the United States, is where we have more than 95 banking centers positioned in the major metropolitan areas of San Francisco, San Jose, Los Angeles and San Diego. California accounts for 37 percent of our total loans and contributed most to our loan growth in 2017, led by Private Banking, National Dealer Services and general Middle Market. Economic activity in California was slightly above the national average for 2017 and is expected to continue to outperform in 2018.
We are aligned by three business segments—the Business Bank, the Retail Bank and Wealth Management. Each segment made significant strides in 2017.
By providing comprehensive financial solutions, the Business Bank experienced broad-based growth across our various business lines. Putting aside cyclical declines in Energy and Mortgage Banker, we achieved solid loan growth in National Dealer Services, U.S. Banking, Technology and Life Sciences (driven by Equity Fund Services), as well as Environmental Services. In addition, fee income increased 5 percent, which benefitted from enhanced treasury management solutions, including enabling our customers to more efficiently manage their business through reporting and mobile capabilities.
We continue to implement enhancements to our sales and service model for our Middle Market businesses, delivering tools and sharing best practices with the goal of driving faster, more efficient growth. Early results were demonstrated by the record number of new Middle Market banking relationships we won in California, which drove their strong loan and deposit growth. Our relationship model and high standards for customer service distinguish us from competitors. For instance, for the third time in the last four years, our Captive Insurance group was named the “U.S. Captive Collateral Service Provider” of the year by Captive Review Magazine. Comerica also was a recipient of the national Greenwich Excellence Award for Middle Market Banking in 2017 for overall customer satisfaction.
Our Retail Bank is a vital part of our deposit gathering and revenue growth strategy. It is imperative that we have the products, services and locations to meet our customers’ needs. Our success is demonstrated by the more than $400 million increase in average Retail Bank deposits in 2017 along with our team’s efforts to drive customer engagement. To maximize the mobile banking experience, Retail Bank delivered on innovation with a major upgrade across mobile devices. We integrated and expanded our real-time alerts and implemented new features for our customers such as the ability to log-in using Touch ID for iPhones, view check images and perform transaction searches. We also launched an Android tablet application. Through these initiatives, we achieved our goal of providing our customers with more convenient features to manage their finances anytime and anywhere. In this ever-evolving age of technology, part of our ongoing service commitment is to provide customers with more secure, authenticated ways to make transactions. In 2017, our Retail Bank team converted to a state-of-the-art debit card platform and completed a brand conversion, efficiently reissuing more than 500,000 new chip-embedded debit cards to better protect our customers’ information during usage, such as point of sale transactions.
We have a variety of tools and information to help small businesses reach their goals, whatever they may be. These customers found our commercial and merchant card offering increased their efficiency. As a result, Small Business card fees increased more than 20 percent in 2017, primarily related to new and expanded merchant card business.
Wealth Management> enables us to bring private banking, investment management and fiduciary services to our Business Bank and Retail Bank clients. In 2017, the Wealth Management team delivered a strong performance by growing average loans over 4 percent and fee income by 5 percent, including a 4 percent increase in fiduciary income. We launched our Wealth Productivity initiative, which incorporates a relationship management tool to enable our colleagues to better serve our clients, and ultimately, drive increased market share. We also continued to enhance our investment management platform by adding new advisors. Finally, our Professional Trust Alliance remains diligent in building business. Currently, we have agreements with 17 alliance partners. This business has become a significant contributor to our fee income and assets under management continue to grow at a strong pace.
We recognize that maintaining customer confidence is a key component to our relationship banking strategy. As cyber threats evolve, we continue to invest in protecting our customers. In 2017, we increased customer communications, recruited and trained highly-skilled colleagues, and enhanced our security detection capabilities. We take a proactive approach to cybersecurity, making sure we understand the threats and vulnerabilities that exist in the world, and that the necessary safeguards are in place to help protect against potential risks. Our robust, in-depth defense strategy also focuses on responsiveness and recovery capabilities. We have technical experts who are constantly reassessing our processes and best practices, while monitoring systems around the clock and adjusting as necessary.
Our board of directors provides Comerica with strong guidance and direction. Along with executive management, our board regularly reviews, and ensures that we adhere to, our long-term corporate strategy. Much of that strategy, and the necessary tactics to achieve it, stems from knowing who we are: a non-complex, regional, commercially-focused bank. We are dedicated to serving our communities by meeting their basic financial needs, with an emphasis on our core capabilities of taking deposits and making loans.
Our long-term value is generated not by sheer scale, but rather through a sustainable competitive advantage with a customer base we understand, and a conservative approach to risk, capital management and operations. We strive to build enduring relationships that drive superior credit quality, a stable funding base and consistent returns that meet our shareholders’ expectations. Collectively, our 10 independent directors bring a wealth of skills, experiences, diversity and knowledge that allow them to effectively address the interests of Comerica’s four core constituencies: our shareholders, our customers, our colleagues and the communities we serve each day.
In 2017, our board appointed a new independent director, Barbara R. Smith, chairman, president and chief executive officer of Texas-based Commercial Metals Company. She brings to our board many key skills, including relevant business management experience and knowledge of our geographic markets, as well as significant financial expertise garnered through the chief financial officer roles she previously held.
At the end of 2017, long-time board member Alfred A. Piergallini retired. He was appointed to the Comerica board in 1991. His experience and insights were invaluable, particularly as we navigated complex regulations and the changing landscape of the financial services industry. We are thankful for the contributions that Al made to Comerica over 26 years.
Comerica is only as strong as the communities we serve, and that is why we invest in them, helping ensure they remain vibrant. Annual events, financial education programs, corporate giving and our drive for sustainability were just some of the ways Comerica continued to shine in the community in 2017. Our Corporate Responsibility report, which can be found on Comerica.com, provides a comprehensive review of our active environmental, social and governance program. Here are a few highlights.
Our most visible community event – Shred Day – held in Dallas/Fort Worth, Houston, Phoenix and Detroit, experienced a banner year with a record 862,087 pounds of paper recycled. The DFW event shattered its previous record, collecting more than 548,000 pounds. In the process, we raised awareness of the Comerica brand, helped reduce fraud and identity theft, preserved the environment by freeing up space in local landfills and helped fight hunger in our communities with a connected food drive.
Empowering youth and adults to become good financial stewards remains a key component in Comerica’s commitment to our communities. In 2017, we touched the lives of thousands of students through our Money $ense, Gift of Knowledge, Empower Series and youth savings programs. Also, these educational opportunities created dialogue with our communities to showcase Comerica as a trusted advisor.
Comerica, along with our colleagues, continued to serve as pillars in the community, distributing $7.9 million in contributions to nonprofit organizations and logging nearly 68,000 volunteer hours.
Our commitment to fostering a diverse work environment garnered national recognition in 2017. For the fourth consecutive year, we earned a perfect rating on the Human Rights Campaign’s Corporate Equality Index, resulting in designation as a Best Place to Work for LGBTQ Equality. For the fifth consecutive year, Comerica was named to LATINO Magazine’s “LATINO 100” list – an honor bestowed on companies providing opportunities for Latinos. And for the third consecutive year, Comerica was ranked No. 2 on DiversityInc’s 2017 Top Regional Companies for diversity.
We are dedicated to protecting and preserving the environment. Significant strides were made in achieving our 2020 Environmental Sustainability Goals to reduce emissions, water consumption, waste generation and paper usage. Topping the list of accomplishments for 2017 was the achievement of our 2020 greenhouse gas (GHG) reduction goal three years ahead of schedule with a reduction of 22.4 percent relative to our 20 percent target. This was one component which helped us achieve an A- rating by CDP (Carbon Disclosure Project) for our climate change management strategy and emission reduction efforts. The honor places Comerica among the top 16 percent of responders within the U.S. financial services industry. The year also marked our first mapping to demonstrate how Comerica’s actions reflect the United Nations’ 17 Sustainable Development Goals. We also supported our customers’ sustainability efforts through over $830 million in environmentally beneficial loans and commitments in 13 different green loan categories.
We are focused on continuing to enhance shareholder value by delivering solid results and positioning Comerica well for the future. Significant progress was made in 2017. Our relationship banking strategy and prudent management of loan and deposit pricing helped drive record revenue as interest rates increased. It’s been energizing to see the results we’ve achieved with our GEAR Up initiative, and that speaks to the perseverance and dedication of our 8,000 colleagues. Over the years, we’ve witnessed the ebbs and flows of the banking industry in response to the varying economic cycles. Today, we are experiencing an upswing and we believe Comerica is well situated to benefit from lower tax rates, further interest rate increases and favorable changes in regulation. We operate with a “go forward” approach and remain committed to being responsible stewards of our shareholders’ capital by growing relationships, continued implementation of our GEAR Up initiative and returning excess capital to our investors.
Comerica’s success story is not only told through our promise to “raise expectations of what a bank can be,” but also through our core values of diversity, collaboration, agility, excellence, customer-centricity, integrity and involvement. These are not merely words, but values we practice daily. Thank you for your support in 2017.
Sincerely,

(1) Audit Committee
(2) Governance, Compensation and Nominating Committee
(3) Qualified Legal Compliance Committee
(4) Enterprise Risk Committee
|
Delaware |
38-1998421 | |
|
(State
or Other Jurisdiction of Incorporation) |
(IRS
Employer Identification
Number) | |
|
Large
accelerated filer ý |
Accelerated
filer o
| |
|
Non-accelerated
filer o
(Do
not check if a smaller reporting company) |
Smaller
reporting company o | |
|
Emerging
growth company o | ||
|
F-1 | |
|
S-1 | |
|
• |
People: Including the
competence, integrity and succession planning of
customers. |
|
• |
Purpose: The legal, logical
and productive purposes of the credit
facility. |
|
• |
Payment: Including the
source, timing and probability of
payment. |
|
• |
Protection: Including
obtaining alternative sources of repayment, securing the loan, as
appropriate, with collateral and/or third-party guarantees and ensuring
appropriate legal documentation is
obtained. |
|
• |
Perspective: The
risk/reward relationship and pricing elements (cost of funds; servicing
costs; time value of money; credit risk). |
|
• |
The borrower's business
model. |
|
• |
Periodic review of
financial statements including financial statements audited by an
independent certified public accountant when
appropriate. |
|
• |
The pro-forma financial
condition including financial
projections. |
|
• |
The borrower's sources and
uses of funds. |
|
• |
The borrower's debt service
capacity. |
|
• |
The guarantor's financial
strength. |
|
• |
A comprehensive review of
the quality and value of collateral, including independent third-party
appraisals of machinery and equipment and commercial real estate, as
appropriate, to determine the advance
rates. |
|
• |
Physical inspection of
collateral and audits of receivables, as
appropriate. |
|
• |
General
political, economic or industry conditions, either domestically or
internationally, may be less favorable than
expected. |
|
• |
Governmental
monetary and fiscal policies may adversely affect the financial services
industry, and therefore impact Comerica's financial condition and results
of operations. |
|
• |
Proposed
revenue enhancements and efficiency improvements may not be
achieved. |
|
• |
Operational
difficulties, failure of technology infrastructure or information security
incidents could adversely affect Comerica's business and
operations. |
|
• |
Comerica
relies on other companies to provide certain key components of its
delivery systems, and certain failures could materially adversely affect
operations. |
|
• |
Comerica
must maintain adequate sources of funding and liquidity to meet regulatory
expectations, support its operations and fund outstanding
liabilities. |
|
• |
Compliance
with more stringent capital and liquidity requirements may adversely
affect Comerica. |
|
• |
Declines
in the businesses or industries of Comerica's customers could cause
increased credit losses or decreased loan balances, which could adversely
affect Comerica. |
|
• |
Unfavorable
developments concerning credit quality could adversely affect Comerica's
financial results. |
|
• |
Changes
in the financial markets, including fluctuations in interest rates and
their impact on deposit pricing, could adversely affect Comerica's net
interest income and balance sheet. |
|
• |
Interest
rates on Comerica's outstanding financial instruments might be subject to
change based on regulatory developments, which could adversely affect its
revenue, expenses, and the value of those financial
instruments. |
|
• |
Reduction
in our credit ratings could adversely affect Comerica and/or the holders
of its securities. |
|
• |
Damage
to Comerica’s reputation could damage its
businesses. |
|
• |
Comerica
may not be able to utilize technology to efficiently and effectively
develop, market, and deliver new products and services to its customers.
|
|
• |
Competitive
product and pricing pressures within Comerica's markets may
change. |
|
• |
The
soundness of other financial institutions could adversely affect
Comerica. |
|
• |
The
introduction, implementation, withdrawal, success and timing of business
initiatives and strategies may be less successful or may be different than
anticipated, which could adversely affect Comerica's
business. |
|
• |
Changes
in customer behavior may adversely impact Comerica's business, financial
condition and results of operations. |
|
• |
Management's
ability to maintain and expand customer relationships may differ from
expectations. |
|
• |
Methods
of reducing risk exposures might not be
effective. |
|
• |
Catastrophic
events, including, but not limited to, hurricanes, tornadoes, earthquakes,
fires, droughts and floods, may adversely affect the general economy,
financial and capital markets, specific industries, and
Comerica. |
|
• |
The
impacts of recent tax reform are not yet fully known, and these and other
tax regulations could be subject to potential legislative, administrative
or judicial changes or interpretations. |
|
• |
Any
future strategic acquisitions or divestitures may present certain risks to
Comerica's business and operations. |
|
• |
Management's
ability to retain key officers and employees may
change. |
|
• |
Legal
and regulatory proceedings and related matters with respect to the
financial services industry, including those directly involving Comerica
and its subsidiaries, could adversely affect Comerica or the financial
services industry in general. |
|
• |
Terrorist
activities or other hostilities may adversely affect the general economy,
financial and capital markets, specific industries, and
Comerica. |
|
• |
Changes
in accounting standards could materially impact Comerica's financial
statements. |
|
• |
Comerica's
accounting policies and processes are critical to the reporting of
financial condition and results of operations. They require management to
make estimates about matters that are uncertain.
|
|
• |
Comerica's
stock price can be volatile. |
|
• |
Actual
or anticipated variations in quarterly results of
operations. |
|
• |
Recommendations
or projections by securities analysts. |
|
• |
Operating
and stock price performance of other companies that investors deem
comparable to us. |
|
• |
News
reports relating to trends, concerns and other issues in the financial
services industry. |
|
• |
Perceptions
in the marketplace regarding us and/or our
competitors. |
|
• |
New
technology used, or services offered, by
competitors. |
|
• |
Significant
acquisitions or business combinations, strategic partnerships, joint
ventures or capital commitments by or involving Comerica or its
competitors. |
|
• |
Changes
in dividends and capital returns. |
|
• |
Changes
in government regulations. |
|
• |
Cyclical
fluctuations. |
|
• |
Geopolitical
conditions such as acts or threats of terrorism or military
conflicts. |
|
• |
Activity
by short sellers and changing government restrictions on such
activity. |
|
Quarter |
High |
Low |
Dividends Per
Share |
Dividend Yield* | |||||||||||
|
2017 |
|||||||||||||||
|
Fourth |
$ |
88.22 |
|
$ |
74.16 |
|
$ |
0.30 |
|
1.5 |
% | ||||
|
Third |
76.76 |
|
64.04 |
|
0.30 |
|
1.7 |
| |||||||
|
Second |
75.30 |
|
64.75 |
|
0.26 |
|
1.5 |
| |||||||
|
First |
75.00 |
|
64.27 |
|
0.23 |
|
1.3 |
| |||||||
|
2016 |
|||||||||||||||
|
Fourth |
$ |
70.44 |
|
$ |
46.75 |
|
$ |
0.23 |
|
1.6 |
% | ||||
|
Third |
47.81 |
|
38.39 |
|
0.23 |
|
2.1 |
| |||||||
|
Second |
47.55 |
|
36.27 |
|
0.22 |
|
2.1 |
| |||||||
|
First |
41.74 |
|
30.48 |
|
0.21 |
|
2.3 |
| |||||||
|
*
Dividend yield is calculated by annualizing the quarterly dividend per
share and dividing by an average of the high and low price in the
quarter. | |||||||||||||||
|
(shares
in thousands) |
Total Number of Shares
and
Warrants Purchased
as Part
of Publicly
Announced
Repurchase
Plans
or Programs (a) |
Remaining
Repurchase
Authorization
(b) |
Total Number
of
Shares
Purchased
(c) |
Average
Price
Paid Per
Share | ||||||||
|
Total
first quarter 2017 |
1,498 |
|
11,756 |
|
1,694 |
|
$ |
69.75 |
| |||
|
Total
second quarter 2017 |
2,011 |
|
9,634 |
|
2,015 |
|
69.09 |
| ||||
|
Total
third quarter 2017 |
1,955 |
|
12,395 |
|
(d) |
1,956 |
|
71.11 |
| |||
|
October
2017 |
797 |
|
11,589 |
|
799 |
|
77.36 |
| ||||
|
November
2017 |
753 |
|
10,836 |
|
753 |
|
79.17 |
| ||||
|
December
2017 |
314 |
|
10,387 |
|
314 |
|
85.05 |
| ||||
|
Total
fourth quarter 2017 |
1,864 |
|
10,387 |
|
1,866 |
|
79.38 |
| ||||
|
Total
2017 |
7,328 |
|
10,387 |
|
7,531 |
|
$ |
72.31 |
| |||
|
(a) |
Comerica
made no repurchases of warrants under the repurchase program during the
year ended December 31,
2017.
Upon exercise of a warrant, the number of shares with a value equal to the
aggregate exercise price is withheld from an exercising warrant holder as
payment (known as a "net exercise provision"). During the year ended
December 31,
2017,
Comerica withheld the equivalent of approximately 1,209,000 shares
to cover an aggregate of $35.6
million
in exercise price and issued approximately 1,771,000 shares
to the exercising warrant holders. Shares withheld in connection with the
net exercise provision are not included in the total number of shares or
warrants purchased in the above table. |
|
(b) |
Maximum
number of shares and warrants that may yet be purchased under the publicly
announced plans or programs. |
|
(c) |
Includes
approximately 203,000 shares
(including 2,000 shares
in the quarter ended December 31,
2017)
purchased pursuant to deferred compensation plans and shares purchased
from employees to pay for taxes related to restricted stock vesting under
the terms of an employee share-based compensation plan during the year
ended December 31,
2017.
These transactions are not considered part of Comerica's repurchase
program. |
|
(d) |
Includes
July 25,
2017
equity repurchase authorization for up to an additional 5
million
shares. |
|
1. |
Financial
Statements: The financial statements that are filed as part of this report
are included in the Financial Section on pages F-40 through
F-107. | |
|
2. |
All
of the schedules for which provision is made in the applicable accounting
regulations of the SEC are either not required under the related
instruction, the required information is contained elsewhere in the
Form 10-K, or the schedules are inapplicable and therefore have been
omitted. | |
|
3. |
Exhibits:
| |
|
3.1 |
||
|
3.2 |
||
|
3.3 |
||
|
4 |
[Reference
is made to Exhibits 3.1, 3.2 and 3.3 in respect of instruments
defining the rights of security holders. In accordance with
Regulation S-K Item No. 601(b)(4)(iii), the Registrant is not
filing copies of instruments defining the rights of holders of long-term
debt because none of those instruments authorizes debt in excess of 10% of
the total assets of the registrant and its subsidiaries on a consolidated
basis. The Registrant hereby agrees to furnish a copy of any such
instrument to the SEC upon request.] | |
|
4.1 |
||
|
4.2 |
||
|
4.3 |
||
|
4.3A |
||
|
4.4 |
||
|
9 |
(not
applicable) | |
|
10.1† |
||
|
10.1A† |
||
|
10.1B† |
||
|
10.1C† |
||
|
10.1D† |
||
|
10.1E† |
||
|
10.1F† |
||
|
10.1G† |
||
|
10.1H† |
||
|
10.1I† |
||
|
10.1J† |
||
|
10.1K† |
||
|
10.1L† |
||
|
10.1M† |
||
|
10.1N† |
||
|
10.1O† |
||
|
10.1P† |
||
|
10.1Q† |
||
|
10.1R† |
||
|
10.1S† |
||
|
10.1T† |
||
|
10.1U† |
||
|
10.1V† |
||
|
10.1W† |
||
|
10.1X† |
||
|
10.1Y† |
||
|
10.2† |
||
|
10.2A† |
||
|
10.3† |
||
|
10.4† |
||
|
10.5† |
||
|
10.6† |
||
|
10.7† |
||
|
10.8† |
||
|
10.9† |
||
|
10.10† |
||
|
10.11† |
||
|
10.12† |
||
|
10.13† |
||
|
10.14† |
||
|
10.14A† |
||
|
10.14B† |
||
|
10.14C† |
||
|
10.14D† |
||
|
10.14E† |
||
|
10.15† |
||
|
10.15A† |
||
|
10.16† |
||
|
10.17† |
||
|
10.18† |
||
|
10.19A† |
||
|
10.19B† |
||
|
10.19C† |
||
|
10.19D† |
||
|
10.20† |
||
|
10.20A† |
||
|
10.21† |
||
|
10.21A† |
||
|
10.22† |
||
|
10.23† |
||
|
10.23A† |
||
|
11 |
Statement
regarding Computation of Net Income Per Common Share (incorporated by
reference from Note 15 on page F-84 of this Annual Report on
Form 10-K). | |
|
12 |
(not
applicable) | |
|
13 |
(not
applicable) | |
|
14 |
(not
applicable) | |
|
16 |
(not
applicable) | |
|
18 |
(not
applicable) | |
|
21 |
||
|
22 |
(not
applicable) | |
|
23.1 |
||
|
24 |
(not
applicable) | |
|
31.1 |
||
|
31.2 |
||
|
32 |
||
|
33 |
(not
applicable) | |
|
34 |
(not
applicable) | |
|
35 |
(not
applicable) | |
|
95 |
(not
applicable) | |
|
99 |
(not
applicable) | |
|
100 |
(not
applicable) | |
|
101 |
Financial
statements from Annual Report on Form 10-K of the Registrant for the
year ended December 31, 2017, formatted in Extensible Business
Reporting Language: (i) the Consolidated Balance Sheets,
(ii) the Consolidated Statements of Income, (iii) the
Consolidated Statements of Changes in Shareholders' Equity, (iv) the
Consolidated Statements of Cash Flows and (v) the Notes to
Consolidated Financial Statements. | |
|
† |
Management
contract or compensatory plan or arrangement. | |
|
|
File
No. for all filings under Exchange Act, unless otherwise noted:
1-10706. | |
|
(dollar
amounts in millions, except per share data) |
|||||||||||||||||||
|
Years
Ended December 31 |
2017 |
2016 |
2015 |
2014 |
2013 | ||||||||||||||
|
EARNINGS
SUMMARY |
|||||||||||||||||||
|
Net
interest income |
$ |
2,061 |
|
$ |
1,797 |
|
$ |
1,689 |
|
$ |
1,655 |
|
$ |
1,672 |
| ||||
|
Provision
for credit losses |
74 |
|
248 |
|
147 |
|
27 |
|
46 |
| |||||||||
|
Noninterest
income |
1,107 |
|
1,051 |
|
1,035 |
|
(a) |
857 |
|
874 |
| ||||||||
|
Noninterest
expenses |
1,860 |
|
(b) |
1,930 |
|
(b) |
1,827 |
|
(a) |
1,615 |
|
1,714 |
| ||||||
|
Provision
for income taxes |
491 |
|
(c) |
193 |
|
229 |
|
277 |
|
245 |
| ||||||||
|
Net
income |
743 |
|
477 |
|
521 |
|
593 |
|
541 |
| |||||||||
|
Net
income attributable to common shares |
738 |
|
473 |
|
515 |
|
586 |
|
533 |
| |||||||||
|
PER
SHARE OF COMMON STOCK |
|||||||||||||||||||
|
Diluted
earnings per common share |
$ |
4.14 |
|
$ |
2.68 |
|
$ |
2.84 |
|
$ |
3.16 |
|
$ |
2.85 |
| ||||
|
Cash
dividends declared |
1.09 |
|
0.89 |
|
0.83 |
|
0.79 |
|
0.68 |
| |||||||||
|
Common
shareholders’ equity |
46.07 |
|
44.47 |
|
43.03 |
|
41.35 |
|
39.22 |
| |||||||||
|
Tangible
common equity (d) |
42.34 |
|
40.79 |
|
39.33 |
|
37.72 |
|
35.64 |
| |||||||||
|
Market
value |
86.81 |
|
68.11 |
|
41.83 |
|
46.84 |
|
47.54 |
| |||||||||
|
Average
diluted shares (in millions) |
178 |
|
177 |
|
181 |
|
185 |
|
187 |
| |||||||||
|
YEAR-END
BALANCES |
|||||||||||||||||||
|
Total
assets |
$ |
71,567 |
|
$ |
72,978 |
|
$ |
71,877 |
|
$ |
69,186 |
|
$ |
65,224 |
| ||||
|
Total
earning assets |
65,880 |
|
67,518 |
|
66,687 |
|
63,788 |
|
60,200 |
| |||||||||
|
Total
loans |
49,173 |
|
49,088 |
|
49,084 |
|
48,593 |
|
45,470 |
| |||||||||
|
Total
deposits |
57,903 |
|
58,985 |
|
59,853 |
|
57,486 |
|
53,292 |
| |||||||||
|
Total
medium- and long-term debt |
4,622 |
|
5,160 |
|
3,058 |
|
2,675 |
|
3,543 |
| |||||||||
|
Total
common shareholders’ equity |
7,963 |
|
7,796 |
|
7,560 |
|
7,402 |
|
7,150 |
| |||||||||
|
AVERAGE
BALANCES |
|||||||||||||||||||
|
Total
assets |
$ |
71,452 |
|
$ |
71,743 |
|
$ |
70,247 |
|
$ |
66,336 |
|
$ |
63,933 |
| ||||
|
Total
earning assets |
66,300 |
|
66,545 |
|
65,129 |
|
61,560 |
|
59,091 |
| |||||||||
|
Total
loans |
48,558 |
|
48,996 |
|
48,628 |
|
46,588 |
|
44,412 |
| |||||||||
|
Total
deposits |
57,258 |
|
57,741 |
|
58,326 |
|
54,784 |
|
51,711 |
| |||||||||
|
Total
medium- and long-term debt |
4,969 |
|
4,917 |
|
2,905 |
|
2,963 |
|
3,972 |
| |||||||||
|
Total
common shareholders’ equity |
7,952 |
|
7,674 |
|
7,534 |
|
7,373 |
|
6,965 |
| |||||||||
|
CREDIT
QUALITY |
|||||||||||||||||||
|
Total
allowance for credit losses |
$ |
754 |
|
$ |
771 |
|
$ |
679 |
|
$ |
635 |
|
$ |
634 |
| ||||
|
Total
nonperforming loans |
410 |
|
590 |
|
379 |
|
290 |
|
374 |
| |||||||||
|
Foreclosed
property |
5 |
|
17 |
|
12 |
|
10 |
|
9 |
| |||||||||
|
Total
nonperforming assets |
415 |
|
607 |
|
391 |
|
300 |
|
383 |
| |||||||||
|
Net
credit-related charge-offs |
92 |
|
157 |
|
101 |
|
25 |
|
73 |
| |||||||||
|
Net credit-related
charge-offs as a percentage of average total loans |
0.19 |
% |
0.32 |
% |
0.21 |
% |
0.05 |
% |
0.16 |
% | |||||||||
|
Allowance for loan losses as
a percentage of total period-end loans |
1.45 |
|
1.49 |
|
1.29 |
|
1.22 |
|
1.32 |
| |||||||||
|
Allowance for loan losses as
a percentage of total nonperforming loans |
173 |
|
124 |
|
167 |
|
205 |
|
160 |
| |||||||||
|
RATIOS |
|||||||||||||||||||
|
Net
interest margin (fully taxable equivalent) |
3.12 |
% |
2.71 |
% |
2.60 |
% |
2.70 |
% |
2.84 |
% | |||||||||
|
Return
on average assets |
1.04 |
|
0.67 |
|
0.74 |
|
0.89 |
|
0.85 |
| |||||||||
|
Return
on average common shareholders’ equity |
9.34 |
|
6.22 |
|
6.91 |
|
8.05 |
|
7.76 |
| |||||||||
|
Dividend
payout ratio |
25.77 |
|
32.48 |
|
28.33 |
|
24.09 |
|
23.29 |
| |||||||||
|
Average common shareholders’
equity as a percentage of average assets |
11.13 |
|
10.70 |
|
10.73 |
|
11.11 |
|
10.90 |
| |||||||||
|
Common equity tier 1 capital
as a percentage of risk-weighted assets (e) |
11.68 |
|
11.09 |
|
10.54 |
|
n/a |
|
n/a |
| |||||||||
|
Tier
1 capital as a percentage of risk-weighted assets (e) |
11.68 |
|
11.09 |
|
10.54 |
|
10.50 |
|
10.64 |
| |||||||||
|
Common
equity ratio |
11.13 |
|
10.68 |
|
10.52 |
|
10.70 |
|
10.97 |
| |||||||||
|
Tangible
common equity as a percentage of tangible assets (d) |
10.32 |
|
9.89 |
|
9.70 |
|
9.85 |
|
10.07 |
| |||||||||
|
(a) |
Effective
January 1, 2015, contractual changes to a card program resulted in a
change to the accounting presentation of the related revenues and
expenses. The effect of this change was an increase of $177 million in
2015 to both noninterest income and noninterest expenses. Amounts prior to
2015 reflect revenues from this card program net of related noninterest
expenses. |
|
(b) |
Noninterest
expenses included restructuring charges of $45
million
and $93
million
in 2017 and 2016, respectively. |
|
(c) |
The
provision for income taxes for 2017 was impacted by a $107 million charge
to adjust deferred taxes as a result of the enactment of the Tax Cuts and
Jobs Act. |
|
(d) |
See
Supplemental Financial Data section for reconcilements of non-GAAP
financial measures. |
|
(e) |
Ratios
calculated based on the risk-based capital requirements in effect at the
time. The U.S. implementation of the Basel III regulatory capital
framework became effective on January 1, 2015, with transitional
provisions. |
|
• |
Net income was $743 million in 2017, an increase of
$266
million, or
56
percent,
compared to $477 million in 2016. Net income per diluted
common share was $4.14 in 2017, compared to $2.68
in 2016.
Net income in 2017
included a $107 million charge to adjust deferred
tax assets (60
cents per
share) resulting from the 2017 enactment of the Tax Cuts and Jobs
Act. |
|
• |
Average loans were
$48.6
billion in
2017,
a decrease of $438 million, or 1
percent,
compared to 2016.
Excluding cyclical declines of $696 million
in Energy and
$412 million in Mortgage Banker Finance, average loans increased $670
million, or 1 percent, with growth in most other businesses, led by
National Dealer Services. |
|
• |
Average deposits decreased
$483
million, or
1
percent, to
$57.3
billion in
2017
compared to 2016.
The decrease in average deposits reflected a decrease of $1.7 billion, or 6
percent, in
average interest-bearing deposits, partially offset by an increase of
$1.3
billion, or
4
percent, in
average noninterest-bearing deposits. The decrease in interest-bearing
deposits was primarily due to customers using their excess liquidity for
working capital needs and acquisitions, a deliberate approach to
relationship pricing, as well as strategic actions taken in early
2017
in light of the new Liquidity Coverage Ratio (LCR) rules. Average total
deposits reflected decreases in Corporate Banking and Technology and Life
Sciences, partially offset by increases in Commercial Real Estate and
Retail Bank. |
|
• |
Net interest income was
$2.1
billion in
2017,
an increase
of $264
million, or
15
percent,
compared to 2016.
The increase
primarily reflected the benefit from higher short-term rates and prudently
managing loan and deposit pricing. |
|
• |
The provision for credit
losses was $74
million in
2017,
a decrease of $174 million compared to 2016,
primarily due to improvement in the credit quality in the Energy and
energy-related portfolio. Net credit-related charge-offs were $92 million, or 0.19
percent of
average loans in 2017, a decrease of
$65
million
compared to $157 million, or 0.32
percent of
average loans, in 2016. The decrease primarily
reflected lower Energy and energy-related
charge-offs. |
|
• |
Noninterest income
increased $56
million, or
5
percent, to
$1.1
billion in
2017
in part due to the impact of Growth in Efficiency and Revenue (GEAR Up)
initiatives. Increases in card fees, service charges on deposit accounts
and fiduciary income, as well as smaller increases in several other
categories of noninterest income were partially offset by decreases in
letter of credit fees and commercial lending
fees. |
|
• |
Noninterest expenses
decreased $70
million, or
4
percent, to
$1.9
billion in
2017
primarily due to decreases in salaries and benefits expense, largely
driven by the GEAR Up initiative, and restructuring charges, partially
offset by an increase in outside processing fees primarily tied to
revenue-generating activities. |
|
• |
The provision for income
taxes increased $298
million in
2017.
The increase primarily reflected an increase in pretax income and the
$107
million charge
to adjust deferred taxes resulting from the Tax Cuts and Jobs Act,
partially offset by a $35
million tax
benefit from employee stock transactions in 2017 due to new accounting
guidance for stock compensation effective January 1,
2017. |
|
• |
The quarterly dividend was
increased 13 percent to 26
cents per
share in April 2017 and further increased 15 percent to 30 cents
per share in July 2017. |
|
• |
The Corporation repurchased
approximately 7.3 million shares of common stock
during 2017
under the equity repurchase program. Together with dividends of
$1.09
per share, $724 million was returned to
shareholders in 2017, an increase of
$266
million, or
58
percent,
compared to 2016. |
|
• |
Expense reductions are
expected to total $200 million by year-end 2018 and increase to $215
million by year-end 2019, reflecting incremental savings of $50 million in
2018 and an additional $15 million in 2019. This is to be achieved through
rationalizing and modernizing technology, including optimizing
infrastructure platforms, process optimization and migrating certain
applications to cloud-based systems, as well as consolidating office and
operations space. The Corporation is in the process of implementing the
end-to-end credit design program to streamline the credit process and
increase relationship managers' capacity to service clients.
|
|
• |
Revenue enhancements are
expected to total $70 million by year-end 2018 and increase to $90 million
by year-end 2019, reflecting incremental revenue of $40 million in 2018
and an additional $20 million in 2019, achieved through product
enhancements, enhanced sales tools and training and improved customer
analytics to drive opportunities. |
|
• |
Pre-tax restructuring
charges of $185 million to $195 million in total are expected to be
incurred from inception through 2018. Cumulative pre-tax restructuring
charges of $138 million have been incurred through
December 31,
2017. For
additional information regarding restructuring charges, refer to Note
22 to the consolidated
financial statements. |
|
• |
Average loans higher in
line with Gross Domestic Product, reflecting increases in most lines of
business while remaining stable in Energy and Corporate
Banking. |
|
• |
Net interest income higher,
reflecting full-year benefits from the 2017 rate increases and loan
growth. |
|
◦ |
Full-year benefit from 2017
rate increases expected to be $110 million to $125 million, assuming a 20
percent to 40 percent deposit beta for the December rate
increase. |
|
◦ |
Elevated interest
recoveries of $28 million in 2017 not expected to repeat in
2018. |
|
• |
Provision for credit losses
of 15 basis points to 25 basis points and net charge-offs to remain low,
with continued solid performance of the overall
portfolio. |
|
• |
Excluding deferred
compensation asset returns of $8 million in 2017, noninterest income
higher by 4 percent1, benefiting from the
continued execution of GEAR Up opportunities helping to drive growth in
treasury management income, card fees, brokerage fees and fiduciary
income. |
|
• |
Excluding restructuring
charges, noninterest expenses higher by 1 percent1, reflecting an additional
$50 million benefit from the GEAR Up initiative.
|
|
◦ |
Restructuring charges of
$47 million to $57 million. |
|
◦ |
Additionally, headwinds
include higher technology expenditures and typical inflationary pressures,
as well as outside processing expenses to increase in line with growing
revenue1. |
|
• |
Income tax expense to
approximate 23 percent of pre-tax income reflecting the passage of the Tax
Cuts and Jobs Acts and assuming no tax impact from employee stock
transactions. |
|
(dollar
amounts in millions) |
||||||||||||||||||||||||||
|
Years
Ended December 31 |
2017 |
2016 |
2015 | |||||||||||||||||||||||
|
Average
Balance |
Interest |
Average
Rate
(a) |
Average
Balance |
Interest |
Average
Rate
(a) |
Average
Balance |
Interest |
Average
Rate
(a) | ||||||||||||||||||
|
Commercial
loans |
$ |
30,415 |
|
$ |
1,162 |
|
3.83 |
% |
$ |
31,062 |
|
$ |
1,008 |
|
3.26 |
% |
$ |
31,501 |
|
$ |
962 |
|
3.07 |
% | ||
|
Real
estate construction loans |
2,958 |
|
124 |
|
4.18 |
|
2,508 |
|
91 |
|
3.63 |
|
1,884 |
|
66 |
|
3.48 |
| ||||||||
|
Commercial
mortgage loans |
9,005 |
|
358 |
|
3.97 |
|
8,981 |
|
314 |
|
3.49 |
|
8,697 |
|
296 |
|
3.41 |
| ||||||||
|
Lease
financing |
509 |
|
13 |
|
2.64 |
|
684 |
|
18 |
|
2.65 |
|
783 |
|
25 |
|
3.17 |
| ||||||||
|
International
loans |
1,157 |
|
47 |
|
4.07 |
|
1,367 |
|
50 |
|
3.63 |
|
1,441 |
|
51 |
|
3.58 |
| ||||||||
|
Residential
mortgage loans |
1,989 |
|
74 |
|
3.70 |
|
1,894 |
|
71 |
|
3.76 |
|
1,878 |
|
71 |
|
3.77 |
| ||||||||
|
Consumer
loans |
2,525 |
|
94 |
|
3.70 |
|
2,500 |
|
83 |
|
3.32 |
|
2,444 |
|
80 |
|
3.26 |
| ||||||||
|
Total
loans (b) |
48,558 |
|
1,872 |
|
3.86 |
|
48,996 |
|
1,635 |
|
3.34 |
|
48,628 |
|
1,551 |
|
3.20 |
| ||||||||
|
Mortgage-backed
securities |
9,330 |
|
202 |
|
2.17 |
|
9,356 |
|
203 |
|
2.19 |
|
9,113 |
|
202 |
|
2.24 |
| ||||||||
|
Other
investment securities |
2,877 |
|
48 |
|
1.67 |
|
2,992 |
|
44 |
|
1.51 |
|
1,124 |
|
14 |
|
1.25 |
| ||||||||
|
Total
investment securities (c) |
12,207 |
|
250 |
|
2.05 |
|
12,348 |
|
247 |
|
2.02 |
|
10,237 |
|
216 |
|
2.13 |
| ||||||||
|
Interest-bearing
deposits with banks |
5,443 |
|
60 |
|
1.09 |
|
5,099 |
|
26 |
|
0.51 |
|
6,158 |
|
16 |
|
0.26 |
| ||||||||
|
Other
short-term investments |
92 |
|
— |
|
0.64 |
|
102 |
|
1 |
|
0.61 |
|
106 |
|
1 |
|
0.81 |
| ||||||||
|
Total
earning assets |
66,300 |
|
2,182 |
|
3.30 |
|
66,545 |
|
1,909 |
|
2.88 |
|
65,129 |
|
1,784 |
|
2.75 |
| ||||||||
|
Cash
and due from banks |
1,209 |
|
1,146 |
|
1,059 |
|
||||||||||||||||||||
|
Allowance
for loan losses |
(728 |
) |
(730 |
) |
(621 |
) |
||||||||||||||||||||
|
Accrued
income and other assets |
4,671 |
|
4,782 |
|
4,680 |
|
||||||||||||||||||||
|
Total
assets |
$ |
71,452 |
|
$ |
71,743 |
|
$ |
70,247 |
|
|||||||||||||||||
|
Money
market and interest-bearing checking deposits |
$ |
21,585 |
|
33 |
|
0.15 |
|
$ |
22,744 |
|
27 |
|
0.11 |
|
$ |
24,073 |
|
26 |
|
0.11 |
| |||||
|
Savings
deposits |
2,133 |
|
— |
|
0.02 |
|
2,013 |
|
— |
|
0.02 |
|
1,841 |
|
— |
|
0.02 |
| ||||||||
|
Customer
certificates of deposit |
2,471 |
|
9 |
|
0.36 |
|
3,200 |
|
13 |
|
0.40 |
|
4,209 |
|
16 |
|
0.37 |
| ||||||||
|
Foreign
office time deposits (d) |
56 |
|
— |
|
0.64 |
|
33 |
|
— |
|
0.35 |
|
116 |
|
1 |
|
1.02 |
| ||||||||
|
Total
interest-bearing deposits |
26,245 |
|
42 |
|
0.16 |
|
27,990 |
|
40 |
|
0.14 |
|
30,239 |
|
43 |
|
0.14 |
| ||||||||
|
Short-term
borrowings |
277 |
|
3 |
|
1.14 |
|
138 |
|
— |
|
0.45 |
|
93 |
|
— |
|
0.05 |
| ||||||||
|
Medium-
and long-term debt (e) |
4,969 |
|
76 |
|
1.51 |
|
4,917 |
|
72 |
|
1.45 |
|
2,905 |
|
52 |
|
1.80 |
| ||||||||
|
Total
interest-bearing sources |
31,491 |
|
121 |
|
0.38 |
|
33,045 |
|
112 |
|
0.34 |
|
33,237 |
|
95 |
|
0.29 |
| ||||||||
|
Noninterest-bearing
deposits |
31,013 |
|
29,751 |
|
28,087 |
|
||||||||||||||||||||
|
Accrued
expenses and other liabilities |
996 |
|
1,273 |
|
1,389 |
|
||||||||||||||||||||
|
Total
shareholders’ equity |
7,952 |
|
7,674 |
|
7,534 |
|
||||||||||||||||||||
|
Total
liabilities and shareholders’ equity |
$ |
71,452 |
|
$ |
71,743 |
|
$ |
70,247 |
|
|||||||||||||||||
|
Net
interest income/rate spread |
$ |
2,061 |
|
2.92 |
|
$ |
1,797 |
|
2.54 |
|
$ |
1,689 |
|
2.46 |
| |||||||||||
|
Impact
of net noninterest-bearing sources of funds |
|
0.20 |
|
0.17 |
|
0.14 |
| |||||||||||||||||||
|
Net interest margin (as a
percentage of average earning assets) (c) |
|
|
3.12 |
% |
|
|
2.71 |
% |
|
|
2.60 |
% | ||||||||||||||
|
(a) |
Average
rate is calculated on a fully taxable equivalent (FTE) basis using a
federal tax rate of 35%. The FTE adjustment to net interest income
included in the rate calculations totaled $4 million in each of the three
years presented. |
|
(b) |
Nonaccrual
loans are included in average balances reported and in the calculation of
average rates. |
|
(c) |
Includes
investment securities available-for-sale and investment securities
held-to-maturity. Average rate is based on average historical cost.
Carrying value was $28
million
below average historical cost in 2017 and
exceeded average historical cost by $143
million
and $100
million
in 2016 and
2015,
respectively. |
|
(d) |
Includes
substantially all deposits by foreign depositors; deposits are primarily
in excess of $100,000. |
|
(e) |
Medium-
and long-term debt average balances included $77
million,
$162
million
and $160
million
in 2017,
2016 and
2015,
respectively, for the gain attributed to the risk hedged with interest
rate swaps. Interest expense on medium-and long-term debt was reduced by
$32
million,
$60
million
and $70
million
in 2017,
2016 and
2015,
respectively, for the net gains on these fair value hedge
relationships. |
|
(in
millions) |
|||||||||||||||||||||||||
|
Years
Ended December 31 |
2017/2016 |
2016/2015 | |||||||||||||||||||||||
|
Increase
(Decrease)
Due to Rate |
Increase
(Decrease)
Due to
Volume (a) |
Net
Increase
(Decrease) |
Increase
(Decrease)
Due to Rate |
Increase
(Decrease)
Due to
Volume (a) |
Net
Increase
(Decrease) | ||||||||||||||||||||
|
Interest
Income: |
|||||||||||||||||||||||||
|
Commercial
loans |
$ |
179 |
|
$ |
(25 |
) |
$ |
154 |
|
$ |
60 |
|
$ |
(14 |
) |
$ |
46 |
|
|||||||
|
Real
estate construction loans |
14 |
|
19 |
|
33 |
|
2 |
|
23 |
|
25 |
|
|||||||||||||
|
Commercial
mortgage loans |
43 |
|
1 |
|
44 |
|
8 |
|
10 |
|
18 |
|
|||||||||||||
|
Lease
financing |
— |
|
(5 |
) |
(5 |
) |
(4 |
) |
(3 |
) |
(7 |
) |
|||||||||||||
|
International
loans |
6 |
|
(9 |
) |
(3 |
) |
1 |
|
(2 |
) |
(1 |
) |
|||||||||||||
|
Residential
mortgage loans |
(1 |
) |
4 |
|
3 |
|
— |
|
— |
|
— |
|
|||||||||||||
|
Consumer
loans |
10 |
|
1 |
|
11 |
|
1 |
|
2 |
|
3 |
|
|||||||||||||
|
Total
loans |
251 |
|
(14 |
) |
237 |
|
68 |
|
16 |
|
84 |
|
|||||||||||||
|
Mortgage-backed
securities |
(1 |
) |
— |
|
(1 |
) |
(4 |
) |
5 |
|
1 |
|
|||||||||||||
|
Other
investment securities |
5 |
|
(1 |
) |
4 |
|
3 |
|
27 |
|
30 |
|
|||||||||||||
|
Total
investment securities (b) |
4 |
|
(1 |
) |
3 |
|
(1 |
) |
32 |
|
31 |
|
|||||||||||||
|
Interest-bearing
deposits with banks |
30 |
|
4 |
|
34 |
|
15 |
|
(5 |
) |
10 |
|
|||||||||||||
|
Other
short-term investments |
— |
|
(1 |
) |
(1 |
) |
— |
|
— |
|
— |
|
|||||||||||||
|
Total
interest income |
285 |
|
(12 |
) |
273 |
|
82 |
|
43 |
|
125 |
|
|||||||||||||
|
Interest
Expense: |
|||||||||||||||||||||||||
|
Money
market and interest-bearing checking deposits |
8 |
|
(2 |
) |
6 |
|
2 |
|
(1 |
) |
1 |
|
|||||||||||||
|
Customer
certificates of deposit |
(1 |
) |
(3 |
) |
(4 |
) |
1 |
|
(4 |
) |
(3 |
) |
|||||||||||||
|
Foreign
office time deposits |
— |
|
— |
|
— |
|
(1 |
) |
— |
|
(1 |
) |
|||||||||||||
|
Total
interest-bearing deposits |
7 |
|
(5 |
) |
2 |
|
2 |
|
(5 |
) |
(3 |
) |
|||||||||||||
|
Short-term
borrowings |
1 |
|
2 |
|
3 |
|
— |
|
— |
|
— |
|
|||||||||||||
|
Medium-
and long-term debt |
23 |
|
(19 |
) |
4 |
|
9 |
|
11 |
|
20 |
|
|||||||||||||
|
Total
interest expense |
31 |
|
(22 |
) |
9 |
|
11 |
|
6 |
|
17 |
|
|||||||||||||
|
Net
interest income |
$ |
254 |
|
$ |
10 |
|
$ |
264 |
|
$ |
71 |
|
$ |
37 |
|
$ |
108 |
|
|||||||
|
(a) |
Rate/volume
variances are allocated to variances due to
volume. |
|
(b) |
Includes
investment securities available-for-sale and investment securities
held-to-maturity. |
|
(in
millions) |
||||||||||||
|
Years
Ended December 31 |
2017 |
2016 |
2015 | |||||||||
|
Card
fees |
$ |
333 |
|
$ |
303 |
|
$ |
276 |
|
|||
|
Service
charges on deposit accounts |
227 |
|
219 |
|
223 |
|
||||||
|
Fiduciary
income |
198 |
|
190 |
|
187 |
|
||||||
|
Commercial
lending fees |
85 |
|
89 |
|
99 |
|
||||||
|
Letter
of credit fees |
45 |
|
50 |
|
53 |
|
||||||
|
Bank-owned
life insurance |
43 |
|
42 |
|
40 |
|
||||||
|
Foreign
exchange income |
45 |
|
42 |
|
40 |
|
||||||
|
Brokerage
fees |
23 |
|
19 |
|
17 |
|
||||||
|
Net
securities losses |
(3 |
) |
(5 |
) |
(2 |
) |
||||||
|
Other
noninterest income (a) |
111 |
|
102 |
|
102 |
|
||||||
|
Total
noninterest income |
$ |
1,107 |
|
$ |
1,051 |
|
$ |
1,035 |
|
|||
|
(a) |
The
table below provides further details on certain categories included in
other noninterest income. |
|
(in
millions) |
|||||||||||||
|
Years
Ended December 31 |
2017 |
2016 |
2015 | ||||||||||
|
Customer
derivative income |
$ |
26 |
|
$ |
27 |
|
$ |
18 |
|
||||
|
Insurance
commissions |
8 |
|
10 |
|
10 |
|
|||||||
|
Investment
banking fees |
9 |
|
7 |
|
12 |
|
|||||||
|
Income
from principal investing and warrants |
6 |
|
7 |
|
6 |
|
|||||||
|
Securities
trading income |
8 |
|
6 |
|
9 |
|
|||||||
|
Deferred
compensation asset returns (a) |
8 |
|
3 |
|
— |
|
|||||||
|
Risk
management hedge ineffectiveness
|
1 |
|
(2 |
) |
1 |
|
|||||||
|
All
other noninterest income |
45 |
|
44 |
|
46 |
|
|||||||
|
Other
noninterest income |
$ |
111 |
|
$ |
102 |
|
$ |
102 |
|
||||
|
(a) |
Compensation
deferred by the Corporation's officers and directors is invested based on
investment selections of the officers and directors. Income earned on
these assets is reported in noninterest income and the offsetting change
in liability is reported in salaries and benefits
expense. |
|
(in
millions) |
||||||||||||
|
Years
Ended December 31 |
2017 |
2016 |
2015 | |||||||||
|
Salaries
and benefits expense |
$ |
912 |
|
$ |
961 |
|
$ |
1,009 |
|
|||
|
Outside
processing fee expense |
366 |
|
336 |
|
318 |
|
||||||
|
Net
occupancy expense |
154 |
|
157 |
|
159 |
|
||||||
|
Equipment
expense |
45 |
|
53 |
|
53 |
|
||||||
|
Restructuring
charges |
45 |
|
93 |
|
— |
|
||||||
|
Software
expense |
126 |
|
119 |
|
99 |
|
||||||
|
FDIC
insurance expense |
51 |
|
54 |
|
37 |
|
||||||
|
Advertising
expense |
28 |
|
21 |
|
24 |
|
||||||
|
Litigation-related
expense |
(2 |
) |
1 |
|
(32 |
) |
||||||
|
Other
noninterest expenses |
135 |
|
135 |
|
160 |
|
||||||
|
Total
noninterest expenses |
$ |
1,860 |
|
$ |
1,930 |
|
$ |
1,827 |
|
|||
|
(dollar
amounts in millions) |
||||||||||||||||||||
|
Years
Ended December 31 |
2017 |
2016 |
2015 | |||||||||||||||||
|
Business
Bank |
$ |
724 |
|
82 |
% |
$ |
638 |
|
88 |
% |
$ |
761 |
|
85 |
% | |||||
|
Retail
Bank |
68 |
|
8 |
|
4 |
|
1 |
|
45 |
|
5 |
| ||||||||
|
Wealth
Management |
88 |
|
10 |
|
74 |
|
11 |
|
84 |
|
10 |
| ||||||||
|
880 |
|
100 |
% |
716 |
|
100 |
% |
890 |
|
100 |
% | |||||||||
|
Finance |
(65 |
) |
(239 |
) |
(369 |
) |
||||||||||||||
|
Other
(a) |
(72 |
) |
— |
|
— |
|
||||||||||||||
|
Total |
$ |
743 |
|
|
$ |
477 |
|
|
$ |
521 |
|
|||||||||
|
(dollar
amounts in millions) |
||||||||||||||||||||
|
Years
Ended December 31 |
2017 |
2016 |
2015 | |||||||||||||||||
|
Michigan |
$ |
264 |
|
30 |
% |
$ |
243 |
|
34 |
% |
$ |
319 |
|
36 |
% | |||||
|
California |
238 |
|
27 |
|
271 |
|
38 |
|
297 |
|
33 |
| ||||||||
|
Texas |
184 |
|
21 |
|
(22 |
) |
(3 |
) |
77 |
|
9 |
| ||||||||
|
Other
Markets |
194 |
|
22 |
|
224 |
|
31 |
|
197 |
|
22 |
| ||||||||
|
880 |
|
100 |
% |
716 |
|
100 |
% |
890 |
|
100 |
% | |||||||||
|
Finance
& Other (a) |
(137 |
) |
(239 |
) |
(369 |
) |
||||||||||||||
|
Total |
$ |
743 |
|
|
$ |
477 |
|
|
$ |
521 |
|
| ||||||||
|
December
31 |
2017 |
2016 |
2015 | |||||
|
Michigan |
194 |
|
209 |
|
214 |
| ||
|
Texas |
122 |
|
127 |
|
133 |
| ||
|
California |
97 |
|
97 |
|
103 |
| ||
|
Other
Markets: |
||||||||
|
Arizona |
17 |
|
17 |
|
19 |
| ||
|
Florida |
7 |
|
7 |
|
7 |
| ||
|
Canada |
1 |
|
1 |
|
1 |
| ||
|
Total
Other Markets |
25 |
|
25 |
|
27 |
| ||
|
Total |
438 |
|
458 |
|
477 |
| ||
(in
millions) |
|||||||||||||||||||
|
December
31 |
2017 |
2016 |
2015 |
2014 |
2013 | ||||||||||||||
|
Investment
securities available-for-sale: |
|||||||||||||||||||
|
U.S.
Treasury and other U.S. government agency securities |
$ |
2,727 |
|
$ |
2,779 |
|
$ |
2,763 |
|
$ |
526 |
|
$ |
45 |
| ||||
|
Residential
mortgage-backed securities (a) |
8,124 |
|
7,872 |
|
7,545 |
|
7,274 |
|
(b) |
8,926 |
| ||||||||
|
State
and municipal securities |
5 |
|
7 |
|
9 |
|
23 |
|
22 |
| |||||||||
|
Corporate
debt securities |
— |
|
— |
|
1 |
|
51 |
|
56 |
| |||||||||
|
Equity
and other non-debt securities |
82 |
|
129 |
|
201 |
|
242 |
|
258 |
| |||||||||
|
Total
investment securities available-for-sale |
10,938 |
|
10,787 |
|
10,519 |
|
8,116 |
|
9,307 |
| |||||||||
|
Investment
securities held to maturity: |
|||||||||||||||||||
|
Residential
mortgage-backed securities (a) |
1,266 |
|
1,582 |
|
1,981 |
|
1,935 |
|
(b) |
— |
| ||||||||
|
Total
investment securities |
$ |
12,204 |
|
$ |
12,369 |
|
$ |
12,500 |
|
$ |
10,051 |
|
$ |
9,307 |
| ||||
|
Commercial
loans |
$ |
31,060 |
|
$ |
30,994 |
|
$ |
31,659 |
|
$ |
31,520 |
|
$ |
28,815 |
| ||||
|
Real
estate construction loans |
2,961 |
|
2,869 |
|
2,001 |
|
1,955 |
|
1,762 |
| |||||||||
|
Commercial
mortgage loans |
9,159 |
|
8,931 |
|
8,977 |
|
8,604 |
|
8,787 |
| |||||||||
|
Lease
financing |
468 |
|
572 |
|
724 |
|
805 |
|
845 |
| |||||||||
|
International
loans: |
|||||||||||||||||||
|
Banks
and other financial institutions |
4 |
|
2 |
|
— |
|
31 |
|
4 |
| |||||||||
|
Commercial
and industrial |
979 |
|
1,256 |
|
1,368 |
|
1,465 |
|
1,323 |
| |||||||||
|
Total
international loans |
983 |
|
1,258 |
|
1,368 |
|
1,496 |
|
1,327 |
| |||||||||
|
Residential
mortgage loans |
1,988 |
|
1,942 |
|
1,870 |
|
1,831 |
|
1,697 |
| |||||||||
|
Consumer
loans: |
|||||||||||||||||||
|
Home
equity |
1,816 |
|
1,800 |
|
1,720 |
|
1,658 |
|
1,517 |
| |||||||||
|
Other
consumer |
738 |
|
722 |
|
765 |
|
724 |
|
720 |
| |||||||||
|
Total
consumer loans |
2,554 |
|
2,522 |
|
2,485 |
|
2,382 |
|
2,237 |
| |||||||||
|
Total
loans |
$ |
49,173 |
|
$ |
49,088 |
|
$ |
49,084 |
|
$ |
48,593 |
|
$ |
45,470 |
| ||||
|
(a) |
Issued
and/or guaranteed by U.S. government agencies or U.S. government-sponsored
enterprises. |
|
(b) |
During
the fourth quarter 2014, the Corporation transferred residential
mortgage-backed securities from available-for-sale to
held-to-maturity. |
|
(dollar
amounts in millions) |
Percent
Change | |||||||||||||
|
Years
Ended December 31 |
2017 |
2016 |
Change |
|||||||||||
|
Average
Loans: |
||||||||||||||
|
Commercial
loans by business line: |
||||||||||||||
|
General
Middle Market |
$ |
9,299 |
|
$ |
9,286 |
|
$ |
13 |
|
— |
% | |||
|
National
Dealer Services |
5,130 |
|
4,728 |
|
402 |
|
9 |
| ||||||
|
Energy |
2,055 |
|
2,736 |
|
(681 |
) |
(25 |
) | ||||||
|
Technology
and Life Sciences |
3,130 |
|
3,061 |
|
69 |
|
2 |
| ||||||
|
Environmental
Services |
899 |
|
844 |
|
55 |
|
7 |
| ||||||
|
Entertainment |
650 |
|
665 |
|
(15 |
) |
(2 |
) | ||||||
|
Total
Middle Market |
21,163 |
|
21,320 |
|
(157 |
) |
(1 |
) | ||||||
|
Corporate
Banking |
3,464 |
|
3,336 |
|
128 |
|
4 |
| ||||||
|
Mortgage
Banker Finance |
1,768 |
|
2,180 |
|
(412 |
) |
(19 |
) | ||||||
|
Commercial
Real Estate |
725 |
|
913 |
|
(188 |
) |
(21 |
) | ||||||
|
Total
Business Bank commercial loans |
27,120 |
|
|
27,749 |
|
(629 |
) |
(2 |
) | |||||
|
Total
Retail Bank commercial loans |
1,865 |
|
1,910 |
|
(45 |
) |
(2 |
) | ||||||
|
Total
Wealth Management commercial loans |
1,430 |
|
1,403 |
|
27 |
|
2 |
| ||||||
|
Total
commercial loans |
30,415 |
|
31,062 |
|
(647 |
) |
(2 |
) | ||||||
|
Real
estate construction loans |
2,958 |
|
2,508 |
|
450 |
|
18 |
| ||||||
|
Commercial
mortgage loans |
9,005 |
|
8,981 |
|
24 |
|
— |
| ||||||
|
Lease
financing |
509 |
|
684 |
|
(175 |
) |
(26 |
) | ||||||
|
International
loans |
1,157 |
|
1,367 |
|
(210 |
) |
(15 |
) | ||||||
|
Residential
mortgage loans |
1,989 |
|
1,894 |
|
95 |
|
5 |
| ||||||
|
Consumer
loans: |
||||||||||||||
|
Home
equity |
1,794 |
|
1,767 |
|
27 |
|
2 |
| ||||||
|
Other
consumer |
731 |
|
733 |
|
(2 |
) |
— |
| ||||||
|
Consumer
loans |
2,525 |
|
2,500 |
|
25 |
|
1 |
| ||||||
|
Total
loans |
$ |
48,558 |
|
$ |
48,996 |
|
$ |
(438 |
) |
(1 |
)% | |||
|
Average
Loans By Geographic Market: |
||||||||||||||
|
Michigan |
$ |
12,677 |
|
$ |
12,457 |
|
$ |
220 |
|
2 |
% | |||
|
California |
18,008 |
|
17,731 |
|
277 |
|
2 |
| ||||||
|
Texas |
9,969 |
|
10,637 |
|
(668 |
) |
(6 |
) | ||||||
|
Other
Markets |
7,904 |
|
8,171 |
|
(267 |
) |
(3 |
) | ||||||
|
Total
loans |
$ |
48,558 |
|
$ |
48,996 |
|
$ |
(438 |
) |
(1 |
)% | |||
|
Maturity
(a) |
Weighted
Average
Maturity | |||||||||||||||||||||
|
(dollar
amounts in millions) |
1
- 5 Years |
5
- 10 Years |
After
10 Years |
Total | ||||||||||||||||||
|
December 31,
2017 |
Amount |
Yield |
Amount |
Yield |
Amount |
Yield |
Amount |
Yield |
Years | |||||||||||||
|
U.S. Treasury and other U.S.
government agency securities |
$ |
2,727 |
|
1.71 |
% |
$ |
— |
|
— |
% |
$ |
— |
|
— |
% |
$ |
2,727 |
|
1.71 |
% |
2.6 |
|
|
Residential
mortgage-backed securities (b) |
212 |
|
2.47 |
|
1,713 |
|
2.54 |
|
7,465 |
|
2.09 |
|
9,390 |
|
2.18 |
|
18.6 |
| ||||
|
State
and municipal securities (c) |
— |
|
— |
|
1 |
|
2.63 |
|
4 |
|
2.63 |
|
5 |
|
2.63 |
|
12.6 |
| ||||
|
Equity
and other non-debt securities: |
||||||||||||||||||||||
|
Auction-rate
preferred securities (d) |
— |
|
— |
|
— |
|
— |
|
44 |
|
2.68 |
|
44 |
|
2.68 |
|
— |
| ||||
|
Money
market and other mutual funds (e) |
— |
|
— |
|
— |
|
— |
|
38 |
|
— |
|
38 |
|
— |
|
— |
| ||||
|
Total
investment securities |
$ |
2,939 |
|
1.76 |
% |
$ |
1,714 |
|
2.54 |
% |
$ |
7,551 |
|
2.09 |
% |
$ |
12,204 |
|
2.07 |
% |
15.0 |
|
|
(dollar
amounts in millions) |
Percent
Change | |||||||||||||
|
Years
Ended December 31 |
2017 |
2016 |
Change |
|||||||||||
|
Noninterest-bearing
deposits |
$ |
31,013 |
|
$ |
29,751 |
|
$ |
1,262 |
|
4 |
% | |||
|
Money
market and interest-bearing checking deposits |
21,585 |
|
22,744 |
|
(1,159 |
) |
(5 |
) | ||||||
|
Savings
deposits |
2,133 |
|
2,013 |
|
120 |
|
6 |
| ||||||
|
Customer
certificates of deposit |
2,471 |
|
3,200 |
|
(729 |
) |
(23 |
) | ||||||
|
Foreign
office time deposits |
56 |
|
33 |
|
23 |
|
69 |
| ||||||
|
Total
deposits |
$ |
57,258 |
|
$ |
57,741 |
|
$ |
(483 |
) |
(1 |
)% | |||
|
Short-term
borrowings |
$ |
277 |
|
$ |
138 |
|
$ |
139 |
|
101 |
% | |||
|
Medium-
and long-term debt |
4,969 |
|
4,917 |
|
52 |
|
1 |
| ||||||
|
Total
borrowed funds |
$ |
5,246 |
|
$ |
5,055 |
|
$ |
191 |
|
4 |
% | |||
|
(in
millions) |
|
||||||
|
Balance
at January 1, 2017 |
$ |
7,796 |
| ||||
|
Net
income |
743 |
| |||||
|
Cash
dividends declared on common stock |
(193 |
) | |||||
|
Purchase
of common stock |
(544 |
) | |||||
|
Other
comprehensive income (loss): |
|||||||
|
Investment
securities available-for-sale |
$ |
(52 |
) |
||||
|
Defined
benefit and other postretirement plans |
71 |
|
|||||
|
Total
other comprehensive income (loss) |
19 |
| |||||
|
Issuance
of common stock under employee stock plans |
102 |
| |||||
|
Share-based
compensation |
39 |
| |||||
|
Cumulative
effect of change in accounting principle
|
1 |
| |||||
|
Balance
at December 31, 2017 |
$ |
7,963 |
| ||||
|
(shares
in thousands) |
Total Number of Shares and
Warrants Purchased as
Part
of Publicly Announced Repurchase Plans or Programs
(a) |
Remaining
Repurchase
Authorization (b) |
Total Number
of
Shares
Purchased
(c) |
Average Price
Paid Per
Share | ||||||||
|
Total
first quarter 2017 |
1,498 |
|
11,756 |
|
1,694 |
|
$ |
69.75 |
| |||
|
Total
second quarter 2017 |
2,011 |
|
9,634 |
|
2,015 |
|
69.09 |
| ||||
|
Total
third quarter 2017 |
1,955 |
|
12,395 |
|
(d) |
1,956 |
|
71.11 |
| |||
|
October
2017 |
797 |
|
11,589 |
|
799 |
|
77.36 |
| ||||
|
November
2017 |
753 |
|
10,836 |
|
753 |
|
79.17 |
| ||||
|
December
2017 |
314 |
|
10,387 |
|
314 |
|
85.05 |
| ||||
|
Total
fourth quarter 2017 |
1,864 |
|
10,387 |
|
1,866 |
|
79.38 |
| ||||
|
Total
2017 |
7,328 |
|
10,387 |
|
7,531 |
|
$ |
72.31 |
| |||
|
(a) |
The
Corporation made no repurchases of warrants under the repurchase program
during the year ended December 31,
2017.
Upon exercise of a warrant, the number of shares with a value equal to the
aggregate exercise price is withheld from an exercising warrant holder as
payment (known as a "net exercise provision"). During the year ended
December 31,
2017,
the Corporation withheld the equivalent of approximately 1,209,000 shares
to cover an aggregate of $35.6
million
in exercise price and issued approximately 1,771,000 shares
to the exercising warrant holders. Shares withheld in connection with the
net exercise provision are not included in the total number of shares or
warrants purchased in the above table. |
|
(b) |
Maximum
number of shares and warrants that may yet be purchased under the publicly
announced plans or programs. |
|
(c) |
Includes
approximately 203,000 shares
(including 2,000 shares
for the quarter ended December 31,
2017)
purchased pursuant to deferred compensation plans and shares purchased
from employees to pay for taxes related to restricted stock vesting under
the terms of an employee share-based compensation plan during the year
ended December 31,
2017.
These transactions are not considered part of the Corporation's repurchase
program. |
|
(d) |
Includes
July 25,
2017
equity
repurchase authorization for up to an additional 5
million
shares. |
|
December 31,
2017 |
December 31,
2016 | |||||||
|
Common
equity tier 1 capital to risk-weighted assets (a) |
4.50 |
% |
4.50 |
% |
||||
|
Tier
1 capital to risk-weighted assets (a) |
6.00 |
|
6.00 |
|
||||
|
Total
capital to risk-weighted assets (a) |
8.00 |
|
8.00 |
|
||||
|
Capital
conservation buffer (a) |
1.25 |
|
0.625 |
|
||||
|
Tier
1 capital to adjusted average assets (leverage ratio) |
4.00 |
|
4.00 |
|
||||
|
(a) |
In
addition to the minimum risk-based capital requirements, the Corporation
is required to maintain a minimum capital conservation buffer in the form
of common equity, in order to avoid restrictions on capital distributions
and discretionary bonuses. The required amount of the capital conservation
buffer, is being phased in and ultimately increasing to 2.5% on January 1,
2019. |
|
December 31,
2017 |
December 31,
2016 | ||||||||||||
|
(dollar
amounts in millions) |
Capital/Assets |
Ratio |
Capital/Assets |
Ratio | |||||||||
|
Common
equity tier 1 and tier 1 risk-based |
$ |
7,773 |
|
11.68 |
% |
$ |
7,540 |
|
11.09 |
% | |||
|
Total
risk-based |
9,211 |
|
13.84 |
|
9,018 |
|
13.27 |
| |||||
|
Leverage |
7,773 |
|
10.89 |
|
7,540 |
|
10.18 |
| |||||
|
Common
equity |
7,963 |
|
11.13 |
|
7,796 |
|
10.68 |
| |||||
|
Tangible
common equity (a) |
7,320 |
|
10.32 |
|
7,151 |
|
9.89 |
| |||||
|
Risk-weighted
assets |
66,575 |
|
67,966 |
|
|||||||||
|
(a) |
See
Supplemental Financial Data section for reconcilements of non-GAAP
financial measures. |
|
(dollar
amounts in millions) |
|||||||||||||||||||
|
Years
Ended December 31 |
2017 |
2016 |
2015 |
2014 |
2013 | ||||||||||||||
|
Balance
at beginning of year |
$ |
730 |
|
$ |
634 |
|
$ |
594 |
|
$ |
598 |
|
$ |
629 |
| ||||
|
Loan
charge-offs: |
|||||||||||||||||||
|
Commercial |
133 |
|
181 |
|
139 |
|
59 |
|
91 |
| |||||||||
|
Real
estate construction |
— |
|
— |
|
— |
|
— |
|
3 |
| |||||||||
|
Commercial
mortgage |
3 |
|
3 |
|
3 |
|
22 |
|
36 |
| |||||||||
|
Lease
financing |
1 |
|
— |
|
1 |
|
— |
|
— |
| |||||||||
|
International |
6 |
|
23 |
|
14 |
|
6 |
|
— |
| |||||||||
|
Residential
mortgage |
— |
|
— |
|
1 |
|
2 |
|
4 |
| |||||||||
|
Consumer |
6 |
|
7 |
|
10 |
|
13 |
|
19 |
| |||||||||
|
Total
loan charge-offs |
149 |
|
214 |
|
168 |
|
102 |
|
153 |
| |||||||||
|
Recoveries: |
|||||||||||||||||||
|
Commercial |
37 |
|
43 |
|
33 |
|
34 |
|
42 |
| |||||||||
|
Real
estate construction |
1 |
|
— |
|
1 |
|
4 |
|
7 |
| |||||||||
|
Commercial
mortgage |
9 |
|
20 |
|
21 |
|
28 |
|
20 |
| |||||||||
|
Lease
financing |
— |
|
— |
|
— |
|
2 |
|
1 |
| |||||||||
|
International |
3 |
|
— |
|
— |
|
— |
|
— |
| |||||||||
|
Residential
mortgage |
1 |
|
1 |
|
2 |
|
4 |
|
4 |
| |||||||||
|
Consumer |
6 |
|
4 |
|
11 |
|
5 |
|
6 |
| |||||||||
|
Total
recoveries |
57 |
|
68 |
|
68 |
|
77 |
|
80 |
| |||||||||
|
Net
loan charge-offs |
92 |
|
146 |
|
100 |
|
25 |
|
73 |
| |||||||||
|
Provision
for loan losses |
73 |
|
241 |
|
142 |
|
22 |
|
42 |
| |||||||||
|
Foreign
currency translation adjustment |
1 |
|
1 |
|
(2 |
) |
(1 |
) |
— |
| |||||||||
|
Balance
at end of year |
$ |
712 |
|
$ |
730 |
|
$ |
634 |
|
$ |
594 |
|
$ |
598 |
| ||||
|
Net loan charge-offs during
the year as a percentage of average loans outstanding during the
year |
0.19 |
% |
0.30 |
% |
0.21 |
% |
0.05 |
% |
0.16 |
% | |||||||||
|
Years
Ended December 31 |
2017 |
2016 |
2015 | |||||
|
Allowance
for loan losses as a percentage of total loans at end of
year |
1.45 |
% |
1.49 |
% |
1.29 |
% | ||
|
Allowance for loan losses
as a percentage of total nonperforming loans at end of
year |
173 |
|
124 |
|
167 |
| ||
|
Allowance for loan losses
as a multiple of total net loan charge-offs for the year |
7.7x |
|
5.0x |
|
6.3x |
| ||
|
2017 |
2016 |
2015 |
2014 |
2013 | |||||||||||||||||||||||||||
(dollar
amounts in millions) |
Allocated
Allowance |
Allowance
Ratio (a) |
% (b) |
Allocated
Allowance |
% (b) |
Allocated
Allowance |
% (b) |
Allocated
Allowance |
% (b) |
Allocated
Allowance |
% (b) | ||||||||||||||||||||
|
December
31 |
|||||||||||||||||||||||||||||||
|
Business
loans |
|||||||||||||||||||||||||||||||
|
Commercial |
$ |
521 |
|
1.68 |
% |
63 |
% |
$ |
547 |
|
63 |
% |
$ |
448 |
|
65 |
% |
$ |
379 |
|
65 |
% |
$ |
340 |
|
63 |
% | ||||
|
Real
estate construction |
19 |
|
0.63 |
|
6 |
|
21 |
|
6 |
|
12 |
|
4 |
|
20 |
|
4 |
|
16 |
|
4 |
| |||||||||
|
Commercial
mortgage |
91 |
|
1.00 |
|
19 |
|
93 |
|
18 |
|
93 |
|
18 |
|
120 |
|
18 |
|
159 |
|
19 |
| |||||||||
|
Lease
financing |
12 |
|
2.53 |
|
1 |
|
5 |
|
1 |
|
3 |
|
1 |
|
2 |
|
1 |
|
4 |
|
2 |
| |||||||||
|
International |
18 |
|
1.78 |
|
2 |
|
16 |
|
3 |
|
23 |
|
3 |
|
13 |
|
3 |
|
12 |
|
3 |
| |||||||||
|
Total
business loans |
661 |
|
1.48 |
|
91 |
|
682 |
|
91 |
|
579 |
|
91 |
|
534 |
|
91 |
|
531 |
|
91 |
| |||||||||
|
Retail
loans |
|||||||||||||||||||||||||||||||
|
Residential
mortgage |
13 |
|
0.63 |
|
4 |
|
11 |
|
4 |
|
14 |
|
4 |
|
14 |
|
4 |
|
17 |
|
4 |
| |||||||||
|
Consumer |
38 |
|
1.49 |
|
5 |
|
37 |
|
5 |
|
41 |
|
5 |
|
46 |
|
5 |
|
50 |
|
5 |
| |||||||||
|
Total
retail loans |
51 |
|
1.12 |
|
9 |
|
48 |
|
9 |
|
55 |
|
9 |
|
60 |
|
9 |
|
67 |
|
9 |
| |||||||||
|
Total
loans |
$ |
712 |
|
1.45 |
% |
100 |
% |
$ |
730 |
|
100 |
% |
$ |
634 |
|
100 |
% |
$ |
594 |
|
100 |
% |
$ |
598 |
|
100 |
% | ||||
|
(a) |
Allocated
allowance as a percentage of related loans
outstanding. |
|
(b) |
Loans
outstanding as a percentage of total
loans. |
|
(dollar
amounts in millions) |
|||||||||||||||||||
|
Years
Ended December 31 |
2017 |
2016 |
2015 |
2014 |
2013 | ||||||||||||||
|
Balance
at beginning of year |
$ |
41 |
|
$ |
45 |
|
$ |
41 |
|
$ |
36 |
|
$ |
32 |
| ||||
|
Charge-offs
on lending-related commitments (a) |
— |
|
(11 |
) |
(1 |
) |
— |
|
— |
| |||||||||
|
Provision for credit losses
on lending-related commitments |
1 |
|
7 |
|
5 |
|
5 |
|
4 |
| |||||||||
|
Balance
at end of year |
$ |
42 |
|
$ |
41 |
|
$ |
45 |
|
$ |
41 |
|
$ |
36 |
| ||||
|
(dollar
amounts in millions) |
|||||||||||||||||||
|
December
31 |
2017 |
2016 |
2015 |
2014 |
2013 | ||||||||||||||
|
Nonaccrual
loans: |
|||||||||||||||||||
|
Business
loans: |
|||||||||||||||||||
|
Commercial |
$ |
309 |
|
$ |
445 |
|
$ |
238 |
|
$ |
109 |
|
$ |
81 |
| ||||
|
Real
estate construction |
— |
|
— |
|
1 |
|
2 |
|
21 |
| |||||||||
|
Commercial
mortgage |
31 |
|
46 |
|
60 |
|
95 |
|
156 |
| |||||||||
|
Lease
financing |
4 |
|
6 |
|
6 |
|
— |
|
— |
| |||||||||
|
International |
6 |
|
14 |
|
8 |
|
— |
|
4 |
| |||||||||
|
Total
nonaccrual business loans |
350 |
|
511 |
|
313 |
|
206 |
|
262 |
| |||||||||
|
Retail
loans: |
|||||||||||||||||||
|
Residential
mortgage |
31 |
|
39 |
|
27 |
|
36 |
|
53 |
| |||||||||
|
Consumer: |
|||||||||||||||||||
|
Home
equity |
21 |
|
28 |
|
27 |
|
30 |
|
31 |
| |||||||||
|
Other
consumer |
— |
|
4 |
|
— |
|
1 |
|
4 |
| |||||||||
|
Total
consumer |
21 |
|
32 |
|
27 |
|
31 |
|
35 |
| |||||||||
|
Total
nonaccrual retail loans |
52 |
|
71 |
|
54 |
|
67 |
|
88 |
| |||||||||
|
Total
nonaccrual loans |
402 |
|
582 |
|
367 |
|
273 |
|
350 |
| |||||||||
|
Reduced-rate
loans |
8 |
|
8 |
|
12 |
|
17 |
|
24 |
| |||||||||
|
Total
nonperforming loans |
410 |
|
590 |
|
379 |
|
290 |
|
374 |
| |||||||||
|
Foreclosed
property |
5 |
|
17 |
|
12 |
|
10 |
|
9 |
| |||||||||
|
Total
nonperforming assets |
$ |
415 |
|
$ |
607 |
|
$ |
391 |
|
$ |
300 |
|
$ |
383 |
| ||||
|
Gross interest income that
would have been recorded had the nonaccrual and reduced-rate loans
performed in accordance with original terms |
$ |
31 |
|
$ |
38 |
|
$ |
27 |
|
$ |
25 |
|
$ |
34 |
| ||||
|
Interest
income recognized |
7 |
|
6 |
|
5 |
|
6 |
|
5 |
| |||||||||
|
Nonperforming
loans as a percentage of total loans |
0.83 |
% |
1.20 |
% |
0.77 |
% |
0.60 |
% |
0.82 |
% | |||||||||
|
Nonperforming assets as a
percentage of total loans and foreclosed property |
0.84 |
|
1.24 |
|
0.80 |
|
0.62 |
|
0.84 |
| |||||||||
|
Loans
past due 90 days or more and still accruing |
$ |
35 |
|
$ |
19 |
|
$ |
17 |
|
$ |
5 |
|
$ |
16 |
| ||||
|
Loans past due 90 days or
more and still accruing as a percentage of total loans |
0.07 |
% |
0.04 |
% |
0.03 |
% |
0.01 |
% |
0.03 |
% | |||||||||
|
(in
millions) |
|||||||
|
December
31 |
2017 |
2016 | |||||
|
Nonperforming
TDRs: |
|||||||
|
Nonaccrual
TDRs |
$ |
182 |
|
$ |
225 |
| |
|
Reduced-rate
TDRs |
8 |
|
8 |
| |||
|
Total
nonperforming TDRs |
190 |
|
233 |
| |||
|
Performing
TDRs (a) |
123 |
|
94 |
| |||
|
Total
TDRs |
$ |
313 |
|
$ |
327 |
| |
|
(a) |
TDRs
that do not include a reduction in the original contractual interest rate
which are performing in accordance with their modified
terms. |
(in
millions) |
|||||||
|
Years
Ended December 31 |
2017 |
2016 | |||||
|
Balance
at beginning of period |
$ |
582 |
|
$ |
367 |
| |
|
Loans
transferred to nonaccrual (a) |
297 |
|
718 |
| |||
|
Nonaccrual
business loan gross charge-offs (b) |
(143 |
) |
(207 |
) | |||
|
Nonaccrual
business loans sold |
(40 |
) |
(73 |
) | |||
|
Payments/other
(c) |
(294 |
) |
(223 |
) | |||
|
Balance
at end of period |
$ |
402 |
|
$ |
582 |
| |
|
(a) Based on an analysis of
nonaccrual loans with book balances greater than $2
million. | |||||||
(b)
Analysis of gross loan charge-offs: |
|||||||
|
Business
loans |
$ |
143 |
|
$ |
207 |
| |
|
Retail
loans |
6 |
|
7 |
| |||
|
Total
gross loan charge-offs |
$ |
149 |
|
$ |
214 |
| |
|
(c) Includes net changes
related to nonaccrual loans with balances less than $2 million, payments
on nonaccrual loans with book balances greater than $2 million, transfers
of nonaccrual loans to foreclosed property and retail loan gross
charge-offs. Excludes business loan gross charge-offs and nonaccrual
business loans sold. | |||||||
|
2017 |
2016 | ||||||||||||
|
(dollar
amounts in millions) |
Number
of
Borrowers |
Balance |
Number
of
Borrowers |
Balance | |||||||||
|
Under
$2 million |
939 |
|
$ |
85 |
|
1,152 |
|
$ |
95 |
| |||
|
$2
million - $5 million |
16 |
|
47 |
|
18 |
|
57 |
| |||||
|
$5
million - $10 million |
12 |
|
93 |
|
9 |
|
60 |
| |||||
|
$10
million - $25 million |
8 |
|
130 |
|
14 |
|
234 |
| |||||
|
Greater
than $25 million |
1 |
|
47 |
|
4 |
|
136 |
| |||||
|
Total
|
976 |
|
$ |
402 |
|
1,197 |
|
$ |
582 |
| |||
|
December 31,
2017 |
Year
Ended December 31, 2017 | |||||||||||||||||||
|
(dollar
amounts in millions) |
Nonaccrual Loans |
Loans Transferred to
Nonaccrual (a) |
Net Loan Charge-Offs
(Recoveries) | |||||||||||||||||
|
Industry
Category |
||||||||||||||||||||
|
Mining,
Quarrying and Oil & Gas Extraction (b) |
$ |
113 |
|
29 |
% |
$ |
66 |
|
22 |
% |
$ |
38 |
|
42 |
% | |||||
|
Manufacturing |
94 |
|
24 |
|
89 |
|
30 |
|
10 |
|
11 |
| ||||||||
|
Health
Care and Social Assistance |
38 |
|
9 |
|
25 |
|
9 |
|
5 |
|
5 |
| ||||||||
|
Residential
Mortgage |
31 |
|
8 |
|
12 |
|
4 |
|
(1 |
) |
(1 |
) | ||||||||
|
Services
(b) |
25 |
|
6 |
|
13 |
|
4 |
|
8 |
|
9 |
| ||||||||
|
Wholesale
Trade |
20 |
|
5 |
|
34 |
|
12 |
|
10 |
|
11 |
| ||||||||
|
Real
Estate and Home Builders |
18 |
|
4 |
|
5 |
|
2 |
|
3 |
|
3 |
| ||||||||
|
Contractors
|
16 |
|
4 |
|
22 |
|
7 |
|
7 |
|
7 |
| ||||||||
|
Information
and Communication |
6 |
|
1 |
|
8 |
|
3 |
|
8 |
|
9 |
| ||||||||
|
Entertainment |
4 |
|
1 |
|
10 |
|
3 |
|
— |
|
— |
| ||||||||
|
Transportation
and Warehousing |
— |
|
— |
|
6 |
|
2 |
|
(9 |
) |
(10 |
) | ||||||||
|
Other
(c) |
37 |
|
9 |
|
7 |
|
2 |
|
13 |
|
14 |
| ||||||||
|
Total |
$ |
402 |
|
100 |
% |
$ |
297 |
|
100 |
% |
$ |
92 |
|
100 |
% | |||||
|
(a) |
Based on
an analysis of nonaccrual loans with book balances greater than $2
million. |
|
(b) |
Included
nonaccrual Energy and energy-related loans of approximately $112 million
in Mining, Quarrying and Oil & Gas Extraction and $8 million in
Services at December 31,
2017. |
|
(c) |
Consumer,
excluding residential mortgage and certain personal purpose nonaccrual
loans and net charge-offs, is included in the “Other”
category. |
|
(dollar
amounts in millions) |
||||||||
|
December
31 |
2017 |
2016 | ||||||
|
Total
criticized loans |
$ |
2,231 |
|
$ |
2,856 |
| ||
|
As
a percentage of total loans |
4.5 |
% |
5.8 |
% | ||||
|
(in
millions) |
||||||||
|
Years
Ended December 31 |
2017 |
2016 | ||||||
|
Balance
at beginning of period |
$ |
17 |
|
$ |
12 |
| ||
|
Acquired
in foreclosure |
8 |
|
21 |
| ||||
|
Write-downs |
(1 |
) |
— |
| ||||
|
Foreclosed
property sold (a) |
(19 |
) |
(16 |
) | ||||
|
Balance
at end of period |
$ |
5 |
|
$ |
17 |
| ||
|
(a)
Net gain on foreclosed property sold |
$ |
3 |
|
$ |
4 |
| ||
|
2017 |
2016 | ||||||||||||
|
(in
millions) |
Loans
Outstanding |
Percent of
Total Loans |
Loans
Outstanding |
Percent of
Total Loans | |||||||||
|
December
31 |
|||||||||||||
|
Production: |
|||||||||||||
|
Domestic |
$ |
1,007 |
|
$ |
968 |
|
|||||||
|
Foreign |
337 |
|
358 |
|
|||||||||
|
Total
production |
1,344 |
|
2.7 |
% |
1,326 |
|
2.7 |
% | |||||
|
Dealer: |
|||||||||||||
|
Floor
plan |
4,359 |
|
4,269 |
|
|||||||||
|
Other |
3,233 |
|
2,854 |
|
|||||||||
|
Total
dealer |
7,592 |
|
15.5 |
% |
7,123 |
|
14.5 |
% | |||||
|
Total
automotive |
$ |
8,936 |
|
18.2 |
% |
$ |
8,449 |
|
17.2 |
% | |||
|
(in
millions) |
|||||||
|
December
31 |
2017 |
2016 | |||||
|
Real
estate construction loans: |
|||||||
|
Commercial
Real Estate business line (a) |
$ |
2,630 |
|
$ |
2,485 |
| |
|
Other
business lines (b) |
331 |
|
384 |
| |||
|
Total
real estate construction loans |
$ |
2,961 |
|
$ |
2,869 |
| |
|
Commercial
mortgage loans: |
|||||||
|
Commercial
Real Estate business line (a) |
$ |
1,831 |
|
$ |
2,018 |
| |
|
Other
business lines (b) |
7,328 |
|
6,913 |
| |||
|
Total
commercial mortgage loans |
$ |
9,159 |
|
$ |
8,931 |
| |
|
(a) |
Primarily
loans to real estate developers. |
|
(b) |
Primarily
loans secured by owner-occupied real
estate. |
|
|
2017 |
2016 | |||||||||||||||||||||||||
|
(dollar
amounts in millions) December
31 |
Residential Mortgage Loans |
%
of Total |
Home Equity Loans |
%
of Total |
Residential Mortgage Loans |
%
of Total |
Home Equity Loans |
%
of Total | |||||||||||||||||||
|
Geographic
market: |
|||||||||||||||||||||||||||
|
Michigan |
$ |
387 |
|
19 |
% |
$ |
705 |
|
39 |
% |
$ |
386 |
|
20 |
% |
$ |
748 |
|
42 |
% | |||||||
|
California |
1,023 |
|
52 |
|
718 |
|
40 |
|
948 |
|
49 |
|
687 |
|
38 |
| |||||||||||
|
Texas |
297 |
|
15 |
|
335 |
|
18 |
|
337 |
|
17 |
|
305 |
|
17 |
| |||||||||||
|
Other
Markets |
281 |
|
14 |
|
58 |
|
3 |
|
271 |
|
14 |
|
60 |
|
3 |
| |||||||||||
|
Total |
$ |
1,988 |
|
100 |
% |
$ |
1,816 |
|
100 |
% |
$ |
1,942 |
|
100 |
% |
$ |
1,800 |
|
100 |
% | |||||||
|
(dollar
amounts in millions) |
2017 |
2016 | |||||||||||||||||||||
|
December
31 |
Outstandings |
Nonaccrual |
Criticized |
Outstandings |
Nonaccrual |
Criticized | |||||||||||||||||
|
Exploration
and production (E&P) |
$ |
1,346 |
|
73 |
% |
$ |
94 |
|
$ |
376 |
|
$ |
1,587 |
|
70 |
% |
$ |
294 |
|
$ |
910 |
| |
|
Midstream |
295 |
|
16 |
|
— |
|
37 |
|
374 |
|
17 |
|
7 |
|
45 |
| |||||||
|
Services |
195 |
|
11 |
|
14 |
|
95 |
|
289 |
|
13 |
|
27 |
|
200 |
| |||||||
|
Total
Energy business line |
1,836 |
|
100 |
% |
108 |
|
508 |
|
2,250 |
|
100 |
% |
328 |
|
1,155 |
| |||||||
|
Energy-related |
298 |
|
12 |
|
55 |
|
397 |
|
45 |
|
171 |
| |||||||||||
|
Total
energy and energy-related |
$ |
2,134 |
|
$ |
120 |
|
$ |
563 |
|
$ |
2,647 |
|
$ |
373 |
|
$ |
1,326 |
| |||||
|
As
a percentage of total Energy and energy-related loans |
6 |
% |
26 |
% |
14 |
% |
50 |
% | |||||||||||||||
|
Estimated
Annual Change | |||||||||||||
|
(in
millions) |
2017 |
2016 | |||||||||||
|
December
31 |
Amount |
% |
Amount |
% | |||||||||
|
Change
in Interest Rates: |
|||||||||||||
|
Rising
200 basis points |
$ |
197 |
|
9 |
% |
$ |
212 |
|
11 |
% | |||
|
Declining
to zero percent |
(283 |
) |
(13 |
) |
(138 |
) |
(7 |
) | |||||
|
2017 |
2016 | ||||||||||||
|
(in
millions) |
Amount |
% |
Amount |
% | |||||||||
|
Change
in Interest Rates: |
|||||||||||||
|
Rising
200 basis points |
$ |
1,188 |
|
9 |
% |
$ |
1,133 |
|
10 |
% | |||
|
Falling
to zero percent |
(2,635 |
) |
(20 |
) |
(891 |
) |
(7 |
) | |||||
|
Loans
Maturing | |||||||||||||||
|
(in
millions)
December
31, 2017 |
Within One
Year
(a) |
After One
But Within
Five
Years |
After
Five Years |
Total | |||||||||||
|
Commercial
loans |
$ |
15,221 |
|
$ |
14,739 |
|
$ |
1,100 |
|
$ |
31,060 |
| |||
|
Real
estate construction loans |
1,270 |
|
1,595 |
|
96 |
|
2,961 |
| |||||||
|
Commercial
mortgage loans |
1,563 |
|
5,065 |
|
2,531 |
|
9,159 |
| |||||||
|
International
loans |
452 |
|
524 |
|
7 |
|
983 |
| |||||||
|
Total |
$ |
18,506 |
|
$ |
21,923 |
|
$ |
3,734 |
|
$ |
44,163 |
| |||
|
Sensitivity
of loans to changes in interest rates: |
|||||||||||||||
|
Predetermined
(fixed) interest rates |
$ |
699 |
|
$ |
2,550 |
|
$ |
633 |
|
$ |
3,882 |
| |||
|
Floating
interest rates |
17,807 |
|
19,373 |
|
3,101 |
|
40,281 |
| |||||||
|
Total |
$ |
18,506 |
|
$ |
21,923 |
|
$ |
3,734 |
|
$ |
44,163 |
| |||
|
(a) |
Includes
demand loans, loans having no stated repayment schedule or maturity and
overdrafts. |
|
(in
millions)
Risk
Management Notional Activity |
Interest
Rate
Contracts |
Foreign
Exchange
Contracts |
Totals | ||||||||
|
Balance
at January 1, 2016 |
$ |
2,525 |
|
$ |
593 |
|
$ |
3,118 |
| ||
|
Additions |
— |
|
13,946 |
|
13,946 |
| |||||
|
Maturities/amortizations |
(250 |
) |
(13,822 |
) |
(14,072 |
) | |||||
|
Balance
at December 31, 2016 |
$ |
2,275 |
|
$ |
717 |
|
$ |
2,992 |
| ||
|
Additions |
— |
|
12,004 |
|
12,004 |
| |||||
|
Maturities/amortizations |
(500 |
) |
(12,071 |
) |
(12,571 |
) | |||||
|
Balance
at December 31, 2017 |
$ |
1,775 |
|
$ |
650 |
|
$ |
2,425 |
| ||
|
(in
millions)
Customer-Initiated
and Other Notional Activity |
Interest
Rate
Contracts |
Energy
Derivative
Contracts |
Foreign
Exchange
Contracts |
Totals | |||||||||||
|
Balance
at January 1, 2016 |
$ |
12,228 |
|
$ |
3,127 |
|
$ |
2,291 |
|
$ |
17,646 |
| |||
|
Additions |
3,505 |
|
1,347 |
|
54,478 |
|
59,330 |
| |||||||
|
Maturities/amortizations |
(1,469 |
) |
(1,908 |
) |
(55,250 |
) |
(58,627 |
) | |||||||
|
Terminations |
(941 |
) |
(339 |
) |
(10 |
) |
(1,290 |
) | |||||||
|
Balance
at December 31, 2016 |
$ |
13,323 |
|
$ |
2,227 |
|
$ |
1,509 |
|
$ |
17,059 |
| |||
|
Additions |
4,377 |
|
1,539 |
|
47,456 |
|
53,372 |
| |||||||
|
Maturities/amortizations |
(2,096 |
) |
(1,681 |
) |
(46,987 |
) |
(50,764 |
) | |||||||
|
Terminations |
(1,215 |
) |
(238 |
) |
(94 |
) |
(1,547 |
) | |||||||
|
Balance
at December 31, 2017 |
$ |
14,389 |
|
$ |
1,847 |
|
$ |
1,884 |
|
$ |
18,120 |
| |||
|
Minimum
Payments Due by Period | |||||||||||||||||||
|
(in
millions)
December
31, 2017 |
Total |
Less
than
1
Year |
1-3
Years |
3-5
Years |
More than
5
Years | ||||||||||||||
|
Deposits
without a stated maturity (a) |
$ |
55,723 |
|
$ |
55,723 |
|
$ |
— |
|
$ |
— |
|
$ |
— |
| ||||
|
Certificates of deposit and
other deposits with a stated maturity (a) |
2,180 |
|
1,855 |
|
266 |
|
44 |
|
15 |
| |||||||||
|
Short-term
borrowings (a) |
10 |
|
10 |
|
— |
|
— |
|
— |
| |||||||||
|
Medium-
and long-term debt (a) |
4,575 |
|
— |
|
1,025 |
|
— |
|
3,550 |
| |||||||||
|
Operating
leases |
391 |
|
68 |
|
113 |
|
75 |
|
135 |
| |||||||||
|
Commitments
to fund low income housing partnerships |
159 |
|
92 |
|
57 |
|
4 |
|
6 |
| |||||||||
|
Other
long-term obligations (b) |
350 |
|
87 |
|
76 |
|
37 |
|
150 |
| |||||||||
|
Total
contractual obligations |
$ |
63,388 |
|
$ |
57,835 |
|
$ |
1,537 |
|
$ |
160 |
|
$ |
3,856 |
| ||||
|
Medium- and long-term debt (parent company only)
(a) (c) |
$ |
600 |
|
$ |
— |
|
$ |
350 |
|
$ |
— |
|
$ |
250 |
| ||||
|
(a) |
Deposits
and borrowings exclude accrued interest. |
|
(b) |
Includes
unrecognized tax benefits. |
|
(c) |
Parent
company only amounts are included in the medium- and long-term debt
minimum payments above. |
|
Expected
Expiration Dates by Period | |||||||||||||||||||
|
(in
millions)
December
31, 2017 |
Total |
Less than
1
Year |
1-3
Years |
3-5
Years |
More than
5
Years | ||||||||||||||
|
Unused
commitments to extend credit |
$ |
25,469 |
|
$ |
7,022 |
|
$ |
9,711 |
|
$ |
5,978 |
|
$ |
2,758 |
| ||||
|
Standby
letters of credit and financial guarantees |
3,228 |
|
2,741 |
|
293 |
|
187 |
|
7 |
| |||||||||
|
Commercial
letters of credit |
39 |
|
39 |
|
— |
|
— |
|
— |
| |||||||||
|
Total
commercial commitments |
$ |
28,736 |
|
$ |
9,802 |
|
$ |
10,004 |
|
$ |
6,165 |
|
$ |
2,765 |
| ||||
|
Comerica Incorporated |
Comerica Bank | ||||||
|
December 31,
2017 |
Rating |
Outlook |
Rating |
Outlook | |||
|
Standard
and Poor’s |
BBB+ |
Stable |
A- |
Stable |
|||
|
Moody’s
Investors Service |
A3 |
Stable |
A3 |
Stable |
|||
|
Fitch
Ratings |
A |
Stable |
A |
Stable |
|||
|
Discount
rate |
3.74 |
% |
|
Long-term
rate of return on plan assets |
6.50 |
% |
|
Lump
sum payment election rate: |
||
|
Participants
before January 1, 2017 |
50 |
% |
|
All
other participants |
80 |
% |
|
Mortality
table: |
||
|
Base
table (a) |
RP-2017 |
|
|
Mortality
improvement scale (a) |
MP-2017 |
|
|
(a) |
Issued
by the Society of Actuaries in October
2017. |
|
(dollar
amounts in millions) |
|||||||||||||||||||
|
December
31 |
2017 |
2016 |
2015 |
2014 |
2013 | ||||||||||||||
|
Tangible
Common Equity Ratio: |
|||||||||||||||||||
|
Common
shareholders' equity |
$ |
7,963 |
|
$ |
7,796 |
|
$ |
7,560 |
|
$ |
7,402 |
|
$ |
7,150 |
| ||||
|
Less: |
|||||||||||||||||||
|
Goodwill |
635 |
|
635 |
|
635 |
|
635 |
|
635 |
| |||||||||
|
Other
intangible assets |
8 |
|
10 |
|
14 |
|
15 |
|
17 |
| |||||||||
|
Tangible
common equity |
$ |
7,320 |
|
$ |
7,151 |
|
$ |
6,911 |
|
$ |
6,752 |
|
$ |
6,498 |
| ||||
|
Total
assets |
$ |
71,567 |
|
$ |
72,978 |
|
$ |
71,877 |
|
$ |
69,186 |
|
$ |
65,224 |
| ||||
|
Less: |
|||||||||||||||||||
|
Goodwill |
635 |
|
635 |
|
635 |
|
635 |
|
635 |
| |||||||||
|
Other
intangible assets |
8 |
|
10 |
|
14 |
|
15 |
|
17 |
| |||||||||
|
Tangible
assets |
$ |
70,924 |
|
$ |
72,333 |
|
$ |
71,228 |
|
$ |
68,536 |
|
$ |
64,572 |
| ||||
|
Common
equity ratio |
11.13 |
% |
10.68 |
% |
10.52 |
% |
10.70 |
% |
10.97 |
% | |||||||||
|
Tangible
common equity ratio |
10.32 |
|
9.89 |
|
9.70 |
|
9.85 |
|
10.07 |
| |||||||||
|
Tangible
Common Equity per Share of Common Stock: |
|||||||||||||||||||
|
Common
shareholders' equity |
$ |
7,963 |
|
$ |
7,796 |
|
$ |
7,560 |
|
$ |
7,402 |
|
$ |
7,150 |
| ||||
|
Tangible
common equity |
7,320 |
|
7,151 |
|
6,911 |
|
6,752 |
|
6,498 |
| |||||||||
|
Shares
of common stock outstanding (in millions) |
173 |
|
175 |
|
176 |
|
179 |
|
182 |
| |||||||||
|
Common
shareholders' equity per share of common stock |
$ |
46.07 |
|
$ |
44.47 |
|
$ |
43.03 |
|
$ |
41.35 |
|
$ |
39.22 |
| ||||
|
Tangible
common equity per share of common stock |
42.34 |
|
40.79 |
|
39.33 |
|
37.72 |
|
35.64 |
| |||||||||
|
• |
general political, economic
or industry conditions, either domestically or internationally, may be
less favorable than expected; |
|
• |
governmental monetary and
fiscal policies may adversely affect the financial services industry, and
therefore impact the Corporation's financial condition and results of
operations; |
|
• |
proposed revenue
enhancements and efficiency improvements under the GEAR Up initiative may
not be achieved; |
|
• |
adverse effects from
operational difficulties, failure of technology infrastructure or
information security incidents; |
|
• |
the Corporation relies on
other companies to provide certain key components of its delivery systems,
and certain failures could materially adversely affect
operations; |
|
• |
the Corporation must
maintain adequate sources of funding and liquidity to meet regulatory
expectations, support its operations and fund outstanding
liabilities; |
|
• |
compliance with more
stringent capital and liquidity requirements may adversely affect the
Corporation; |
|
• |
declines in the businesses
or industries of the Corporation's customers could cause increased credit
losses or decreased loan balances, which could adversely affect the
Corporation; |
|
• |
unfavorable developments
concerning credit quality could adversely affect the Corporation's
financial results: |
|
• |
changes in regulation or
oversight may have a material adverse impact on the Corporation's
operations; |
|
• |
changes in the financial
markets, including fluctuations in interest rates and their impact on
deposit pricing, could adversely affect the Corporation's net interest
income and balance sheet; |
|
• |
adverse effects due to
regulatory developments impacting LIBOR and other interest rate
benchmarks; |
|
• |
reduction in the
Corporation's credit ratings could adversely affect the Corporation and/or
the holders of its securities; |
|
• |
damage to the Corporation’s
reputation could damage its businesses; |
|
• |
the Corporation's inability
to utilize technology to develop, market and deliver new products and
services to its customers; |
|
• |
competitive product and
pricing pressures among financial institutions within the Corporation's
markets may change; |
|
• |
the soundness of other
financial institutions could adversely affect the
Corporation; |
|
• |
the introduction,
implementation, withdrawal, success and timing of business initiatives and
strategies may be less successful or may be different than anticipated,
which could adversely affect the Corporation's
business; |
|
• |
changes in customer
behavior may adversely impact the Corporation's business, financial
condition and results of operations; |
|
• |
management's ability to
maintain and expand customer relationships may differ from
expectations; |
|
• |
methods of reducing risk
exposures might not be effective; |
|
• |
catastrophic events,
including, but not limited to, hurricanes, tornadoes, earthquakes, fires,
droughts and floods, may adversely affect the general economy, financial
and capital markets, specific industries, and the
Corporation; |
|
• |
the unknown impacts of
recent tax reform, and potential legislative, administrative or judicial
changes or interpretations to these and other tax
regulations; |
|
• |
any future strategic
acquisitions or divestitures may present certain risks to the
Corporation's business and operations; |
|
• |
management's ability to
retain key officers and employees may
change; |
|
• |
legal and regulatory
proceedings and related financial services industry matters, including
those directly involving the Corporation and its subsidiaries, could
adversely affect the Corporation or the financial services industry in
general; |
|
• |
adverse effects from
terrorist activities or other hostilities;
|
|
• |
changes in accounting
standards could materially impact the Corporation's financial statements;
|
|
• |
the Corporation's
accounting policies and processes are critical to the reporting of
financial condition and results of operations and require management to
make estimates about matters that are uncertain;
and |
|
• |
the Corporation's stock
price can be volatile. |
|
(in
millions, except share data) |
|||||||
|
December
31 |
2017 |
2016 | |||||
|
ASSETS |
|||||||
|
Cash
and due from banks |
$ |
1,438 |
|
$ |
1,249 |
| |
|
Interest-bearing
deposits with banks |
4,407 |
|
5,969 |
| |||
|
Other
short-term investments |
96 |
|
92 |
| |||
|
Investment
securities available-for-sale |
10,938 |
|
10,787 |
| |||
|
Investment
securities held-to-maturity |
1,266 |
|
1,582 |
| |||
|
Commercial
loans |
31,060 |
|
30,994 |
| |||
|
Real
estate construction loans |
2,961 |
|
2,869 |
| |||
|
Commercial
mortgage loans |
9,159 |
|
8,931 |
| |||
|
Lease
financing |
468 |
|
572 |
| |||
|
International
loans |
983 |
|
1,258 |
| |||
|
Residential
mortgage loans |
1,988 |
|
1,942 |
| |||
|
Consumer
loans |
2,554 |
|
2,522 |
| |||
|
Total
loans |
49,173 |
|
49,088 |
| |||
|
Less
allowance for loan losses |
(712 |
) |
(730 |
) | |||
|
Net
loans |
48,461 |
|
48,358 |
| |||
|
Premises
and equipment |
466 |
|
501 |
| |||
|
Accrued
income and other assets |
4,495 |
|
4,440 |
| |||
|
Total
assets |
$ |
71,567 |
|
$ |
72,978 |
| |
|
LIABILITIES
AND SHAREHOLDERS’ EQUITY |
|||||||
|
Noninterest-bearing
deposits |
$ |
32,071 |
|
$ |
31,540 |
| |
|
Money
market and interest-bearing checking deposits |
21,500 |
|
22,556 |
| |||
|
Savings
deposits |
2,152 |
|
2,064 |
| |||
|
Customer
certificates of deposit |
2,165 |
|
2,806 |
| |||
|
Foreign
office time deposits |
15 |
|
19 |
| |||
|
Total
interest-bearing deposits |
25,832 |
|
27,445 |
| |||
|
Total
deposits |
57,903 |
|
58,985 |
| |||
|
Short-term
borrowings |
10 |
|
25 |
| |||
|
Accrued
expenses and other liabilities |
1,069 |
|
1,012 |
| |||
|
Medium-
and long-term debt |
4,622 |
|
5,160 |
| |||
|
Total
liabilities |
63,604 |
|
65,182 |
| |||
|
Common
stock - $5 par value: |
|||||||
|
Authorized
- 325,000,000 shares |
|||||||
|
Issued - 228,164,824
shares |
1,141 |
|
1,141 |
| |||
|
Capital
surplus |
2,122 |
|
2,135 |
| |||
|
Accumulated
other comprehensive loss |
(451 |
) |
(383 |
) | |||
|
Retained
earnings |
7,887 |
|
7,331 |
| |||
|
Less cost of common stock in
treasury - 55,306,483 shares at 12/31/17 and 52,851,156 shares at
12/31/16 |
(2,736 |
) |
(2,428 |
) | |||
|
Total
shareholders’ equity |
7,963 |
|
7,796 |
| |||
|
Total
liabilities and shareholders’ equity |
$ |
71,567 |
|
$ |
72,978 |
| |
|
(in
millions) |
|||||||||||
|
Years
Ended December 31 |
2017 |
2016 |
2015 | ||||||||
|
INTEREST
INCOME |
|||||||||||
|
Interest
and fees on loans |
$ |
1,872 |
|
$ |
1,635 |
|
$ |
1,551 |
| ||
|
Interest
on investment securities |
250 |
|
247 |
|
216 |
| |||||
|
Interest
on short-term investments |
60 |
|
27 |
|
17 |
| |||||
|
Total
interest income |
2,182 |
|
1,909 |
|
1,784 |
| |||||
|
INTEREST
EXPENSE |
|||||||||||
|
Interest
on deposits |
42 |
|
40 |
|
43 |
| |||||
|
Interest
on short-term borrowings
|
3 |
|
— |
|
— |
| |||||
|
Interest
on medium- and long-term debt |
76 |
|
72 |
|
52 |
| |||||
|
Total
interest expense |
121 |
|
112 |
|
95 |
| |||||
|
Net
interest income |
2,061 |
|
1,797 |
|
1,689 |
| |||||
|
Provision
for credit losses |
74 |
|
248 |
|
147 |
| |||||
|
Net
interest income after provision for credit losses |
1,987 |
|
1,549 |
|
1,542 |
| |||||
|
NONINTEREST
INCOME |
|||||||||||
|
Card
fees |
333 |
|
303 |
|
276 |
| |||||
|
Service
charges on deposit accounts |
227 |
|
219 |
|
223 |
| |||||
|
Fiduciary
income |
198 |
|
190 |
|
187 |
| |||||
|
Commercial
lending fees |
85 |
|
89 |
|
99 |
| |||||
|
Letter
of credit fees |
45 |
|
50 |
|
53 |
| |||||
|
Bank-owned
life insurance |
43 |
|
42 |
|
40 |
| |||||
|
Foreign
exchange income |
45 |
|
42 |
|
40 |
| |||||
|
Brokerage
fees |
23 |
|
19 |
|
17 |
| |||||
|
Net
securities losses |
(3 |
) |
(5 |
) |
(2 |
) | |||||
|
Other
noninterest income |
111 |
|
102 |
|
102 |
| |||||
|
Total
noninterest income |
1,107 |
|
1,051 |
|
1,035 |
| |||||
|
NONINTEREST
EXPENSES |
|||||||||||
|
Salaries
and benefits expense |
912 |
|
961 |
|
1,009 |
| |||||
|
Outside
processing fee expense |
366 |
|
336 |
|
318 |
| |||||
|
Net
occupancy expense |
154 |
|
157 |
|
159 |
| |||||
|
Equipment
expense |
45 |
|
53 |
|
53 |
| |||||
|
Restructuring
charges |
45 |
|
93 |
|
— |
| |||||
|
Software
expense |
126 |
|
119 |
|
99 |
| |||||
|
FDIC
insurance expense |
51 |
|
54 |
|
37 |
| |||||
|
Advertising
expense |
28 |
|
21 |
|
24 |
| |||||
|
Litigation-related
expense |
(2 |
) |
1 |
|
(32 |
) | |||||
|
Other
noninterest expenses |
135 |
|
135 |
|
160 |
| |||||
|
Total
noninterest expenses |
1,860 |
|
1,930 |
|
1,827 |
| |||||
|
Income
before income taxes |
1,234 |
|
670 |
|
750 |
| |||||
|
Provision
for income taxes |
491 |
|
193 |
|
229 |
| |||||
|
NET
INCOME |
743 |
|
477 |
|
521 |
| |||||
|
Less
income allocated to participating securities |
5 |
|
4 |
|
6 |
| |||||
|
Net
income attributable to common shares |
$ |
738 |
|
$ |
473 |
|
$ |
515 |
| ||
|
Earnings
per common share: |
|||||||||||
|
Basic |
$ |
4.23 |
|
$ |
2.74 |
|
$ |
2.93 |
| ||
|
Diluted |
4.14 |
|
2.68 |
|
2.84 |
| |||||
|
Cash
dividends declared on common stock |
193 |
|
154 |
|
148 |
| |||||
|
Cash
dividends declared per common share |
1.09 |
|
0.89 |
|
0.83 |
| |||||
|
(in
millions) |
|||||||||||
|
Years
Ended December 31 |
2017 |
2016 |
2015 | ||||||||
|
NET
INCOME |
$ |
743 |
|
$ |
477 |
|
$ |
521 |
| ||
|
OTHER
COMPREHENSIVE INCOME (LOSS) |
|||||||||||
|
Unrealized
losses on investment securities: |
|||||||||||
|
Net
unrealized holding losses arising during the period |
(81 |
) |
(70 |
) |
(55 |
) | |||||
|
Less: |
|||||||||||
|
Reclassification adjustment
for net securities losses included in net income |
— |
|
— |
|
(2 |
) | |||||
|
Net
losses realized as a yield adjustment in interest on investment
securities |
(3 |
) |
(3 |
) |
(8 |
) | |||||
|
Change
in net unrealized losses before income taxes |
(78 |
) |
(67 |
) |
(45 |
) | |||||
|
Defined
benefit pension and other postretirement plans adjustment: |
|||||||||||
|
Actuarial
gain (loss) arising during the period |
72 |
|
(134 |
) |
(57 |
) | |||||
|
Prior
service credit arising during the period |
— |
|
234 |
|
3 |
| |||||
|
Adjustments for amounts
recognized as components of net periodic benefit cost: |
|||||||||||
|
Amortization
of actuarial net loss |
51 |
|
46 |
|
70 |
| |||||
|
Amortization
of prior service (credit) cost |
(27 |
) |
(7 |
) |
1 |
| |||||
|
Change in defined benefit
pension and other postretirement plans adjustment before income
taxes |
96 |
|
139 |
|
17 |
| |||||
|
Total
other comprehensive income (loss) before income taxes |
18 |
|
72 |
|
(28 |
) | |||||
|
(Benefit)
provision for income taxes |
(1 |
) |
26 |
|
(11 |
) | |||||
|
Total
other comprehensive income (loss), net of tax |
19 |
|
46 |
|
(17 |
) | |||||
|
COMPREHENSIVE
INCOME |
$ |
762 |
|
$ |
523 |
|
$ |
504 |
| ||
|
Common
Stock |
Accumulated
Other
Comprehensive
Loss |
Total
Shareholders’
Equity | ||||||||||||||||||||||||
|
(in
millions, except per share data) |
Shares
Outstanding |
Amount |
Capital
Surplus |
Retained
Earnings |
Treasury
Stock |
|||||||||||||||||||||
|
BALANCE
AT DECEMBER 31, 2014 |
179.0 |
|
$ |
1,141 |
|
$ |
2,188 |
|
$ |
(412 |
) |
$ |
6,744 |
|
$ |
(2,259 |
) |
$ |
7,402 |
| ||||||
|
Net income |
— |
|
— |
|
— |
|
— |
|
521 |
|
— |
|
521 |
| ||||||||||||
|
Other comprehensive loss,
net of tax |
— |
|
— |
|
— |
|
(17 |
) |
— |
|
— |
|
(17 |
) | ||||||||||||
|
Cash dividends declared on
common stock ($0.83 per share) |
— |
|
— |
|
— |
|
— |
|
(148 |
) |
— |
|
(148 |
) | ||||||||||||
|
Purchase of common
stock |
(5.3 |
) |
— |
|
— |
|
— |
|
— |
|
(240 |
) |
(240 |
) | ||||||||||||
|
Purchase
and retirement of warrants |
— |
|
— |
|
(10 |
) |
— |
|
— |
|
— |
|
(10 |
) | ||||||||||||
|
Net issuance of common stock
under employee stock plans |
1.0 |
|
— |
|
(22 |
) |
— |
|
(11 |
) |
47 |
|
14 |
| ||||||||||||
|
Net issuance of common stock
for warrants |
1.0 |
|
— |
|
(21 |
) |
— |
|
(22 |
) |
43 |
|
— |
| ||||||||||||
|
Share-based
compensation |
— |
|
— |
|
38 |
|
— |
|
— |
|
— |
|
38 |
| ||||||||||||
|
BALANCE
AT DECEMBER 31, 2015 |
175.7 |
|
1,141 |
|
2,173 |
|
(429 |
) |
7,084 |
|
(2,409 |
) |
7,560 |
| ||||||||||||
|
Net
income |
— |
|
— |
|
— |
|
— |
|
477 |
|
— |
|
477 |
| ||||||||||||
|
Other comprehensive income,
net of tax |
— |
|
— |
|
— |
|
46 |
|
— |
|
— |
|
46 |
| ||||||||||||
|
Cash dividends declared on
common stock ($0.89 per share) |
— |
|
— |
|
— |
|
— |
|
(154 |
) |
— |
|
(154 |
) | ||||||||||||
|
Purchase of common
stock |
(6.8 |
) |
— |
|
— |
|
— |
|
— |
|
(310 |
) |
(310 |
) | ||||||||||||
|
Net issuance of common stock
under employee stock plans |
4.1 |
|
— |
|
(15 |
) |
— |
|
(27 |
) |
185 |
|
143 |
| ||||||||||||
|
Net issuance of common stock
for warrants |
2.3 |
|
— |
|
(57 |
) |
— |
|
(49 |
) |
106 |
|
— |
| ||||||||||||
|
Share-based
compensation |
— |
|
— |
|
34 |
|
— |
|
— |
|
— |
|
34 |
| ||||||||||||
|
BALANCE
AT DECEMBER 31, 2016 |
175.3 |
|
1,141 |
|
2,135 |
|
(383 |
) |
7,331 |
|
(2,428 |
) |
7,796 |
| ||||||||||||
|
Cumulative effect of change
in accounting principle |
— |
|
— |
|
3 |
|
— |
|
(2 |
) |
— |
|
1 |
| ||||||||||||
|
Net
income |
— |
|
— |
|
— |
|
— |
|
743 |
|
— |
|
743 |
| ||||||||||||
|
Other comprehensive income,
net of tax |
— |
|
— |
|
— |
|
19 |
|
— |
|
— |
|
19 |
| ||||||||||||
|
Cash dividends declared on
common stock ($1.09 per share) |
— |
|
— |
|
— |
|
— |
|
(193 |
) |
— |
|
(193 |
) | ||||||||||||
|
Purchase of common
stock |
(7.5 |
) |
— |
|
— |
|
— |
|
— |
|
(544 |
) |
(544 |
) | ||||||||||||
|
Net issuance of common stock
under employee stock plans |
3.3 |
|
— |
|
(24 |
) |
— |
|
(26 |
) |
152 |
|
102 |
| ||||||||||||
|
Net issuance of common stock
for warrants |
1.8 |
|
— |
|
(30 |
) |
— |
|
(53 |
) |
83 |
|
— |
| ||||||||||||
|
Share-based
compensation |
— |
|
— |
|
39 |
|
— |
|
— |
|
— |
|
39 |
| ||||||||||||
|
Reclassification of certain
deferred tax effects |
— |
|
— |
|
— |
|
(87 |
) |
87 |
|
— |
|
— |
| ||||||||||||
|
Other |
— |
|
— |
|
(1 |
) |
— |
|
— |
|
1 |
|
— |
| ||||||||||||
|
BALANCE
AT DECEMBER 31, 2017 |
172.9 |
|
$ |
1,141 |
|
$ |
2,122 |
|
$ |
(451 |
) |
$ |
7,887 |
|
$ |
(2,736 |
) |
$ |
7,963 |
| ||||||
|
(in
millions) |
|||||||||||
|
Years
Ended December 31 |
2017 |
2016 |
2015 | ||||||||
|
OPERATING
ACTIVITIES |
|||||||||||
|
Net
income |
$ |
743 |
|
$ |
477 |
|
$ |
521 |
| ||
|
Adjustments
to reconcile net income to net cash provided by operating
activities: |
|||||||||||
|
Provision
for credit losses |
74 |
|
248 |
|
147 |
| |||||
|
Provision
(benefit) for deferred income taxes |
79 |
|
(51 |
) |
(71 |
) | |||||
|
Depreciation
and amortization |
121 |
|
121 |
|
118 |
| |||||
|
Net
periodic defined benefit (credit) cost |
(18 |
) |
6 |
|
48 |
| |||||
|
Share-based
compensation expense |
39 |
|
34 |
|
38 |
| |||||
|
Net
amortization of securities |
6 |
|
8 |
|
13 |
| |||||
|
Accretion
of loan purchase discount |
(3 |
) |
(4 |
) |
(7 |
) | |||||
|
Net
securities losses |
— |
|
— |
|
2 |
| |||||
|
Net
gains on sales of foreclosed property |
(3 |
) |
(4 |
) |
(2 |
) | |||||
|
Net
change in: |
|||||||||||
|
Accrued
income receivable |
(33 |
) |
(20 |
) |
(12 |
) | |||||
|
Accrued
expenses payable |
41 |
|
37 |
|
(35 |
) | |||||
|
Other,
net |
57 |
|
(350 |
) |
105 |
| |||||
|
Net
cash provided by operating activities |
1,103 |
|
502 |
|
865 |
| |||||
|
INVESTING
ACTIVITIES |
|||||||||||
|
Investment
securities available-for-sale: |
|||||||||||
|
Maturities
and redemptions |
1,615 |
|
1,699 |
|
1,757 |
| |||||
|
Sales |
1,259 |
|
— |
|
— |
| |||||
|
Purchases |
(3,112 |
) |
(2,045 |
) |
(4,228 |
) | |||||
|
Investment
securities held-to-maturity: |
|||||||||||
|
Maturities
and redemptions |
319 |
|
402 |
|
324 |
| |||||
|
Purchases |
— |
|
— |
|
(362 |
) | |||||
|
Net
change in loans |
(175 |
) |
(136 |
) |
(644 |
) | |||||
|
Federal
Home Loan Bank stock: |
|||||||||||
|
Purchases |
(42 |
) |
(115 |
) |
— |
| |||||
|
Redemptions |
42 |
|
— |
|
— |
| |||||
|
Proceeds
from sales of foreclosed property |
22 |
|
20 |
|
12 |
| |||||
|
Net
increase in premises and equipment |
(69 |
) |
(95 |
) |
(119 |
) | |||||
|
Other,
net |
3 |
|
— |
|
5 |
| |||||
|
Net
cash used in investing activities |
(138 |
) |
(270 |
) |
(3,255 |
) | |||||
|
FINANCING
ACTIVITIES |
|||||||||||
|
Net
change in: |
|||||||||||
|
Deposits |
(1,180 |
) |
(998 |
) |
2,529 |
| |||||
|
Short-term
borrowings |
(15 |
) |
2 |
|
(93 |
) | |||||
|
Medium-
and long-term debt: |
|||||||||||
|
Maturities
and redemptions |
(500 |
) |
(650 |
) |
(606 |
) | |||||
|
Issuances |
— |
|
2,800 |
|
1,016 |
| |||||
|
Terminations |
(16 |
) |
— |
|
— |
| |||||
|
Common
stock: |
|||||||||||
|
Repurchases |
(552 |
) |
(315 |
) |
(240 |
) | |||||
|
Cash
dividends paid |
(180 |
) |
(152 |
) |
(147 |
) | |||||
|
Issuances
under employee stock plans |
110 |
|
152 |
|
22 |
| |||||
|
Purchase
and retirement of warrants |
— |
|
— |
|
(10 |
) | |||||
|
Other,
net |
(5 |
) |
— |
|
(5 |
) | |||||
|
Net
cash (used in) provided by financing activities |
(2,338 |
) |
839 |
|
2,466 |
| |||||
|
Net
(decrease) increase in cash and cash equivalents |
(1,373 |
) |
1,071 |
|
76 |
| |||||
|
Cash
and cash equivalents at beginning of period |
7,218 |
|
6,147 |
|
6,071 |
| |||||
|
Cash
and cash equivalents at end of period |
$ |
5,845 |
|
$ |
7,218 |
|
$ |
6,147 |
| ||
|
Interest
paid |
$ |
122 |
|
$ |
111 |
|
$ |
94 |
| ||
|
Income
taxes paid |
336 |
|
151 |
|
88 |
| |||||
|
Noncash
investing and financing activities: |
|||||||||||
|
Loans
transferred to other real estate |
8 |
|
21 |
|
12 |
| |||||
|
Loans
transferred from portfolio to held-for-sale |
— |
|
— |
|
28 |
| |||||
|
Loans
transferred from held-for-sale to portfolio |
— |
|
17 |
|
— |
| |||||
|
Lease
residual transferred to other assets |
— |
|
— |
|
16 |
| |||||
|
Level 1 |
Valuation
is based upon quoted prices for identical instruments traded in active
markets. | ||
|
Level
2 |
Valuation
is based upon quoted prices for similar instruments in active markets,
quoted prices for identical or similar instruments in markets that are
less active, and model-based valuation techniques for which all
significant assumptions are observable in the market. | ||
|
Level
3 |
Valuation
is generated from model-based techniques that use at least one significant
assumption not observable in the market. These unobservable assumptions
reflect estimates of assumptions that market participants would use in
pricing the asset or liability. Valuation techniques include use of option
pricing models, discounted cash flow models and similar
techniques. | ||
|
(in
millions) |
Total |
Level 1 |
Level 2 |
Level 3 |
||||||||||||
|
December 31,
2017 |
||||||||||||||||
|
Trading
securities: |
||||||||||||||||
|
Deferred compensation plan
assets |
$ |
92 |
|
$ |
92 |
|
$ |
— |
|
$ |
— |
|
||||
|
Investment
securities available-for-sale: |
||||||||||||||||
|
U.S.
Treasury and other U.S. government agency securities |
2,727 |
|
2,727 |
|
— |
|
— |
|
||||||||
|
Residential
mortgage-backed securities (a) |
8,124 |
|
— |
|
8,124 |
|
— |
|
||||||||
|
State
and municipal securities |
5 |
|
— |
|
— |
|
5 |
|
(b) | |||||||
|
Equity
and other non-debt securities |
82 |
|
38 |
|
— |
|
44 |
|
(b) | |||||||
|
Total
investment securities available-for-sale |
10,938 |
|
2,765 |
|
8,124 |
|
49 |
|
||||||||
|
Derivative
assets: |
||||||||||||||||
|
Interest
rate contracts |
57 |
|
— |
|
43 |
|
14 |
|
||||||||
|
Energy
derivative contracts |
93 |
|
— |
|
93 |
|
— |
|
||||||||
|
Foreign
exchange contracts |
42 |
|
— |
|
42 |
|
— |
|
||||||||
|
Warrants |
2 |
|
— |
|
— |
|
2 |
|
||||||||
|
Total
derivative assets |
194 |
|
— |
|
178 |
|
16 |
|
||||||||
|
Total
assets at fair value |
$ |
11,224 |
|
$ |
2,857 |
|
$ |
8,302 |
|
$ |
65 |
|
||||
|
Derivative
liabilities: |
||||||||||||||||
|
Interest
rate contracts |
$ |
59 |
|
$ |
— |
|
$ |
59 |
|
$ |
— |
|
||||
|
Energy
derivative contracts |
91 |
|
— |
|
91 |
|
— |
|
||||||||
|
Foreign
exchange contracts |
40 |
|
— |
|
40 |
|
— |
|
||||||||
|
Total
derivative liabilities |
190 |
|
— |
|
190 |
|
— |
|
||||||||
|
Deferred
compensation plan liabilities |
92 |
|
92 |
|
— |
|
— |
|
||||||||
|
Total
liabilities at fair value |
$ |
282 |
|
$ |
92 |
|
$ |
190 |
|
$ |
— |
|
||||
|
(a) |
Issued
and/or guaranteed by U.S. government agencies or U.S. government-sponsored
enterprises. |
|
(b) |
Auction-rate
securities. |
|
(in
millions) |
Total |
Level 1 |
Level 2 |
Level 3 |
||||||||||||
|
December 31,
2016 |
||||||||||||||||
|
Trading
securities: |
||||||||||||||||
|
Deferred
compensation plan assets |
$ |
87 |
|
$ |
87 |
|
$ |
— |
|
$ |
— |
|
||||
|
Equity
and other non-debt securities |
1 |
|
1 |
|
— |
|
— |
|
||||||||
|
Total
trading securities |
88 |
|
88 |
|
— |
|
— |
|
||||||||
|
Investment
securities available-for-sale: |
||||||||||||||||
|
U.S.
Treasury and other U.S. government agency securities |
2,779 |
|
2,779 |
|
— |
|
— |
|
||||||||
|
Residential
mortgage-backed securities (a) |
7,872 |
|
— |
|
7,872 |
|
— |
|
||||||||
|
State
and municipal securities |
7 |
|
— |
|
— |
|
7 |
|
(b) | |||||||
|
Equity
and other non-debt securities |
129 |
|
82 |
|
— |
|
47 |
|
(b) | |||||||
|
Total
investment securities available-for-sale |
10,787 |
|
2,861 |
|
7,872 |
|
54 |
|
||||||||
|
Derivative
assets: |
||||||||||||||||
|
Interest
rate contracts |
223 |
|
— |
|
212 |
|
11 |
|
||||||||
|
Energy
derivative contracts |
146 |
|
— |
|
146 |
|
— |
|
||||||||
|
Foreign
exchange contracts |
38 |
|
— |
|
38 |
|
— |
|
||||||||
|
Warrants |
3 |
|
— |
|
— |
|
3 |
|
||||||||
|
Total
derivative assets |
410 |
|
— |
|
396 |
|
14 |
|
||||||||
|
Total
assets at fair value |
$ |
11,285 |
|
$ |
2,949 |
|
$ |
8,268 |
|
$ |
68 |
|
||||
|
Derivative
liabilities: |
||||||||||||||||
|
Interest
rate contracts |
$ |
81 |
|
$ |
— |
|
$ |
81 |
|
$ |
— |
|
||||
|
Energy
derivative contracts |
144 |
|
— |
|
144 |
|
— |
|
||||||||
|
Foreign
exchange contracts |
29 |
|
— |
|
29 |
|
— |
|
||||||||
|
Total
derivative liabilities |
254 |
|
— |
|
254 |
|
— |
|
||||||||
|
Deferred
compensation plan liabilities |
87 |
|
87 |
|
— |
|
— |
|
||||||||
|
Total
liabilities at fair value |
$ |
341 |
|
$ |
87 |
|
$ |
254 |
|
$ |
— |
|
||||
|
(a) |
Issued
and/or guaranteed by U.S. government agencies or U.S. government-sponsored
enterprises. |
|
(b) |
Auction-rate
securities. |
|
Net
Realized/Unrealized Gains (Losses) (Pretax) |
|||||||||||||||||||||||||||
|
Balance
at
Beginning
of
Period |
Recorded in Earnings |
Recorded
in
Other
Comprehensive
Income |
Balance
at
End of
Period | ||||||||||||||||||||||||
|
(in
millions) |
Realized |
Unrealized |
Redemptions |
Sales |
|||||||||||||||||||||||
|
Year
Ended December 31, 2017 |
|||||||||||||||||||||||||||
|
Investment securities
available-for-sale: |
|||||||||||||||||||||||||||
|
State
and municipal securities (a) |
$ |
7 |
|
$ |
— |
|
$ |
— |
|
$ |
— |
|
$ |
(2 |
) |
$ |
— |
|
$ |
5 |
| ||||||
|
Equity
and other non-debt securities (a) |
47 |
|
— |
|
— |
|
(2 |
) |
(b) |
(1 |
) |
— |
|
44 |
| ||||||||||||
|
Total investment securities
available-for-sale |
54 |
|
— |
|
— |
|
(2 |
) |
(b) |
(3 |
) |
— |
|
49 |
| ||||||||||||
|
Derivative
assets: |
|||||||||||||||||||||||||||
|
Interest
rate contracts |
11 |
|
— |
|
3 |
|
(c) |
— |
|
— |
|
— |
|
14 |
| ||||||||||||
|
Warrants |
3 |
|
6 |
|
(c) |
(1 |
) |
(c) |
— |
|
— |
|
(6 |
) |
2 |
| |||||||||||
|
Year
Ended December 31, 2016 |
|||||||||||||||||||||||||||
|
Investment securities
available-for-sale: |
|||||||||||||||||||||||||||
|
State
and municipal securities (a) |
$ |
9 |
|
$ |
— |
|
$ |
— |
|
$ |
— |
|
$ |
(2 |
) |
$ |
— |
|
$ |
7 |
| ||||||
|
Corporate
debt securities (a) |
1 |
|
— |
|
— |
|
— |
|
(1 |
) |
— |
|
— |
| |||||||||||||
|
Equity
and other non-debt securities (a) |
67 |
|
— |
|
— |
|
(1 |
) |
(b) |
(19 |
) |
— |
|
47 |
| ||||||||||||
|
Total investment securities
available-for-sale |
77 |
|
— |
|
— |
|
(1 |
) |
(b) |
(22 |
) |
— |
|
54 |
| ||||||||||||
|
Derivative
assets: |
|||||||||||||||||||||||||||
|
Interest
rate contracts |
9 |
|
— |
|
2 |
|
(c) |
— |
|
— |
|
— |
|
11 |
| ||||||||||||
|
Warrants |
2 |
|
6 |
|
(c) |
1 |
|
(c) |
— |
|
— |
|
(6 |
) |
3 |
| |||||||||||
|
(a) |
Auction-rate
securities. |
|
(b) |
Recorded
in "net unrealized holding losses arising during the period" in other
comprehensive income (loss). |
|
(c) |
Realized
and unrealized gains and losses due to changes in fair value recorded in
"other noninterest income" on the consolidated statements of
income. |
|
(in
millions) |
Level 3 | ||
|
December 31,
2017 |
|||
|
Loans: |
|||
|
Commercial
|
$ |
111 |
|
|
Commercial
mortgage |
5 |
| |
|
Total
assets at fair value |
$ |
116 |
|
|
December 31,
2016 |
|||
|
Loans: |
|||
|
Commercial |
$ |
256 |
|
|
Commercial
mortgage |
15 |
| |
|
International |
11 |
| |
|
Total
loans |
282 |
| |
|
Other
real estate |
1 |
| |
|
Total
assets at fair value |
$ |
283 |
|
|
|
Carrying
Amount |
Estimated
Fair Value | |||||||||||||||||
|
(in
millions) |
Total |
Level
1 |
Level
2 |
Level
3 | |||||||||||||||
|
December 31,
2017 |
|||||||||||||||||||
|
Assets |
|||||||||||||||||||
|
Cash
and due from banks |
$ |
1,438 |
|
$ |
1,438 |
|
$ |
1,438 |
|
$ |
— |
|
$ |
— |
| ||||
|
Interest-bearing
deposits with banks |
4,407 |
|
4,407 |
|
4,407 |
|
— |
|
— |
| |||||||||
|
Investment
securities held-to-maturity |
1,266 |
|
1,246 |
|
— |
|
1,246 |
|
— |
| |||||||||
|
Loans
held-for-sale |
4 |
|
4 |
|
— |
|
4 |
|
— |
| |||||||||
|
Total
loans, net of allowance for loan losses (a) |
48,461 |
|
48,153 |
|
— |
|
— |
|
48,153 |
| |||||||||
|
Customers’
liability on acceptances outstanding |
2 |
|
2 |
|
2 |
|
— |
|
— |
| |||||||||
|
Restricted
equity investments |
207 |
|
207 |
|
207 |
|
— |
|
— |
| |||||||||
|
Nonmarketable
equity securities (b) |
6 |
|
9 |
|
|
|
|
|
|
| |||||||||
|
Liabilities |
|||||||||||||||||||
|
Demand
deposits (noninterest-bearing) |
32,071 |
|
32,071 |
|
— |
|
32,071 |
|
— |
| |||||||||
|
Interest-bearing
deposits |
23,667 |
|
23,667 |
|
— |
|
23,667 |
|
— |
| |||||||||
|
Customer
certificates of deposit |
2,165 |
|
2,142 |
|
— |
|
2,142 |
|
— |
| |||||||||
|
Total
deposits |
57,903 |
|
57,880 |
|
— |
|
57,880 |
|
— |
| |||||||||
|
Short-term
borrowings |
10 |
|
10 |
|
10 |
|
— |
|
— |
| |||||||||
|
Acceptances
outstanding |
2 |
|
2 |
|
2 |
|
— |
|
— |
| |||||||||
|
Medium-
and long-term debt |
4,622 |
|
4,636 |
|
— |
|
4,636 |
|
— |
| |||||||||
|
Credit-related
financial instruments |
(67 |
) |
(67 |
) |
— |
|
— |
|
(67 |
) | |||||||||
|
December 31,
2016 |
|||||||||||||||||||
|
Assets |
|||||||||||||||||||
|
Cash
and due from banks |
$ |
1,249 |
|
$ |
1,249 |
|
$ |
1,249 |
|
$ |
— |
|
$ |
— |
| ||||
|
Interest-bearing
deposits with banks |
5,969 |
|
5,969 |
|
5,969 |
|
— |
|
— |
| |||||||||
|
Investment
securities held-to-maturity |
1,582 |
|
1,576 |
|
— |
|
1,576 |
|
— |
| |||||||||
|
Loans
held-for-sale |
4 |
|
4 |
|
— |
|
4 |
|
— |
| |||||||||
|
Total
loans, net of allowance for loan losses (a) |
48,358 |
|
48,250 |
|
— |
|
— |
|
48,250 |
| |||||||||
|
Customers’
liability on acceptances outstanding |
5 |
|
5 |
|
5 |
|
— |
|
— |
| |||||||||
|
Restricted
equity investments |
207 |
|
207 |
|
207 |
|
— |
|
— |
| |||||||||
|
Nonmarketable
equity securities (b) |
11 |
|
16 |
|
|
|
| ||||||||||||
|
Liabilities |
|||||||||||||||||||
|
Demand
deposits (noninterest-bearing) |
31,540 |
|
31,540 |
|
— |
|
31,540 |
|
— |
| |||||||||
|
Interest-bearing
deposits |
24,639 |
|
24,639 |
|
— |
|
24,639 |
|
— |
| |||||||||
|
Customer
certificates of deposit |
2,806 |
|
2,731 |
|
— |
|
2,731 |
|
— |
| |||||||||
|
Total
deposits |
58,985 |
|
58,910 |
|
— |
|
58,910 |
|
— |
| |||||||||
|
Short-term
borrowings |
25 |
|
25 |
|
25 |
|
— |
|
— |
| |||||||||
|
Acceptances
outstanding |
5 |
|
5 |
|
5 |
|
— |
|
— |
| |||||||||
|
Medium-
and long-term debt |
5,160 |
|
5,132 |
|
— |
|
5,132 |
|
— |
| |||||||||
|
Credit-related
financial instruments |
(73 |
) |
(73 |
) |
— |
|
— |
|
(73 |
) | |||||||||
|
(a) |
Included
$116
million
and $282
million
of impaired loans recorded at fair value on a nonrecurring basis at
December 31,
2017
and 2016,
respectively. |
|
(b) |
Certain
investments that are measured at fair value using the net asset value have
not been classified in the fair value hierarchy. The fair value amounts
presented in the table are intended to permit reconciliation of the fair
value hierarchy to the amounts presented in the consolidated balance
sheets. |
|
(in
millions) |
Amortized
Cost |
Gross
Unrealized
Gains |
Gross
Unrealized
Losses |
Fair Value | |||||||||||
|
December 31,
2017 |
|||||||||||||||
|
Investment
securities available-for-sale: |
|||||||||||||||
|
U.S.
Treasury and other U.S. government agency securities |
$ |
2,743 |
|
$ |
— |
|
$ |
16 |
|
$ |
2,727 |
| |||
|
Residential
mortgage-backed securities (a) |
8,230 |
|
22 |
|
128 |
|
8,124 |
| |||||||
|
State
and municipal securities |
5 |
|
— |
|
— |
|
5 |
| |||||||
|
Equity
and other non-debt securities |
83 |
|
1 |
|
2 |
|
82 |
| |||||||
|
Total
investment securities available-for-sale (b) |
$ |
11,061 |
|
$ |
23 |
|
$ |
146 |
|
$ |
10,938 |
| |||
|
Investment
securities held-to-maturity (c): |
|||||||||||||||
|
Residential
mortgage-backed securities (a) |
$ |
1,266 |
|
$ |
— |
|
$ |
20 |
|
$ |
1,246 |
| |||
|
December 31,
2016 |
|||||||||||||||
|
Investment
securities available-for-sale: |
|||||||||||||||
|
U.S.
Treasury and other U.S. government agency securities |
$ |
2,772 |
|
$ |
8 |
|
$ |
1 |
|
$ |
2,779 |
| |||
|
Residential
mortgage-backed securities (a) |
7,921 |
|
48 |
|
97 |
|
7,872 |
| |||||||
|
State
and municipal securities |
7 |
|
— |
|
— |
|
7 |
| |||||||
|
Equity
and other non-debt securities |
129 |
|
1 |
|
1 |
|
129 |
| |||||||
|
Total
investment securities available-for-sale (b) |
$ |
10,829 |
|
$ |
57 |
|
$ |
99 |
|
$ |
10,787 |
| |||
|
Investment
securities held-to-maturity (c): |
|||||||||||||||
|
Residential
mortgage-backed securities (a) |
$ |
1,582 |
|
$ |
1 |
|
$ |
7 |
|
$ |
1,576 |
| |||
|
(a) |
Issued
and/or guaranteed by U.S. government agencies or U.S. government-sponsored
enterprises. |
|
(b) |
Included
auction-rate securities at amortized cost and fair value of $51
million
and $49
million,
respectively, as of December 31,
2017
and $55
million
and $54
million,
respectively, as of December 31,
2016. |
|
(c) |
The
amortized cost of investment securities held-to-maturity included the
unamortized balance of net unrealized losses as of the transfer date of
$9
million
and $12
million
at December 31,
2017
and 2016,
respectively, related to securities transferred from available-for-sale,
which is included in accumulated other comprehensive
loss. |
|
|
Temporarily
Impaired | |||||||||||||||||||||||||
|
|
Less than 12 Months |
12 Months or more |
Total | |||||||||||||||||||||||
|
(in
millions) |
Fair
Value |
Unrealized
Losses |
Fair
Value |
Unrealized
Losses |
Fair
Value |
Unrealized
Losses | ||||||||||||||||||||
|
December 31,
2017 |
||||||||||||||||||||||||||
|
U.S. Treasury and other
U.S. government agency securities |
$ |
2,727 |
|
$ |
16 |
|
$ |
— |
|
$ |
— |
|
$ |
2,727 |
|
$ |
16 |
|
||||||||
|
Residential
mortgage-backed securities (a) |
3,845 |
|
32 |
|
4,003 |
|
125 |
|
7,848 |
|
157 |
|
||||||||||||||
|
State
and municipal securities (b) |
— |
|
— |
|
5 |
|
— |
|
(c) |
5 |
|
— |
|
(c) | ||||||||||||
|
Equity
and other non-debt securities (b) |
— |
|
— |
|
44 |
|
2 |
|
44 |
|
2 |
|
||||||||||||||
|
Total
impaired securities |
$ |
6,572 |
|
$ |
48 |
|
$ |
4,052 |
|
|
$ |
127 |
|
$ |
10,624 |
|
$ |
175 |
|
|||||||
|
December 31,
2016 |
||||||||||||||||||||||||||
|
U.S. Treasury and other
U.S. government agency securities |
$ |
527 |
|
$ |
1 |
|
$ |
— |
|
$ |
— |
|
$ |
527 |
|
$ |
1 |
|
||||||||
|
Residential
mortgage-backed securities (a) |
4,992 |
|
87 |
|
1,177 |
|
32 |
|
6,169 |
|
119 |
|
||||||||||||||
|
State
and municipal securities (b) |
— |
|
— |
|
7 |
|
— |
|
(c) |
7 |
|
— |
|
(c) | ||||||||||||
|
Equity
and other non-debt securities (b) |
36 |
|
— |
|
(c) |
11 |
|
— |
|
(c) |
47 |
|
— |
|
(c) | |||||||||||
|
Total
impaired securities |
$ |
5,555 |
|
$ |
88 |
|
$ |
1,195 |
|
$ |
32 |
|
$ |
6,750 |
|
$ |
120 |
|
||||||||
|
(a) |
Issued
and/or guaranteed by U.S. government agencies or U.S. government-sponsored
enterprises. |
|
(b) |
Primarily
auction-rate securities. |
|
(c) |
Unrealized
losses less than $0.5 million. |
|
(in
millions) |
||||||||||||||
|
Years
Ended December 31 |
2017 |
2016 |
2015 | |||||||||||
|
Securities
gains |
$ |
2 |
|
$ |
— |
|
$ |
— |
|
|||||
|
Securities
losses |
(5 |
) |
(5 |
) |
(2 |
) |
||||||||
|
Net
securities losses (a) |
$ |
(3 |
) |
$ |
(5 |
) |
$ |
(2 |
) |
|||||
|
(a) |
Primarily
charges related to a derivative contract tied to the conversion rate of
Visa Class B shares. |
|
(in
millions) |
Available-for-sale |
Held-to-maturity | ||||||||||||
|
December 31,
2017 |
Amortized
Cost |
Fair
Value |
Amortized
Cost |
Fair
Value | ||||||||||
|
Contractual
maturity |
||||||||||||||
|
After
one year through five years |
$ |
2,956 |
|
$ |
2,939 |
|
$ |
— |
|
$ |
— |
| ||
|
After
five years through ten years |
1,690 |
|
1,697 |
|
17 |
|
17 |
| ||||||
|
After
ten years |
6,332 |
|
6,220 |
|
1,249 |
|
1,229 |
| ||||||
|
Subtotal |
10,978 |
|
10,856 |
|
1,266 |
|
1,246 |
| ||||||
|
Equity
and other non-debt securities |
83 |
|
82 |
|
— |
|
— |
| ||||||
|
Total
investment securities |
$ |
11,061 |
|
$ |
10,938 |
|
$ |
1,266 |
|
$ |
1,246 |
| ||
|
Loans Past Due and Still Accruing |
|
|
| ||||||||||||||||||||||||
|
(in
millions) |
30-59
Days |
60-89
Days |
90 Days
or More |
Total |
Nonaccrual
Loans |
Current
Loans |
Total
Loans | ||||||||||||||||||||
|
December 31,
2017 |
|||||||||||||||||||||||||||
|
Business
loans: |
|||||||||||||||||||||||||||
|
Commercial |
$ |
79 |
|
$ |
134 |
|
$ |
12 |
|
$ |
225 |
|
$ |
309 |
|
$ |
30,526 |
|
$ |
31,060 |
| ||||||
|
Real
estate construction: |
|||||||||||||||||||||||||||
|
Commercial Real Estate
business line (a) |
3 |
|
— |
|
— |
|
3 |
|
— |
|
2,627 |
|
2,630 |
| |||||||||||||
|
Other
business lines (b) |
4 |
|
— |
|
— |
|
4 |
|
— |
|
327 |
|
331 |
| |||||||||||||
|
Total
real estate construction |
7 |
|
— |
|
— |
|
7 |
|
— |
|
2,954 |
|
2,961 |
| |||||||||||||
|
Commercial
mortgage: |
|||||||||||||||||||||||||||
|
Commercial Real Estate
business line (a) |
14 |
|
— |
|
— |
|
14 |
|
9 |
|
1,808 |
|
1,831 |
| |||||||||||||
|
Other
business lines (b) |
27 |
|
6 |
|
22 |
|
55 |
|
22 |
|
7,251 |
|
7,328 |
| |||||||||||||
|
Total
commercial mortgage |
41 |
|
6 |
|
22 |
|
69 |
|
31 |
|
9,059 |
|
9,159 |
| |||||||||||||
|
Lease
financing |
— |
|
— |
|
— |
|
— |
|
4 |
|
464 |
|
468 |
| |||||||||||||
|
International |
13 |
|
— |
|
— |
|
13 |
|
6 |
|
964 |
|
983 |
| |||||||||||||
|
Total
business loans |
140 |
|
140 |
|
34 |
|
314 |
|
350 |
|
43,967 |
|
44,631 |
| |||||||||||||
|
Retail
loans: |
|||||||||||||||||||||||||||
|
Residential
mortgage |
10 |
|
2 |
|
— |
|
12 |
|
31 |
|
1,945 |
|
1,988 |
| |||||||||||||
|
Consumer: |
|||||||||||||||||||||||||||
|
Home
equity |
5 |
|
1 |
|
— |
|
6 |
|
21 |
|
1,789 |
|
1,816 |
| |||||||||||||
|
Other
consumer |
4 |
|
— |
|
1 |
|
5 |
|
— |
|
733 |
|
738 |
| |||||||||||||
|
Total
consumer |
9 |
|
1 |
|
1 |
|
11 |
|
21 |
|
2,522 |
|
2,554 |
| |||||||||||||
|
Total
retail loans |
19 |
|
3 |
|
1 |
|
23 |
|
52 |
|
4,467 |
|
4,542 |
| |||||||||||||
|
Total
loans |
$ |
159 |
|
$ |
143 |
|
$ |
35 |
|
$ |
337 |
|
$ |
402 |
|
$ |
48,434 |
|
$ |
49,173 |
| ||||||
|
December 31,
2016 |
|||||||||||||||||||||||||||
|
Business
loans: |
|||||||||||||||||||||||||||
|
Commercial |
$ |
30 |
|
$ |
12 |
|
$ |
14 |
|
$ |
56 |
|
$ |
445 |
|
$ |
30,493 |
|
$ |
30,994 |
| ||||||
|
Real
estate construction: |
|||||||||||||||||||||||||||
|
Commercial Real Estate
business line (a) |
— |
|
— |
|
— |
|
— |
|
— |
|
2,485 |
|
2,485 |
| |||||||||||||
|
Other
business lines (b) |
— |
|
— |
|
— |
|
— |
|
— |
|
384 |
|
384 |
| |||||||||||||
|
Total
real estate construction |
— |
|
— |
|
— |
|
— |
|
— |
|
2,869 |
|
2,869 |
| |||||||||||||
|
Commercial
mortgage: |
|||||||||||||||||||||||||||
|
Commercial Real Estate
business line (a) |
5 |
|
— |
|
— |
|
5 |
|
9 |
|
2,004 |
|
2,018 |
| |||||||||||||
|
Other
business lines (b) |
58 |
|
5 |
|
5 |
|
68 |
|
37 |
|
6,808 |
|
6,913 |
| |||||||||||||
|
Total
commercial mortgage |
63 |
|
5 |
|
5 |
|
73 |
|
46 |
|
8,812 |
|
8,931 |
| |||||||||||||
|
Lease
financing |
— |
|
— |
|
— |
|
— |
|
6 |
|
566 |
|
572 |
| |||||||||||||
|
International |
1 |
|
— |
|
— |
|
1 |
|
14 |
|
1,243 |
|
1,258 |
| |||||||||||||
|
Total
business loans |
94 |
|
17 |
|
19 |
|
130 |
|
511 |
|
43,983 |
|
44,624 |
| |||||||||||||
|
Retail
loans: |
|||||||||||||||||||||||||||
|
Residential
mortgage |
7 |
|
3 |
|
— |
|
10 |
|
39 |
|
1,893 |
|
1,942 |
| |||||||||||||
|
Consumer: |
|||||||||||||||||||||||||||
|
Home
equity |
4 |
|
3 |
|
— |
|
7 |
|
28 |
|
1,765 |
|
1,800 |
| |||||||||||||
|
Other
consumer |
1 |
|
— |
|
— |
|
1 |
|
4 |
|
717 |
|
722 |
| |||||||||||||
|
Total
consumer |
5 |
|
3 |
|
— |
|
8 |
|
32 |
|
2,482 |
|
2,522 |
| |||||||||||||
|
Total
retail loans |
12 |
|
6 |
|
— |
|
18 |
|
71 |
|
4,375 |
|
4,464 |
| |||||||||||||
|
Total
loans |
$ |
106 |
|
$ |
23 |
|
$ |
19 |
|
$ |
148 |
|
$ |
582 |
|
$ |
48,358 |
|
$ |
49,088 |
| ||||||
|
(a) |
Primarily
loans to real estate developers. |
|
(b) |
Primarily
loans secured by owner-occupied real
estate. |
|
|
Internally
Assigned Rating |
| |||||||||||||||||
|
(in
millions) |
Pass (a) |
Special
Mention (b) |
Substandard (c) |
Nonaccrual (d) |
Total | ||||||||||||||
|
December 31,
2017 |
|||||||||||||||||||
|
Business
loans: |
|||||||||||||||||||
|
Commercial |
$ |
29,263 |
|
$ |
591 |
|
$ |
897 |
|
$ |
309 |
|
$ |
31,060 |
| ||||
|
Real
estate construction: |
|||||||||||||||||||
|
Commercial
Real Estate business line (e) |
2,630 |
|
— |
|
— |
|
— |
|
2,630 |
| |||||||||
|
Other
business lines (f) |
327 |
|
4 |
|
— |
|
— |
|
331 |
| |||||||||
|
Total
real estate construction |
2,957 |
|
4 |
|
— |
|
— |
|
2,961 |
| |||||||||
|
Commercial
mortgage: |
|||||||||||||||||||
|
Commercial
Real Estate business line (e) |
1,759 |
|
20 |
|
43 |
|
9 |
|
1,831 |
| |||||||||
|
Other
business lines (f) |
7,099 |
|
115 |
|
92 |
|
22 |
|
7,328 |
| |||||||||
|
Total
commercial mortgage |
8,858 |
|
135 |
|
135 |
|
31 |
|
9,159 |
| |||||||||
|
Lease
financing |
440 |
|
23 |
|
1 |
|
4 |
|
468 |
| |||||||||
|
International |
946 |
|
11 |
|
20 |
|
6 |
|
983 |
| |||||||||
|
Total
business loans |
42,464 |
|
764 |
|
1,053 |
|
350 |
|
44,631 |
| |||||||||
|
Retail
loans: |
|||||||||||||||||||
|
Residential
mortgage |
1,955 |
|
2 |
|
— |
|
31 |
|
1,988 |
| |||||||||
|
Consumer: |
|||||||||||||||||||
|
Home
equity |
1,786 |
|
1 |
|
8 |
|
21 |
|
1,816 |
| |||||||||
|
Other
consumer |
737 |
|
1 |
|
— |
|
— |
|
738 |
| |||||||||
|
Total
consumer |
2,523 |
|
2 |
|
8 |
|
21 |
|
2,554 |
| |||||||||
|
Total
retail loans |
4,478 |
|
4 |
|
8 |
|
52 |
|
4,542 |
| |||||||||
|
Total
loans |
$ |
46,942 |
|
$ |
768 |
|
$ |
1,061 |
|
$ |
402 |
|
$ |
49,173 |
| ||||
|
December 31,
2016 |
|||||||||||||||||||
|
Business
loans: |
|||||||||||||||||||
|
Commercial |
$ |
28,616 |
|
$ |
944 |
|
$ |
989 |
|
$ |
445 |
|
$ |
30,994 |
| ||||
|
Real
estate construction: |
|||||||||||||||||||
|
Commercial
Real Estate business line (e) |
2,485 |
|
— |
|
— |
|
— |
|
2,485 |
| |||||||||
|
Other
business lines (f) |
381 |
|
— |
|
3 |
|
— |
|
384 |
| |||||||||
|
Total
real estate construction |
2,866 |
|
— |
|
3 |
|
— |
|
2,869 |
| |||||||||
|
Commercial
mortgage: |
|||||||||||||||||||
|
Commercial
Real Estate business line (e) |
1,970 |
|
19 |
|
20 |
|
9 |
|
2,018 |
| |||||||||
|
Other
business lines (f) |
6,645 |
|
109 |
|
122 |
|
37 |
|
6,913 |
| |||||||||
|
Total
commercial mortgage |
8,615 |
|
128 |
|
142 |
|
46 |
|
8,931 |
| |||||||||
|
Lease
financing |
550 |
|
11 |
|
5 |
|
6 |
|
572 |
| |||||||||
|
International |
1,200 |
|
22 |
|
22 |
|
14 |
|
1,258 |
| |||||||||
|
Total
business loans |
41,847 |
|
1,105 |
|
1,161 |
|
511 |
|
44,624 |
| |||||||||
|
Retail
loans: |
|||||||||||||||||||
|
Residential
mortgage |
1,900 |
|
3 |
|
— |
|
39 |
|
1,942 |
| |||||||||
|
Consumer: |
|||||||||||||||||||
|
Home
equity |
1,767 |
|
1 |
|
4 |
|
28 |
|
1,800 |
| |||||||||
|
Other
consumer |
718 |
|
— |
|
— |
|
4 |
|
722 |
| |||||||||
|
Total
consumer |
2,485 |
|
1 |
|
4 |
|
32 |
|
2,522 |
| |||||||||
|
Total
retail loans |
4,385 |
|
4 |
|
4 |
|
71 |
|
4,464 |
| |||||||||
|
Total
loans |
$ |
46,232 |
|
$ |
1,109 |
|
$ |
1,165 |
|
$ |
582 |
|
$ |
49,088 |
| ||||
|
(a) |
Includes
all loans not included in the categories of special mention, substandard
or nonaccrual. |
|
(b) |
Special
mention loans are accruing loans that have potential credit weaknesses
that deserve management’s close attention, such as loans to borrowers who
may be experiencing financial difficulties that may result in
deterioration of repayment prospects from the borrower at some future
date. This category is generally consistent with the "special mention"
category as defined by regulatory
authorities. |
|
(c) |
Substandard
loans are accruing loans that have a well-defined weakness, or weaknesses,
such as loans to borrowers who may be experiencing losses from operations
or inadequate liquidity of a degree and duration that jeopardizes the
orderly repayment of the loan. Substandard loans also are distinguished by
the distinct possibility of loss in the future if these weaknesses are not
corrected. This category is generally consistent with the "substandard"
category as defined by regulatory
authorities. |
|
(d) |
Nonaccrual
loans are loans for which the accrual of interest has been discontinued.
For further information regarding nonaccrual loans, refer to the
Nonperforming Assets subheading in Note 1 - Basis of Presentation and
Accounting Policies. A significant majority of nonaccrual loans are
generally consistent with the "substandard" category and the remainder are
generally consistent with the "doubtful" category as defined by regulatory
authorities. |
|
(e) |
Primarily
loans to real estate developers. |
|
(f) |
Primarily
loans secured by owner-occupied real
estate. |
|
(in
millions) |
December 31,
2017 |
December 31,
2016 | |||||
|
Nonaccrual
loans |
$ |
402 |
|
$ |
582 |
| |
|
Reduced-rate
loans (a) |
8 |
|
8 |
| |||
|
Total
nonperforming loans |
410 |
|
590 |
| |||
|
Foreclosed
property (b) |
5 |
|
17 |
| |||
|
Total
nonperforming assets |
$ |
415 |
|
$ |
607 |
| |
|
(a) |
There
were no
reduced-rate business loans at both December 31,
2017
and 2016.
Reduced-rate retail loans totaled $8
million
at both December 31,
2017
and 2016. |
|
(b) |
Included
foreclosed residential real estate properties of $4
million
and $3
million
at December 31,
2017
and 2016,
respectively. |
|
|
2017 |
2016 |
2015 | |||||||||||||||||||||||||||||
|
(in
millions) |
Business
Loans |
Retail
Loans |
Total |
Business
Loans |
Retail
Loans |
Total |
Business
Loans |
Retail
Loans |
Total | |||||||||||||||||||||||
|
Years
Ended December 31 |
||||||||||||||||||||||||||||||||
|
Allowance
for loan losses: |
||||||||||||||||||||||||||||||||
|
Balance at beginning of
period |
$ |
682 |
|
$ |
48 |
|
$ |
730 |
|
$ |
579 |
|
$ |
55 |
|
$ |
634 |
|
$ |
534 |
|
$ |
60 |
|
$ |
594 |
| |||||
|
Loan
charge-offs |
(143 |
) |
(6 |
) |
(149 |
) |
(207 |
) |
(7 |
) |
(214 |
) |
(157 |
) |
(11 |
) |
(168 |
) | ||||||||||||||
|
Recoveries on loans
previously charged-off |
50 |
|
7 |
|
57 |
|
63 |
|
5 |
|
68 |
|
55 |
|
13 |
|
68 |
| ||||||||||||||
|
Net loan (charge-offs)
recoveries |
(93 |
) |
1 |
|
(92 |
) |
(144 |
) |
(2 |
) |
(146 |
) |
(102 |
) |
2 |
|
(100 |
) | ||||||||||||||
|
Provision
for loan losses |
71 |
|
2 |
|
73 |
|
246 |
|
(5 |
) |
241 |
|
149 |
|
(7 |
) |
142 |
| ||||||||||||||
|
Foreign currency translation
adjustment |
1 |
|
— |
|
1 |
|
1 |
|
— |
|
1 |
|
(2 |
) |
— |
|
(2 |
) | ||||||||||||||
|
Balance
at end of period |
$ |
661 |
|
$ |
51 |
|
$ |
712 |
|
$ |
682 |
|
$ |
48 |
|
$ |
730 |
|
$ |
579 |
|
$ |
55 |
|
$ |
634 |
| |||||
|
As
a percentage of total loans |
1.48 |
% |
1.12 |
% |
1.45 |
% |
1.53 |
% |
1.08 |
% |
1.49 |
% |
1.30 |
% |
1.26 |
% |
1.29 |
% | ||||||||||||||
|
December 31 |
||||||||||||||||||||||||||||||||
|
Allowance
for loan losses: |
||||||||||||||||||||||||||||||||
|
Individually evaluated for
impairment |
$ |
67 |
|
$ |
— |
|
$ |
67 |
|
$ |
86 |
|
$ |
3 |
|
$ |
89 |
|
$ |
53 |
|
$ |
— |
|
$ |
53 |
| |||||
|
Collectively evaluated for
impairment |
594 |
|
51 |
|
645 |
|
596 |
|
45 |
|
641 |
|
526 |
|
55 |
|
581 |
| ||||||||||||||
|
Total allowance for loan
losses |
$ |
661 |
|
$ |
51 |
|
$ |
712 |
|
$ |
682 |
|
$ |
48 |
|
$ |
730 |
|
$ |
579 |
|
$ |
55 |
|
$ |
634 |
| |||||
|
Loans: |
||||||||||||||||||||||||||||||||
|
Individually evaluated for
impairment |
$ |
443 |
|
$ |
34 |
|
$ |
477 |
|
$ |
566 |
|
$ |
48 |
|
$ |
614 |
|
$ |
393 |
|
$ |
31 |
|
$ |
424 |
| |||||
|
Collectively evaluated for
impairment |
44,188 |
|
4,508 |
|
48,696 |
|
44,058 |
|
4,416 |
|
48,474 |
|
44,336 |
|
4,324 |
|
48,660 |
| ||||||||||||||
|
Total loans evaluated for
impairment |
$ |
44,631 |
|
$ |
4,542 |
|
$ |
49,173 |
|
$ |
44,624 |
|
$ |
4,464 |
|
$ |
49,088 |
|
$ |
44,729 |
|
$ |
4,355 |
|
$ |
49,084 |
| |||||
|
(in
millions) |
|||||||||||
|
Years
Ended December 31 |
2017 |
2016 |
2015 | ||||||||
|
Balance
at beginning of period |
$ |
41 |
|
$ |
45 |
|
$ |
41 |
| ||
|
Charge-offs
on lending-related commitments (a) |
— |
|
(11 |
) |
(1 |
) | |||||
|
Provision
for credit losses on lending-related commitments |
1 |
|
7 |
|
5 |
| |||||
|
Balance
at end of period |
$ |
42 |
|
$ |
41 |
|
$ |
45 |
| ||
|
|
Recorded
Investment In: |
|
| ||||||||||||||||
|
(in
millions) |
Impaired
Loans
with
No
Related
Allowance |
Impaired
Loans
with
Related
Allowance |
Total
Impaired
Loans |
Unpaid
Principal
Balance |
Related
Allowance
for
Loan
Losses | ||||||||||||||
|
December 31,
2017 |
|||||||||||||||||||
|
Business
loans: |
|||||||||||||||||||
|
Commercial |
$ |
105 |
|
$ |
267 |
|
$ |
372 |
|
$ |
460 |
|
$ |
63 |
| ||||
|
Commercial
mortgage: |
|||||||||||||||||||
|
Commercial
Real Estate business line (a) |
39 |
|
1 |
|
40 |
|
49 |
|
— |
| |||||||||
|
Other
business lines (b) |
3 |
|
22 |
|
25 |
|
29 |
|
3 |
| |||||||||
|
Total
commercial mortgage |
42 |
|
23 |
|
65 |
|
78 |
|
3 |
| |||||||||
|
International |
— |
|
6 |
|
6 |
|
17 |
|
1 |
| |||||||||
|
Total
business loans |
147 |
|
296 |
|
443 |
|
555 |
|
67 |
| |||||||||
|
Retail
loans: |
|||||||||||||||||||
|
Residential
mortgage |
14 |
|
8 |
|
22 |
|
22 |
|
— |
| |||||||||
|
Consumer: |
|||||||||||||||||||
|
Home
equity |
11 |
|
— |
|
11 |
|
14 |
|
— |
| |||||||||
|
Other
consumer |
1 |
|
— |
|
1 |
|
2 |
|
— |
| |||||||||
|
Total
consumer |
12 |
|
— |
|
12 |
|
16 |
|
— |
| |||||||||
|
Total
retail loans (c) |
26 |
|
8 |
|
34 |
|
38 |
|
— |
| |||||||||
|
Total
individually evaluated impaired loans |
$ |
173 |
|
$ |
304 |
|
$ |
477 |
|
$ |
593 |
|
$ |
67 |
| ||||
|
December 31,
2016 |
|||||||||||||||||||
|
Business
loans: |
|||||||||||||||||||
|
Commercial |
$ |
90 |
|
$ |
423 |
|
$ |
513 |
|
$ |
608 |
|
$ |
80 |
| ||||
|
Commercial
mortgage: |
|||||||||||||||||||
|
Commercial
Real Estate business line (a) |
— |
|
7 |
|
7 |
|
15 |
|
1 |
| |||||||||
|
Other
business lines (b) |
2 |
|
30 |
|
32 |
|
40 |
|
3 |
| |||||||||
|
Total
commercial mortgage |
2 |
|
37 |
|
39 |
|
55 |
|
4 |
| |||||||||
|
International |
3 |
|
11 |
|
14 |
|
20 |
|
2 |
| |||||||||
|
Total
business loans |
95 |
|
471 |
|
566 |
|
683 |
|
86 |
| |||||||||
|
Retail
loans: |
|||||||||||||||||||
|
Residential
mortgage |
19 |
|
9 |
|
28 |
|
30 |
|
2 |
| |||||||||
|
Consumer: |
|||||||||||||||||||
|
Home
equity |
15 |
|
— |
|
15 |
|
19 |
|
— |
| |||||||||
|
Other
consumer |
2 |
|
3 |
|
5 |
|
6 |
|
1 |
| |||||||||
|
Total
consumer |
17 |
|
3 |
|
20 |
|
25 |
|
1 |
| |||||||||
|
Total
retail loans (c) |
36 |
|
12 |
|
48 |
|
55 |
|
3 |
| |||||||||
|
Total
individually evaluated impaired loans |
$ |
131 |
|
$ |
483 |
|
$ |
614 |
|
$ |
738 |
|
$ |
89 |
| ||||
|
(a) |
Primarily
loans to real estate developers. |
|
(b) |
Primarily
loans secured by owner-occupied real
estate. |
|
(c) |
Individually
evaluated retail loans generally have no related allowance for loan
losses, primarily due to policy which results in direct write-downs of
most restructured retail loans. |
|
Individually
Evaluated Impaired Loans | |||||||||||||||||||||||
|
2017 |
2016 |
2015 | |||||||||||||||||||||
|
(in
millions) |
Average
Balance for the Period |
Interest
Income Recognized for the Period |
Average
Balance for the Period |
Interest
Income Recognized for the Period |
Average
Balance for the Period |
Interest
Income Recognized for the Period | |||||||||||||||||
|
Years
Ended December 31 |
|||||||||||||||||||||||
|
Business
loans: |
|||||||||||||||||||||||
|
Commercial |
$ |
451 |
|
$ |
8 |
|
$ |
550 |
|
$ |
10 |
|
$ |
206 |
|
$ |
5 |
| |||||
|
Commercial
mortgage: |
|||||||||||||||||||||||
|
Commercial Real Estate
business line (a) |
21 |
|
2 |
|
9 |
|
— |
|
16 |
|
— |
| |||||||||||
|
Other
business lines (b) |
31 |
|
— |
|
31 |
|
1 |
|
39 |
|
1 |
| |||||||||||
|
Total
commercial mortgage |
52 |
|
2 |
|
40 |
|
1 |
|
55 |
|
1 |
| |||||||||||
|
International |
8 |
|
— |
|
18 |
|
— |
|
6 |
|
— |
| |||||||||||
|
Total
business loans |
511 |
|
10 |
|
608 |
|
11 |
|
267 |
|
6 |
| |||||||||||
|
Retail
loans: |
|||||||||||||||||||||||
|
Residential
mortgage |
24 |
|
— |
|
15 |
|
— |
|
21 |
|
— |
| |||||||||||
|
Consumer: |
|||||||||||||||||||||||
|
Home
equity |
13 |
|
— |
|
13 |
|
— |
|
12 |
|
— |
| |||||||||||
|
Other
consumer |
3 |
|
— |
|
4 |
|
— |
|
6 |
|
— |
| |||||||||||
|
Total
consumer |
16 |
|
— |
|
17 |
|
— |
|
18 |
|
— |
| |||||||||||
|
Total
retail loans |
40 |
|
— |
|
32 |
|
— |
|
39 |
|
— |
| |||||||||||
|
Total individually
evaluated impaired loans |
$ |
551 |
|
$ |
10 |
|
$ |
640 |
|
$ |
11 |
|
$ |
306 |
|
$ |
6 |
| |||||
|
(a) |
Primarily
loans to real estate developers. |
|
(b) |
Primarily
loans secured by owner-occupied real
estate. |
|
2017 |
2016 | ||||||||||||||||||||||||||
|
Type
of Modification |
Type
of Modification |
||||||||||||||||||||||||||
|
(in
millions) |
Principal
Deferrals (a) |
Interest
Rate (b) |
AB
Note Restructures (c) |
Total
Modifications |
Principal
Deferrals (a) |
Interest
Rate (b) |
AB
Note Restructures (c) |
Total
Modifications | |||||||||||||||||||
|
Years
Ended December 31 |
|||||||||||||||||||||||||||
|
Business
loans: |
|||||||||||||||||||||||||||
|
Commercial |
$ |
77 |
|
$ |
18 |
|
$ |
21 |
|
$ |
116 |
|
$ |
140 |
|
$ |
— |
|
$ |
48 |
|
$ |
188 |
| |||
|
Commercial
mortgage: |
|||||||||||||||||||||||||||
|
Commercial Real Estate
business line (d) |
37 |
|
— |
|
— |
|
37 |
|
— |
|
— |
|
— |
|
— |
| |||||||||||
|
Other
business lines (e) |
3 |
|
— |
|
— |
|
3 |
|
5 |
|
— |
|
— |
|
5 |
| |||||||||||
|
Total commercial
mortgage |
40 |
|
— |
|
— |
|
40 |
|
5 |
|
— |
|
— |
|
5 |
| |||||||||||
|
International |
— |
|
— |
|
— |
|
— |
|
— |
|
— |
|
3 |
|
3 |
| |||||||||||
|
Total
business loans |
117 |
|
18 |
|
21 |
|
156 |
|
145 |
|
— |
|
51 |
|
196 |
| |||||||||||
|
Retail
loans: |
|||||||||||||||||||||||||||
|
Residential
mortgage |
— |
|
— |
|
— |
|
— |
|
— |
|
2 |
|
— |
|
2 |
| |||||||||||
|
Consumer: |
|||||||||||||||||||||||||||
|
Home
equity (f) |
1 |
|
2 |
|
— |
|
3 |
|
2 |
|
1 |
|
— |
|
3 |
| |||||||||||
|
Total
retail loans |
1 |
|
2 |
|
— |
|
3 |
|
|
2 |
|
3 |
|
— |
|
5 |
| ||||||||||
|
Total
loans |
$ |
118 |
|
$ |
20 |
|
$ |
21 |
|
$ |
159 |
|
$ |
147 |
|
$ |
3 |
|
$ |
51 |
|
$ |
201 |
| |||
|
(a) |
Primarily
represents loan balances where terms were extended 90 days or
more at or above contractual interest
rates. |
|
(b) |
Loan
restructurings whereby interest rates were either reduced or were not at
market rates. |
|
(c) |
Loan
restructurings whereby the original loan is restructured into two notes:
an "A" note, which generally reflects the portion of the modified loan
which is expected to be collected; and a "B" note, which is either fully
charged off or exchanged for an equity interest.
|
|
(d) |
Primarily
loans to real estate developers. |
|
(e) |
Primarily
loans secured by owner-occupied real
estate. |
|
(f) |
Includes
bankruptcy loans for which the court has discharged the borrower's
obligation and the borrower has not reaffirmed the
debt. |
|
2017 |
2016 | ||||||||||||||
|
(in
millions) |
Balance
at December 31 |
Subsequent
Default in the Year Ended December 31 |
Balance
at December 31 |
Subsequent
Default in the Year Ended December 31 | |||||||||||
|
Principal
deferrals: |
|||||||||||||||
|
Business
loans: |
|||||||||||||||
|
Commercial |
$ |
77 |
|
$ |
3 |
|
$ |
140 |
|
$ |
13 |
| |||
|
Commercial
mortgage: |
|||||||||||||||
|
Commercial Real Estate
business line (a) |
37 |
|
— |
|
— |
|
— |
| |||||||
|
Other
business lines (b) |
3 |
|
— |
|
5 |
|
1 |
| |||||||
|
Total commercial
mortgage |
40 |
|
— |
|
5 |
|
1 |
| |||||||
|
International |
— |
|
— |
|
— |
|
— |
| |||||||
|
Total
business loans |
117 |
|
3 |
|
145 |
|
14 |
| |||||||
|
Retail
loans: |
|||||||||||||||
|
Consumer: |
|||||||||||||||
|
Home
equity (c) |
1 |
|
— |
|
2 |
|
— |
| |||||||
|
Total
principal deferrals |
$ |
118 |
|
$ |
3 |
|
$ |
147 |
|
$ |
14 |
| |||
|
(a) |
Primarily
loans to real estate developers. |
|
(b) |
Primarily
loans secured by owner-occupied real
estate. |
|
(c) |
Includes
bankruptcy loans for which the court has discharged the borrower's
obligation and the borrower has not reaffirmed the
debt. |
|
(in
millions) |
|
| |||||
|
December 31 |
2017 |
2016 | |||||
|
Automotive
loans: |
|||||||
|
Production |
$ |
1,344 |
|
$ |
1,326 |
| |
|
Dealer |
7,592 |
|
7,123 |
| |||
|
Total
automotive loans |
$ |
8,936 |
|
$ |
8,449 |
| |
|
Total
automotive exposure: |
|||||||
|
Production |
$ |
2,439 |
|
$ |
2,534 |
| |
|
Dealer |
9,405 |
|
8,730 |
| |||
|
Total
automotive exposure |
$ |
11,844 |
|
$ |
11,264 |
| |
|
(in
millions) |
|
| |||||
|
December 31 |
2017 |
2016 | |||||
|
Real
estate construction loans: |
|||||||
|
Commercial
Real Estate business line (a) |
$ |
2,630 |
|
$ |
2,485 |
| |
|
Other
business lines (b) |
331 |
|
384 |
| |||
|
Total
real estate construction loans |
2,961 |
|
2,869 |
| |||
|
Commercial
mortgage loans: |
|||||||
|
Commercial
Real Estate business line (a) |
1,831 |
|
2,018 |
| |||
|
Other
business lines (b) |
7,328 |
|
6,913 |
| |||
|
Total
commercial mortgage loans |
9,159 |
|
8,931 |
| |||
|
Total
commercial real estate loans |
$ |
12,120 |
|
$ |
11,800 |
| |
|
Total
unused commitments on commercial real estate loans |
$ |
3,018 |
|
$ |
3,046 |
| |
|
(a) |
Primarily
loans to real estate developers. |
|
(b) |
Primarily
loans secured by owner-occupied real
estate. |
|
(in
millions) |
|
| |||||
|
December 31 |
2017 |
2016 | |||||
|
Land |
$ |
85 |
|
$ |
86 |
| |
|
Buildings
and improvements |
813 |
|
831 |
| |||
|
Furniture
and equipment |
484 |
|
499 |
| |||
|
Total
cost |
1,382 |
|
1,416 |
| |||
|
Less:
Accumulated depreciation and amortization |
(916 |
) |
(915 |
) | |||
|
Net
book value |
$ |
466 |
|
$ |
501 |
| |
|
(in
millions) |
| ||
|
Years
Ending December 31 |
| ||
|
2018 |
$ |
68 |
|
|
2019 |
61 |
| |
|
2020 |
52 |
| |
|
2021 |
43 |
| |
|
2022 |
32 |
| |
|
Thereafter |
135 |
| |
|
Total |
$ |
391 |
|
|
(in
millions) |
|||||||
|
December
31 |
2017 |
2016 | |||||
|
Business
Bank |
$ |
380 |
|
$ |
380 |
| |
|
Retail
Bank |
194 |
|
194 |
| |||
|
Wealth
Management |
61 |
|
61 |
| |||
|
Total |
$ |
635 |
|
$ |
635 |
| |
|
(in
millions) |
|
| |||||
|
December 31 |
2017 |
2016 | |||||
|
Gross
carrying amount |
$ |
34 |
|
$ |
34 |
| |
|
Accumulated
amortization |
(28 |
) |
(26 |
) | |||
|
Net
carrying amount |
$ |
6 |
|
$ |
8 |
| |
|
(in
millions) |
|||
|
Years
Ending December 31 |
|||
|
2018 |
$ |
2 |
|
|
2019 |
2 |
| |
|
2020 |
1 |
| |
|
2021 |
1 |
| |
|
Total |
$ |
6 |
|
|
|
December 31,
2017 |
December 31,
2016 | |||||||||||||||||||||
|
|
|
Fair
Value |
|
Fair
Value | |||||||||||||||||||
|
(in
millions) |
Notional/
Contract
Amount (a) |
Gross
Derivative Assets |
Gross
Derivative Liabilities |
Notional/
Contract
Amount (a) |
Gross
Derivative Assets |
Gross
Derivative Liabilities | |||||||||||||||||
|
Risk
management purposes |
|||||||||||||||||||||||
|
Derivatives
designated as hedging instruments |
|||||||||||||||||||||||
|
Interest
rate contracts: |
|||||||||||||||||||||||
|
Swaps -
fair value - receive fixed/pay floating
(b) |
$ |
1,775 |
|
$ |
— |
|
$ |
2 |
|
$ |
2,275 |
|
$ |
92 |
|
$ |
4 |
| |||||
|
Derivatives
used as economic hedges |
|||||||||||||||||||||||
|
Foreign
exchange contracts: |
|||||||||||||||||||||||
|
Spot,
forwards and swaps |
650 |
|
— |
|
2 |
|
717 |
|
2 |
|
2 |
| |||||||||||
|
Total
risk management purposes |
2,425 |
|
— |
|
4 |
|
2,992 |
|
94 |
|
6 |
| |||||||||||
|
Customer-initiated
and other activities |
|||||||||||||||||||||||
|
Interest
rate contracts: |
|||||||||||||||||||||||
|
Caps
and floors written |
635 |
|
— |
|
— |
|
436 |
|
— |
|
1 |
| |||||||||||
|
Caps
and floors purchased |
635 |
|
— |
|
— |
|
436 |
|
1 |
|
— |
| |||||||||||
|
Swaps
(b) |
13,119 |
|
57 |
|
57 |
|
12,451 |
|
130 |
|
76 |
| |||||||||||
|
Total
interest rate contracts |
14,389 |
|
57 |
|
57 |
|
13,323 |
|
131 |
|
77 |
| |||||||||||
|
Energy
contracts: |
|||||||||||||||||||||||
|
Caps
and floors written |
164 |
|
— |
|
11 |
|
419 |
|
1 |
|
31 |
| |||||||||||
|
Caps
and floors purchased |
164 |
|
11 |
|
— |
|
419 |
|
31 |
|
1 |
| |||||||||||
|
Swaps |
1,519 |
|
82 |
|
80 |
|
1,389 |
|
114 |
|
112 |
| |||||||||||
|
Total
energy contracts |
1,847 |
|
93 |
|
91 |
|
2,227 |
|
146 |
|
144 |
| |||||||||||
|
Foreign
exchange contracts: |
|||||||||||||||||||||||
|
Spot,
forwards, options and swaps |
1,884 |
|
42 |
|
38 |
|
1,509 |
|
36 |
|
27 |
| |||||||||||
|
Total
customer-initiated and other activities |
18,120 |
|
192 |
|
186 |
|
17,059 |
|
313 |
|
248 |
| |||||||||||
|
Total
gross derivatives |
$ |
20,545 |
|
192 |
|
190 |
|
$ |
20,051 |
|
407 |
|
254 |
| |||||||||
|
Amounts offset in the
consolidated balance sheets: |
|||||||||||||||||||||||
|
Netting adjustment -
Offsetting derivative assets/liabilities |
(49 |
) |
(49 |
) |
(84 |
) |
(84 |
) | |||||||||||||||
|
Netting adjustment - Cash
collateral received/posted |
(1 |
) |
(39 |
) |
(47 |
) |
(45 |
) | |||||||||||||||
|
Net derivatives included in
the consolidated balance sheets (c) |
|
142 |
|
102 |
|
|
|
|
276 |
|
125 |
| |||||||||||
|
Amounts not offset in the
consolidated balance sheets: |
|||||||||||||||||||||||
|
Marketable securities
received/pledged under bilateral collateral agreements |
(3 |
) |
(24 |
) |
(19 |
) |
(8 |
) | |||||||||||||||
|
Net derivatives after
deducting amounts not offset in the consolidated balance
sheets |
|
|
$ |
139 |
|
$ |
78 |
|
|
|
$ |
257 |
|
$ |
117 |
| |||||||
|
(a) |
Notional
or contractual amounts, which represent the extent of involvement in the
derivatives market, are used to determine the contractual cash flows
required in accordance with the terms of the agreement. These amounts are
typically not exchanged, significantly exceed amounts subject to credit or
market risk and are not reflected in the consolidated balance
sheets. |
|
(b) |
Due to
clearinghouse rule changes, beginning January 1, 2017, variation margin
payments are treated as settlements of derivative exposure rather than as
collateral. As a result, these payments are now considered in determining
the fair value of centrally cleared derivatives, resulting in centrally
cleared derivatives having a fair value of approximately
zero. |
|
(c) |
Net
derivative assets are included in “accrued income and other assets” and
net derivative liabilities are included in “accrued expenses and other
liabilities” on the consolidated balance sheets. Included in the fair
value of net derivative assets and net derivative liabilities are credit
valuation adjustments reflecting counterparty credit risk and credit risk
of the Corporation. The fair value of net derivative assets included
credit valuation adjustments for counterparty credit risk of $4
million
and $5
million
at December 31,
2017
and 2016,
respectively. |
|
|
Weighted
Average | ||||||||||
|
(dollar
amounts in millions) |
Notional
Amount |
Remaining
Maturity
(in years) |
Receive Rate |
Pay Rate (a) | |||||||
|
December 31,
2017 |
|||||||||||
|
Swaps
- fair value - receive fixed/pay floating rate |
|||||||||||
|
Medium-
and long-term debt designation |
$ |
1,775 |
|
4.6 |
3.26 |
% |
2.35 |
% | |||
|
December 31,
2016 |
|||||||||||
|
Swaps
- fair value - receive fixed/pay floating rate |
|||||||||||
|
Medium-
and long-term debt designation |
2,275 |
|
4.5 |
3.69 |
|
1.80 |
| ||||
|
(a) |
Variable
rates paid on receive fixed swaps are based on six-month LIBOR rates in
effect at December 31,
2017
and 2016. |
|
(in
millions) |
|||||||||
|
Years
Ended December 31 |
Location
of Gain |
2017 |
2016 | ||||||
|
Interest
rate contracts |
Other
noninterest income |
$ |
24 |
|
$ |
25 |
| ||
|
Energy
contracts |
Other
noninterest income |
2 |
|
2 |
| ||||
|
Foreign
exchange contracts |
Foreign
exchange income |
45 |
|
41 |
| ||||
|
Total |
|
$ |
71 |
|
$ |
68 |
| ||
|
(in
millions) |
|||||||
|
December
31 |
2017 |
2016 | |||||
|
Unused
commitments to extend credit: |
|||||||
|
Commercial
and other |
$ |
22,636 |
|
$ |
24,333 |
| |
|
Bankcard,
revolving check credit and home equity loan commitments |
2,833 |
|
2,658 |
| |||
|
Total
unused commitments to extend credit |
$ |
25,469 |
|
$ |
26,991 |
| |
|
Standby
letters of credit |
$ |
3,228 |
|
$ |
3,623 |
| |
|
Commercial
letters of credit |
39 |
|
46 |
| |||
|
(dollar
amounts in millions) |
December 31,
2017 |
December 31,
2016 | |||||
|
Total
criticized standby and commercial letters of credit |
$ |
88 |
|
$ |
135 |
| |
|
As
a percentage of total outstanding standby and commercial letters of
credit |
2.7 |
% |
3.7 |
% | |||
|
(in
millions) |
|||||||||||
|
Years
Ended December 31 |
2017 |
2016 |
2015 | ||||||||
|
Other
noninterest income: |
|||||||||||
|
Amortization
of other tax credit investments |
$ |
2 |
|
$ |
(1 |
) |
$ |
1 |
| ||
|
Provision
for income taxes: |
|||||||||||
|
Amortization
of LIHTC Investments |
67 |
|
66 |
|
62 |
| |||||
|
Low
income housing tax credits |
(63 |
) |
(62 |
) |
(61 |
) | |||||
|
Other
tax benefits related to tax credit entities |
(24 |
) |
(26 |
) |
(22 |
) | |||||
|
Total
provision for income taxes |
$ |
(20 |
) |
$ |
(22 |
) |
$ |
(21 |
) | ||
|
(in
millions) |
| ||
|
Years
Ending December 31 |
| ||
|
2018 |
$ |
1,855 |
|
|
2019 |
200 |
| |
|
2020 |
66 |
| |
|
2021 |
28 |
| |
|
2022 |
16 |
| |
|
Thereafter |
15 |
| |
|
Total |
$ |
2,180 |
|
|
(in
millions) |
|
| |||||
|
December
31 |
2017 |
2016 | |||||
|
Three
months or less |
$ |
355 |
|
$ |
510 |
| |
|
Over
three months to six months |
207 |
|
322 |
| |||
|
Over
six months to twelve months |
319 |
|
449 |
| |||
|
Over
twelve months |
130 |
|
230 |
| |||
|
Total |
$ |
1,011 |
|
$ |
1,511 |
| |
|
(dollar
amounts in millions) |
Federal Funds Purchased
and Securities Sold Under
Agreements to
Repurchase |
Other
Short-term
Borrowings | |||||
|
December 31,
2017 |
|||||||
|
Amount
outstanding at year-end |
$ |
10 |
|
$ |
— |
| |
|
Weighted
average interest rate at year-end |
1.43 |
% |
— |
% | |||
|
Maximum
month-end balance during the year |
$ |
41 |
|
$ |
1,024 |
| |
|
Average
balance outstanding during the year |
20 |
|
257 |
| |||
|
Weighted
average interest rate during the year |
1.02 |
% |
1.15 |
% | |||
|
December 31,
2016 |
|||||||
|
Amount
outstanding at year-end |
$ |
25 |
|
$ |
— |
| |
|
Weighted
average interest rate at year-end |
0.54 |
% |
— |
% | |||
|
Maximum
month-end balance during the year |
$ |
25 |
|
$ |
501 |
| |
|
Average
balance outstanding during the year |
15 |
|
123 |
| |||
|
Weighted
average interest rate during the year |
0.47 |
% |
0.45 |
% | |||
|
December 31,
2015 |
|||||||
|
Amount
outstanding at year-end |
$ |
23 |
|
$ |
— |
| |
|
Weighted
average interest rate at year-end |
0.38 |
% |
— |
% | |||
|
Maximum
month-end balance during the year |
$ |
109 |
|
$ |
— |
| |
|
Average
balance outstanding during the year |
93 |
|
— |
| |||
|
Weighted
average interest rate during the year |
0.05 |
% |
— |
% | |||
|
(in
millions) |
|||||||
|
December
31 |
2017 |
2016 | |||||
|
Parent
company |
|||||||
|
Subordinated
notes: |
|||||||
|
3.80%
subordinated notes due 2026 (a) |
$ |
255 |
|
$ |
256 |
| |
|
Medium-term
notes: |
|||||||
|
2.125%
notes due 2019 (a) |
347 |
|
348 |
| |||
|
Total
parent company |
602 |
|
604 |
| |||
|
Subsidiaries |
|||||||
|
Subordinated
notes: |
|||||||
|
5.20%
subordinated notes due 2017 (a) |
— |
|
511 |
| |||
|
4.00%
subordinated notes due 2025 (a) |
347 |
|
347 |
| |||
|
7.875%
subordinated notes due 2026 (a) |
208 |
|
215 |
| |||
|
Total
subordinated notes |
555 |
|
1,073 |
| |||
|
Medium-term
notes: |
|||||||
|
2.50%
notes due 2020 (a) |
665 |
|
667 |
| |||
|
FHLB
advances: |
|||||||
|
Floating-rate
based on FHLB auction rate due 2026 |
2,800 |
|
2,800 |
| |||
|
Other
notes: |
|||||||
|
6.0%
- 6.4% fixed-rate notes due 2018 to 2020 |
— |
|
16 |
| |||
|
Total
subsidiaries |
4,020 |
|
4,556 |
| |||
|
Total
medium- and long-term debt |
$ |
4,622 |
|
$ |
5,160 |
| |
|
(a) |
The
fixed interest rates on these notes have been swapped to a variable rate
and designated in a hedging relationship. Accordingly, carrying value has
been adjusted to reflect the change in the fair value of the debt as a
result of changes in the benchmark rate. |
|
(in
millions) |
| ||
|
Years
Ending December 31 |
| ||
|
2018 |
$ |
— |
|
|
2019 |
350 |
| |
|
2020 |
675 |
| |
|
2021 |
— |
| |
|
2022 |
— |
| |
|
Thereafter |
3,550 |
| |
|
Total |
$ |
4,575 |
|
|
(in
millions) |
|||||||||||
|
Years
Ended December 31 |
2017 |
2016 |
2015 | ||||||||
|
Accumulated
net unrealized (losses) gains on investment securities: |
|||||||||||
|
Balance
at beginning of period, net of tax |
$ |
(33 |
) |
$ |
9 |
|
$ |
37 |
| ||
|
Net
unrealized holding losses arising during the period |
(81 |
) |
(70 |
) |
(55 |
) | |||||
|
Less:
Benefit for income taxes |
(27 |
) |
(26 |
) |
(21 |
) | |||||
|
Net
unrealized holding losses arising during the period, net of
tax |
(54 |
) |
|
(44 |
) |
|
(34 |
) | |||
|
Less: |
|||||||||||
|
Net
realized losses included in net securities losses |
— |
|
— |
|
(2 |
) | |||||
|
Less:
Benefit for income taxes |
— |
|
— |
|
(1 |
) | |||||
|
Reclassification
adjustment for net securities losses included in net income, net of
tax |
— |
|
— |
|
(1 |
) | |||||
|
Less: |
|||||||||||
|
Net
losses realized as a yield adjustment in interest on investment
securities |
(3 |
) |
(3 |
) |
(8 |
) | |||||
|
Less: Benefit for income
taxes |
(1 |
) |
(1 |
) |
(3 |
) | |||||
|
Reclassification
adjustment for net losses realized as a yield adjustment included in net
income, net of tax |
(2 |
) |
(2 |
) |
(5 |
) | |||||
|
Change in net unrealized
losses on investment securities, net of tax |
(52 |
) |
(42 |
) |
(28 |
) | |||||
|
Reclassification
of certain deferred tax effects (a) |
(16 |
) |
— |
|
— |
| |||||
|
Balance
at end of period, net of tax |
$ |
(101 |
) |
$ |
(33 |
) |
$ |
9 |
| ||
|
Accumulated
defined benefit pension and other postretirement plans
adjustment: |
|||||||||||
|
Balance
at beginning of period, net of tax |
$ |
(350 |
) |
$ |
(438 |
) |
$ |
(449 |
) | ||
|
Actuarial
gain (loss) arising during the period |
72 |
|
(134 |
) |
(57 |
) | |||||
|
Prior service credit
arising during the period |
— |
|
234 |
|
3 |
| |||||
|
Net
defined benefit pension and other postretirement adjustment arising during
the period |
72 |
|
100 |
|
(54 |
) | |||||
|
Less:
Provision (benefit) for income taxes |
17 |
|
37 |
|
(19 |
) | |||||
|
Net
defined benefit pension and other postretirement adjustment arising during
the period, net of tax |
55 |
|
|
63 |
|
|
(35 |
) | |||
|
Amounts recognized in
salaries and benefits expense: |
|||||||||||
|
Amortization of actuarial
net loss |
51 |
|
46 |
|
70 |
| |||||
|
Amortization of prior
service (credit) cost |
(27 |
) |
(7 |
) |
1 |
| |||||
|
Total
amounts recognized in salaries and benefits expense |
24 |
|
39 |
|
71 |
| |||||
|
Less: Provision for income
taxes |
8 |
|
14 |
|
25 |
| |||||
|
Adjustment for amounts
recognized as components of net periodic benefit cost during the period,
net of tax |
16 |
|
25 |
|
46 |
| |||||
|
Change in defined benefit
pension and other postretirement plans adjustment, net of
tax |
71 |
|
88 |
|
11 |
| |||||
|
Reclassification of certain
deferred tax effects (a)
|
(71 |
) |
— |
|
— |
| |||||
|
Balance
at end of period, net of tax |
$ |
(350 |
) |
$ |
(350 |
) |
$ |
(438 |
) | ||
|
Total
accumulated other comprehensive loss at end of period, net of
tax |
$ |
(451 |
) |
$ |
(383 |
) |
$ |
(429 |
) | ||
|
(a) |
Amounts
reclassified to retained earnings due to early adoption of ASU
2018-02.
For further information, refer to Note 1. |
|
(in
millions, except per share data) |
|||||||||||
|
Years
Ended December 31 |
2017 |
2016 |
2015 | ||||||||
|
Basic
and diluted |
|||||||||||
|
Net
income |
$ |
743 |
|
$ |
477 |
|
$ |
521 |
| ||
|
Less
income allocated to participating securities |
5 |
|
4 |
|
6 |
| |||||
|
Net
income attributable to common shares |
$ |
738 |
|
$ |
473 |
|
$ |
515 |
| ||
|
Basic
average common shares |
174 |
|
172 |
|
176 |
| |||||
|
Basic
net income per common share |
$ |
4.23 |
|
$ |
2.74 |
|
$ |
2.93 |
| ||
|
Basic
average common shares |
174 |
|
172 |
|
176 |
| |||||
|
Dilutive
common stock equivalents: |
|||||||||||
|
Net
effect of the assumed exercise of stock options |
3 |
|
2 |
|
2 |
| |||||
|
Net
effect of the assumed exercise of warrants |
1 |
|
3 |
|
3 |
| |||||
|
Diluted
average common shares |
178 |
|
177 |
|
181 |
| |||||
|
Diluted
net income per common share |
$ |
4.14 |
|
$ |
2.68 |
|
$ |
2.84 |
| ||
|
(shares
in millions) |
|||
|
Years
Ended December 31 |
2016 |
2015 | |
|
Average
outstanding options |
3.3 |
5.1 | |
|
Range
of exercise prices |
$37.26
- $59.86 |
$46.68
- $60.82 | |
|
(in
millions) |
|||||||||||
|
Years
Ended December 31 |
2017 |
2016 |
2015 | ||||||||
|
Total
share-based compensation expense |
$ |
39 |
|
$ |
34 |
|
$ |
38 |
| ||
|
Related
tax benefits recognized in net income |
$ |
14 |
|
$ |
13 |
|
$ |
14 |
| ||
|
(dollar
amounts in millions) |
December 31,
2017 | ||
|
Total
unrecognized share-based compensation expense |
$ |
40 |
|
|
Weighted-average
expected recognition period (in years) |
2.8 |
| |
|
Years
Ended December 31 |
2017 |
2016 |
2015 | ||||||||
|
Weighted-average
grant-date fair value per option |
$ |
19.61 |
|
$ |
9.94 |
|
$ |
11.31 |
| ||
|
Weighted-average
assumptions: |
|||||||||||
|
Risk-free interest
rates |
2.47 |
% |
2.01 |
% |
1.83 |
% | |||||
|
Expected dividend
yield |
3.00 |
|
3.00 |
|
3.00 |
| |||||
|
Expected
volatility factors of the market price of
Comerica
common stock |
34 |
|
38 |
|
33 |
| |||||
|
Expected
option life (in years) |
7.0 |
|
6.9 |
|
6.9 |
| |||||
|
|
|
Weighted-Average |
| ||||||||||
|
|
Number
of
Options
(in thousands) |
Exercise Price
per Share |
Remaining
Contractual
Term
(in years) |
Aggregate
Intrinsic Value
(in millions) | |||||||||
|
Outstanding-January
1, 2017 |
6,892 |
|
$ |
37.24 |
|
||||||||
|
Granted |
430 |
|
67.67 |
|
|||||||||
|
Forfeited
or expired |
(57 |
) |
48.74 |
|
|||||||||
|
Exercised |
(3,092 |
) |
37.45 |
|
|||||||||
|
Outstanding-December
31, 2017 |
4,173 |
|
40.06 |
|
5.9 |
|
$ |
195 |
| ||||
|
Exercisable-December
31, 2017 |
2,347 |
|
$ |
36.27 |
|
4.3 |
|
$ |
119 |
| |||
|
Number of
Shares
(in thousands) |
Weighted-Average
Grant-Date
Fair
Value per Share | |||||
|
Outstanding-January
1, 2017 |
1,591 |
|
$ |
37.20 |
| |
|
Granted |
237 |
|
67.83 |
| ||
|
Forfeited |
(59 |
) |
42.53 |
| ||
|
Vested |
(526 |
) |
35.28 |
| ||
|
Outstanding-December
31, 2017 |
1,243 |
|
$ |
43.59 |
| |
|
Service-Based
Units |
Performance-Based
Units | ||||||||||||
|
Number of
Units
(in thousands) |
Weighted-Average
Grant-Date
Fair
Value per Share |
Number of
Units
(in thousands) |
Weighted-Average
Grant-Date
Fair
Value per Share | ||||||||||
|
Outstanding-January
1, 2017 |
180 |
|
$ |
39.61 |
|
781 |
|
$ |
39.47 |
| |||
|
Granted |
19 |
|
75.06 |
|
149 |
|
66.07 |
| |||||
|
Vested |
— |
|
— |
|
(212 |
) |
48.32 |
| |||||
|
Outstanding-December
31, 2017 |
199 |
|
43.00 |
|
718 |
|
42.39 |
| |||||
|
Defined
Benefit Pension Plans |
|||||||||||||||||||||||||
|
Qualified |
Non-Qualified |
Postretirement
Benefit Plan | |||||||||||||||||||||||
|
(dollar
amounts in millions) |
2017 |
2016 |
2017 |
2016 |
2017 |
2016 | |||||||||||||||||||
|
Change
in fair value of plan assets: |
|||||||||||||||||||||||||
|
Fair
value of plan assets at January 1 |
$ |
2,453 |
|
$ |
2,346 |
|
$ |
— |
|
$ |
— |
|
$ |
62 |
|
$ |
61 |
| |||||||
|
Actual
return on plan assets |
396 |
|
200 |
|
— |
|
— |
|
2 |
|
2 |
| |||||||||||||
|
Employer
contributions |
— |
|
— |
|
— |
|
— |
|
1 |
|
4 |
| |||||||||||||
|
Benefits
paid |
(102 |
) |
(93 |
) |
— |
|
— |
|
(5 |
) |
(5 |
) | |||||||||||||
|
Fair
value of plan assets at December 31 |
$ |
2,747 |
|
$ |
2,453 |
|
$ |
— |
|
$ |
— |
|
$ |
60 |
|
$ |
62 |
| |||||||
|
Change
in projected benefit obligation: |
|||||||||||||||||||||||||
|
Projected
benefit obligation at January 1 |
$ |
1,902 |
|
$ |
1,916 |
|
$ |
201 |
|
$ |
222 |
|
$ |
55 |
|
$ |
59 |
| |||||||
|
Service
cost |
29 |
|
31 |
|
2 |
|
3 |
|
— |
|
— |
| |||||||||||||
|
Interest
cost |
78 |
|
87 |
|
8 |
|
10 |
|
2 |
|
3 |
| |||||||||||||
|
Actuarial
loss (gain) |
154 |
|
161 |
|
12 |
|
11 |
|
(1 |
) |
(2 |
) | |||||||||||||
|
Benefits
paid |
(102 |
) |
(93 |
) |
(11 |
) |
(11 |
) |
(5 |
) |
(5 |
) | |||||||||||||
|
Plan
change |
— |
|
(200 |
) |
— |
|
(34 |
) |
— |
|
— |
| |||||||||||||
|
Projected
benefit obligation at December 31 |
$ |
2,061 |
|
$ |
1,902 |
|
$ |
212 |
|
$ |
201 |
|
$ |
51 |
|
$ |
55 |
| |||||||
|
Accumulated
benefit obligation |
$ |
2,052 |
|
$ |
1,894 |
|
$ |
209 |
|
$ |
198 |
|
$ |
51 |
|
$ |
55 |
| |||||||
|
Funded
status at December 31 (a) (b) |
$ |
686 |
|
$ |
551 |
|
$ |
(212 |
) |
$ |
(201 |
) |
$ |
9 |
|
$ |
7 |
| |||||||
|
Weighted-average
assumptions used: |
|||||||||||||||||||||||||
|
Discount
rate |
3.74 |
% |
4.23 |
% |
3.74 |
% |
4.23 |
% |
3.55 |
% |
3.92 |
% | |||||||||||||
|
Rate
of compensation increase |
3.75 |
|
3.50 |
|
3.75 |
|
3.50 |
|
n/a |
|
n/a |
| |||||||||||||
|
Healthcare
cost trend rate: |
|||||||||||||||||||||||||
|
Cost
trend rate assumed for next year |
n/a |
|
n/a |
|
n/a |
|
n/a |
|
6.50 |
|
6.50 |
| |||||||||||||
|
Rate to which the cost
trend rate is assumed to decline (the ultimate trend rate) |
n/a |
|
n/a |
|
n/a |
|
n/a |
|
4.50 |
|
5.00 |
| |||||||||||||
|
Year when rate reaches the
ultimate trend rate |
n/a |
|
n/a |
|
n/a |
|
n/a |
|
2027 |
|
2027 |
| |||||||||||||
|
Amounts recognized in
accumulated other comprehensive income (loss) before income
taxes: |
|||||||||||||||||||||||||
|
Net
actuarial loss |
$ |
(548 |
) |
$ |
(673 |
) |
$ |
(85 |
) |
$ |
(82 |
) |
$ |
(19 |
) |
$ |
(20 |
) | |||||||
|
Prior
service credit |
159 |
|
178 |
|
42 |
|
50 |
|
1 |
|
1 |
| |||||||||||||
|
Balance
at December 31 |
$ |
(389 |
) |
$ |
(495 |
) |
$ |
(43 |
) |
$ |
(32 |
) |
$ |
(18 |
) |
$ |
(19 |
) | |||||||
|
(a) |
Based on
projected benefit obligation for defined benefit pension plans and
accumulated benefit obligation for postretirement benefit
plan. |
|
(b) |
The
Corporation recognizes the overfunded and underfunded status of the plans
in “accrued income and other assets” and “accrued expenses and other
liabilities,” respectively, on the consolidated balance
sheets. |
|
Defined
Benefit Pension Plans |
| ||||||||||||||
|
(in
millions) |
Qualified |
Non-Qualified |
Postretirement
Benefit Plan |
Total | |||||||||||
|
Actuarial
gain (loss) arising during the period |
$ |
82 |
|
$ |
(11 |
) |
$ |
1 |
|
$ |
72 |
| |||
|
Amortization
of net actuarial loss |
43 |
|
8 |
|
— |
|
51 |
| |||||||
|
Amortization
of prior service credit |
(19 |
) |
(8 |
) |
— |
|
(27 |
) | |||||||
|
Total
recognized in other comprehensive income (loss) |
$ |
106 |
|
$ |
(11 |
) |
$ |
1 |
|
$ |
96 |
| |||
|
|
Defined
Benefit Pension Plans | ||||||||||||||||||||||
|
(dollar
amounts in millions) |
Qualified |
Non-Qualified | |||||||||||||||||||||
|
Years
Ended December 31 |
2017 |
2016 |
2015 |
2017 |
2016 |
2015 | |||||||||||||||||
|
Service
cost |
$ |
29 |
|
$ |
31 |
|
$ |
35 |
|
$ |
2 |
|
$ |
3 |
|
$ |
4 |
| |||||
|
Interest
cost |
78 |
|
87 |
|
88 |
|
8 |
|
10 |
|
10 |
| |||||||||||
|
Expected
return on plan assets |
(159 |
) |
(163 |
) |
(159 |
) |
— |
|
— |
|
— |
| |||||||||||
|
Amortization
of prior service (credit) cost |
(19 |
) |
(2 |
) |
4 |
|
(8 |
) |
(5 |
) |
(4 |
) | |||||||||||
|
Amortization
of net loss |
43 |
|
38 |
|
59 |
|
8 |
|
7 |
|
10 |
| |||||||||||
|
Net
periodic defined benefit (credit) cost |
$ |
(28 |
) |
$ |
(9 |
) |
$ |
27 |
|
$ |
10 |
|
$ |
15 |
|
$ |
20 |
| |||||
|
Actual
return on plan assets |
$ |
396 |
|
$ |
200 |
|
$ |
(73 |
) |
n/a |
|
n/a |
|
n/a |
| ||||||||
|
Actual
rate of return on plan assets |
16.48 |
% |
8.66 |
% |
(2.95 |
)% |
n/a |
|
n/a |
|
n/a |
| |||||||||||
|
Weighted-average
assumptions used: |
|||||||||||||||||||||||
|
Discount
rate |
4.23 |
% |
4.53 |
% |
4.28 |
% |
4.23 |
% |
4.53 |
% |
4.28 |
% | |||||||||||
|
Expected
long-term return on plan assets |
6.50 |
|
6.75 |
|
6.75 |
|
n/a |
|
n/a |
|
n/a |
| |||||||||||
|
Rate
of compensation increase |
3.50 |
|
3.75 |
|
3.75 |
|
3.50 |
|
3.75 |
|
3.75 |
| |||||||||||
|
(dollar
amounts in millions) |
Postretirement Benefit Plan | ||||||||||
|
Years
Ended December 31 |
2017 |
2016 |
2015 | ||||||||
|
Interest
cost |
$ |
2 |
|
$ |
3 |
|
$ |
3 |
| ||
|
Expected
return on plan assets |
(3 |
) |
(4 |
) |
(4 |
) | |||||
|
Amortization
of prior service cost |
— |
|
— |
|
1 |
| |||||
|
Amortization
of net loss |
1 |
|
1 |
|
1 |
| |||||
|
Net
periodic postretirement benefit cost |
$ |
— |
|
$ |
— |
|
$ |
1 |
| ||
|
Actual
return on plan assets |
$ |
2 |
|
$ |
2 |
|
$ |
— |
| ||
|
Actual
rate of return on plan assets |
3.52 |
% |
2.83 |
% |
(0.53 |
)% | |||||
|
Weighted-average
assumptions used: |
|||||||||||
|
Discount
rate |
3.92 |
% |
4.53 |
% |
3.99 |
% | |||||
|
Expected
long-term return on plan assets |
5.00 |
|
5.00 |
|
5.00 |
| |||||
|
Healthcare
cost trend rate: |
|||||||||||
|
Cost
trend rate assumed |
6.50 |
|
7.00 |
|
7.00 |
| |||||
|
Rate
to which the cost trend rate is assumed to decline (the ultimate trend
rate) |
4.50 |
|
5.00 |
|
5.00 |
| |||||
|
Year
that the rate reaches the ultimate trend rate |
2027 |
|
2027 |
|
2026 |
| |||||
|
|
Defined Benefit Pension Plans |
||||||||||||||
|
(in
millions) |
Qualified |
Non-Qualified |
Postretirement
Benefit
Plan |
Total | |||||||||||
|
Net
loss |
$ |
51 |
|
$ |
8 |
|
$ |
1 |
|
$ |
60 |
| |||
|
Prior
service credit |
(19 |
) |
(8 |
) |
— |
|
(27 |
) | |||||||
|
One-Percentage-Point | |||||||
|
(in
millions) |
Increase |
Decrease | |||||
|
Effect
on postretirement benefit obligation |
$ |
3 |
|
$ |
(2 |
) | |
|
Effect
on total service and interest cost |
— |
|
— |
| |||
|
(in
millions) |
Total |
Level 1 |
Level 2 |
Level 3 | |||||||||||
|
December 31,
2017 |
|||||||||||||||
|
Equity
securities: |
|||||||||||||||
|
Mutual
funds |
$ |
1 |
|
$ |
1 |
|
$ |
— |
|
$ |
— |
| |||
|
Common
stock |
961 |
|
961 |
|
— |
|
— |
| |||||||
|
Fixed
income securities: |
|||||||||||||||
|
U.S.
Treasury and other U.S. government agency securities |
456 |
|
451 |
|
5 |
|
— |
| |||||||
|
Corporate
and municipal bonds and notes |
765 |
|
— |
|
765 |
|
— |
| |||||||
|
Mortgage-backed
securities |
25 |
|
— |
|
25 |
|
— |
| |||||||
|
Private
placements |
80 |
|
— |
|
— |
|
80 |
| |||||||
|
Total
investments in the fair value hierarchy |
2,288 |
|
|
$ |
1,413 |
|
|
$ |
795 |
|
|
$ |
80 |
| |
|
Investments
measured at net asset value: |
|||||||||||||||
|
Collective
investment funds |
455 |
|
|
|
|
|
|
| |||||||
|
Total
investments at fair value |
$ |
2,743 |
|
|
|
|
|
|
| ||||||
|
December 31,
2016 |
|||||||||||||||
|
Cash
equivalent securities: |
|||||||||||||||
|
Commercial
paper |
$ |
2 |
|
$ |
— |
|
$ |
2 |
|
$ |
— |
| |||
|
Common
stock |
850 |
|
850 |
|
— |
|
— |
| |||||||
|
Fixed
income securities: |
|||||||||||||||
|
U.S.
Treasury and other U.S. government agency securities |
377 |
|
366 |
|
11 |
|
— |
| |||||||
|
Corporate
and municipal bonds and notes |
710 |
|
— |
|
710 |
|
— |
| |||||||
|
Mortgage-backed
securities |
23 |
|
— |
|
23 |
|
— |
| |||||||
|
Private
placements |
71 |
|
— |
|
— |
|
71 |
| |||||||
|
Total
investments in the fair value hierarchy |
2,033 |
|
$ |
1,216 |
|
$ |
746 |
|
$ |
71 |
| ||||
|
Investments
measured at net asset value: |
|||||||||||||||
|
Collective
investment funds |
415 |
|
|||||||||||||
|
Total
investments at fair value |
$ |
2,448 |
|
||||||||||||
|
Balance at
Beginning
of
Period |
Balance at
End of Period | ||||||||||||||||||||||
|
Net
Gains (Losses) |
|||||||||||||||||||||||
|
(in
millions) |
Realized |
Unrealized |
Purchases |
Sales |
|||||||||||||||||||
|
Year
Ended December 31, 2017 |
|||||||||||||||||||||||
|
Private
placements |
$ |
71 |
|
$ |
2 |
|
$ |
3 |
|
$ |
77 |
|
$ |
(73 |
) |
$ |
80 |
| |||||
|
Year
Ended December 31, 2016 |
|||||||||||||||||||||||
|
Private
placements |
$ |
105 |
|
$ |
1 |
|
$ |
3 |
|
$ |
64 |
|
$ |
(102 |
) |
$ |
71 |
| |||||
|
Estimated
Future Benefit Payments | |||||||||||
|
(in
millions)
Years
Ended December 31 |
Qualified
Defined Benefit
Pension
Plan |
Non-Qualified
Defined Benefit
Pension
Plan |
Postretirement
Benefit Plan (a) | ||||||||
|
2018 |
$ |
120 |
|
$ |
11 |
|
$ |
6 |
| ||
|
2019 |
123 |
|
12 |
|
5 |
| |||||
|
2020 |
125 |
|
13 |
|
5 |
| |||||
|
2021 |
127 |
|
13 |
|
5 |
| |||||
|
2022 |
130 |
|
13 |
|
5 |
| |||||
|
2023
- 2027 |
665 |
|
66 |
|
19 |
| |||||
|
(a) |
Estimated
benefit payments in the postretirement benefit plan are net of estimated
Medicare subsidies. |
|
(in
millions) |
|
|
| ||||||||
|
December
31 |
2017 |
2016 |
2015 | ||||||||
|
Current: |
|||||||||||
|
Federal |
$ |
371 |
|
$ |
224 |
|
$ |
275 |
| ||
|
Foreign |
5 |
|
5 |
|
5 |
| |||||
|
State
and local |
36 |
|
15 |
|
20 |
| |||||
|
Total
current |
412 |
|
244 |
|
300 |
| |||||
|
Deferred: |
|||||||||||
|
Federal |
(26 |
) |
(49 |
) |
(68 |
) | |||||
|
State
and local |
(2 |
) |
(2 |
) |
(3 |
) | |||||
|
Remeasurement
of deferred taxes |
107 |
|
— |
|
— |
| |||||
|
Total
deferred |
79 |
|
(51 |
) |
(71 |
) | |||||
|
Total |
$ |
491 |
|
$ |
193 |
|
$ |
229 |
| ||
|
(dollar
amounts in millions) |
2017 |
2016 |
2015 | |||||||||||||||||
|
Years
Ended December 31 |
Amount |
Rate |
Amount |
Rate |
Amount |
Rate | ||||||||||||||
|
Tax
based on federal statutory rate |
$ |
432 |
|
35.0 |
% |
$ |
235 |
|
35.0 |
% |
$ |
262 |
|
35.0 |
% | |||||
|
Remeasurement
of deferred taxes |
107 |
|
8.7 |
|
— |
|
— |
|
— |
|
— |
| ||||||||
|
State
income taxes |
22 |
|
1.8 |
|
8 |
|
1.2 |
|
10 |
|
1.3 |
| ||||||||
|
Employee
stock transactions |
(35 |
) |
(2.8 |
) |
— |
|
— |
|
— |
|
— |
| ||||||||
|
Affordable
housing and historic credits |
(21 |
) |
(1.7 |
) |
(22 |
) |
(3.3 |
) |
(22 |
) |
(2.9 |
) | ||||||||
|
Bank-owned
life insurance |
(16 |
) |
(1.3 |
) |
(15 |
) |
(2.3 |
) |
(15 |
) |
(2.0 |
) | ||||||||
|
Lease
termination transactions |
(2 |
) |
(0.2 |
) |
(15 |
) |
(2.2 |
) |
(5 |
) |
(0.7 |
) | ||||||||
|
Tax-related
interest and penalties |
4 |
|
0.3 |
|
3 |
|
0.5 |
|
1 |
|
0.1 |
| ||||||||
|
Other |
— |
|
— |
|
(1 |
) |
(0.1 |
) |
(2 |
) |
(0.3 |
) | ||||||||
|
Provision
for income taxes |
$ |
491 |
|
39.8 |
% |
$ |
193 |
|
28.8 |
% |
$ |
229 |
|
30.5 |
% | |||||
|
(in
millions) |
2017 |
2016 |
2015 | ||||||||
|
Balance
at January 1 |
$ |
15 |
|
$ |
22 |
|
$ |
14 |
| ||
|
Increase
as a result of tax positions taken during a prior period |
4 |
|
— |
|
8 |
| |||||
|
Decrease
related to settlements with tax authorities |
(8 |
) |
(7 |
) |
— |
| |||||
|
Other |
(1 |
) |
— |
|
— |
| |||||
|
Balance
at December 31 |
$ |
10 |
|
$ |
15 |
|
$ |
22 |
| ||
|
Jurisdiction |
Tax
Years |
|
Federal |
2014-2016 |
|
California |
2005-2016 |
|
(in
millions) |
|
| |||||
|
December
31 |
2017 |
2016 | |||||
|
Deferred
tax assets: |
|||||||
|
Allowance
for loan losses |
$ |
150 |
|
$ |
256 |
| |
|
Deferred
compensation |
49 |
|
91 |
| |||
|
Deferred
loan origination fees and costs |
6 |
|
20 |
| |||
|
Net
unrealized losses on investment securities
available-for-sale |
31 |
|
20 |
| |||
|
Other
temporary differences, net |
57 |
|
76 |
| |||
|
Total
deferred tax asset before valuation allowance |
293 |
|
463 |
| |||
|
Valuation
allowance |
(3 |
) |
(3 |
) | |||
|
Total
deferred tax assets |
290 |
|
460 |
| |||
|
Deferred
tax liabilities: |
|||||||
|
Lease
financing transactions |
(76 |
) |
(150 |
) | |||
|
Defined
benefit plans |
(72 |
) |
(82 |
) | |||
|
Allowance
for depreciation |
(1 |
) |
(11 |
) | |||
|
Total
deferred tax liabilities |
(149 |
) |
(243 |
) | |||
|
Net
deferred tax asset |
$ |
141 |
|
$ |
217 |
| |
|
(dollar
amounts in millions) |
Comerica
Incorporated
(Consolidated) |
Comerica
Bank | |||||
|
December 31,
2017 |
|||||||
|
CET1
capital (minimum $3.0 billion (Consolidated)) |
$ |
7,773 |
|
$ |
7,121 |
| |
|
Tier
1 capital (minimum-$4.0 billion (Consolidated)) |
7,773 |
|
7,121 |
| |||
|
Total
capital (minimum-$5.3 billion (Consolidated)) |
9,211 |
|
8,378 |
| |||
|
Risk-weighted
assets |
66,575 |
|
66,447 |
| |||
|
Average
assets (fourth quarter) |
71,372 |
|
71,181 |
| |||
|
CET1
capital to risk-weighted assets (minimum-4.5%) |
11.68 |
% |
10.72 |
% | |||
|
Tier
1 capital to risk-weighted assets (minimum-6.0%) |
11.68 |
|
10.72 |
| |||
|
Total
capital to risk-weighted assets (minimum-8.0%) |
13.84 |
|
12.61 |
| |||
|
Tier
1 capital to average assets (minimum-4.0%) |
10.89 |
|
10.00 |
| |||
|
Capital
conservation buffer |
5.68 |
|
4.61 |
| |||
|
December 31,
2016 |
|||||||
|
CET1
capital (minimum $3.1 billion (Consolidated)) |
$ |
7,540 |
|
$ |
7,120 |
| |
|
Tier
1 capital (minimum-$4.1 billion (Consolidated)) |
7,540 |
|
7,120 |
| |||
|
Total
capital (minimum-$5.4 billion (Consolidated)) |
9,018 |
|
8,397 |
| |||
|
Risk-weighted
assets |
67,966 |
|
67,739 |
| |||
|
Average
assets (fourth quarter) |
74,086 |
|
73,804 |
| |||
|
CET1
capital to risk-weighted assets (minimum-4.5%) |
11.09 |
% |
10.51 |
% | |||
|
Tier
1 capital to risk-weighted assets (minimum-6.0%) |
11.09 |
|
10.51 |
| |||
|
Total
capital to risk-weighted assets (minimum-8.0%) |
13.27 |
|
12.40 |
| |||
|
Tier
1 capital to average assets (minimum-4.0%) |
10.18 |
|
9.65 |
| |||
|
Capital
conservation buffer |
5.09 |
|
4.40 |
| |||
|
• |
Employee
costs:
Primarily severance costs in accordance with the Corporation’s severance
plan. |
|
• |
Facilities
costs: Costs
pertaining to consolidating banking centers and other facilities, such as
lease termination costs and decommissioning costs. Also includes
accelerated depreciation and impairment of owned property to be
sold. |
|
• |
Technology
costs:
Impairment and other costs associated with optimizing technology
infrastructure and reducing the number of
applications. |
|
• |
Other
costs:
Includes primarily professional fees, as well as other contract
termination fees and legal fees incurred in the execution of the
initiative. |
|
(in
millions) |
Employee
Costs |
Facilities
Costs |
Technology
Costs |
Other
Costs |
Total | ||||||||||||||
|
Year
Ended December 31, 2017 |
|||||||||||||||||||
|
Balance
at beginning of period |
$ |
10 |
|
$ |
4 |
|
$ |
— |
|
$ |
4 |
|
$ |
18 |
| ||||
|
Restructuring
charges |
10 |
|
2 |
|
26 |
|
7 |
|
45 |
| |||||||||
|
Payments |
(12 |
) |
(6 |
) |
(15 |
) |
(10 |
) |
(43 |
) | |||||||||
|
Adjustments for non-cash
charges (a) |
— |
|
— |
|
(5 |
) |
— |
|
(5 |
) | |||||||||
|
Balance
at end of period |
$ |
8 |
|
$ |
— |
|
$ |
6 |
|
$ |
1 |
|
$ |
15 |
| ||||
|
Year
Ended December 31, 2016 |
|||||||||||||||||||
|
Balance at beginning of
period |
$ |
— |
|
$ |
— |
|
$ |
— |
|
$ |
— |
|
$ |
— |
| ||||
|
Restructuring
charges |
52 |
|
15 |
|
— |
|
26 |
|
93 |
| |||||||||
|
Payments |
(44 |
) |
(6 |
) |
— |
|
(22 |
) |
(72 |
) | |||||||||
|
Adjustments for non-cash
charges (a) |
2 |
|
(5 |
) |
— |
|
— |
|
(3 |
) | |||||||||
|
Balance at end of
period |
$ |
10 |
|
$ |
4 |
|
$ |
— |
|
$ |
4 |
|
$ |
18 |
| ||||
|
Total restructuring charges
incurred to date |
$ |
62 |
|
$ |
17 |
|
$ |
26 |
|
$ |
33 |
|
$ |
138 |
| ||||
|
Total expected restructuring
charges (b) |
70 |
|
20
- 25 |
|
60
- 65 |
|
35 |
|
185
- 195 |
| |||||||||
|
(a) |
Adjustments
for non-cash charges primarily include the benefit from forfeitures of
nonvested stock compensation in Employee Costs, accelerated depreciation
expense in Facilities Costs and impairments of previously capitalized
software costs in Technology Costs. |
|
(b) |
Restructuring
activities are expected to be substantially completed by 12/31/2018. |
|
(dollar
amounts in millions) |
Business
Bank |
Retail
Bank |
Wealth
Management |
Finance |
Other |
Total | |||||||||||||||||
|
Year
Ended December 31, 2017 | |||||||||||||||||||||||
|
Earnings
summary: |
|||||||||||||||||||||||
|
Net
interest income (expense) |
$ |
1,372 |
|
$ |
658 |
|
$ |
170 |
|
$ |
(175 |
) |
$ |
36 |
|
$ |
2,061 |
| |||||
|
Provision
for credit losses |
58 |
|
13 |
|
1 |
|
— |
|
2 |
|
74 |
| |||||||||||
|
Noninterest
income |
601 |
|
193 |
|
255 |
|
48 |
|
10 |
|
1,107 |
| |||||||||||
|
Noninterest
expenses |
802 |
|
731 |
|
285 |
|
(4 |
) |
46 |
|
1,860 |
| |||||||||||
|
Provision
(benefit) for income taxes |
389 |
|
39 |
|
51 |
|
(58 |
) |
70 |
|
(a) |
491 |
| ||||||||||
|
Net
income (loss) |
$ |
724 |
|
$ |
68 |
|
$ |
88 |
|
$ |
(65 |
) |
$ |
(72 |
) |
$ |
743 |
| |||||
|
Net
credit-related charge-offs (recoveries) |
$ |
82 |
|
$ |
15 |
|
$ |
(5 |
) |
$ |
— |
|
$ |
— |
|
$ |
92 |
| |||||
|
Selected
average balances: |
|||||||||||||||||||||||
|
Assets |
$ |
38,801 |
|
$ |
6,478 |
|
$ |
5,401 |
|
$ |
13,954 |
|
$ |
6,818 |
|
$ |
71,452 |
| |||||
|
Loans |
37,445 |
|
5,857 |
|
5,256 |
|
— |
|
— |
|
48,558 |
| |||||||||||
|
Deposits |
28,803 |
|
23,971 |
|
4,081 |
|
241 |
|
162 |
|
57,258 |
| |||||||||||
|
Statistical
data: |
|||||||||||||||||||||||
|
Return
on average assets (b) |
1.87 |
% |
0.28 |
% |
1.63 |
% |
N/M |
|
N/M |
|
1.04 |
% | |||||||||||
|
Efficiency
ratio (c) |
40.61 |
|
85.54 |
|
66.84 |
|
N/M |
|
N/M |
|
58.57 |
| |||||||||||
|
(dollar
amounts in millions) |
Business
Bank |
Retail
Bank |
Wealth
Management |
Finance |
Other |
Total | |||||||||||||||||
|
Year
Ended December 31, 2016 | |||||||||||||||||||||||
|
Earnings
summary: |
|||||||||||||||||||||||
|
Net
interest income (expense) |
$ |
1,417 |
|
$ |
618 |
|
$ |
167 |
|
$ |
(428 |
) |
$ |
23 |
|
$ |
1,797 |
| |||||
|
Provision
for credit losses |
217 |
|
35 |
|
(4 |
) |
— |
|
— |
|
248 |
| |||||||||||
|
Noninterest
income |
572 |
|
189 |
|
243 |
|
43 |
|
4 |
|
1,051 |
| |||||||||||
|
Noninterest
expenses |
839 |
|
767 |
|
301 |
|
(4 |
) |
27 |
|
1,930 |
| |||||||||||
|
Provision
(benefit) for income taxes |
295 |
|
1 |
|
39 |
|
(142 |
) |
— |
|
193 |
| |||||||||||
|
Net
income (loss) |
$ |
638 |
|
$ |
4 |
|
$ |
74 |
|
$ |
(239 |
) |
$ |
— |
|
$ |
477 |
| |||||
|
Net
credit-related charge-offs |
$ |
145 |
|
$ |
12 |
|
$ |
— |
|
$ |
— |
|
$ |
— |
|
$ |
157 |
| |||||
|
Selected
average balances: |
|||||||||||||||||||||||
|
Assets |
$ |
39,497 |
|
$ |
6,551 |
|
$ |
5,232 |
|
$ |
13,993 |
|
$ |
6,470 |
|
$ |
71,743 |
| |||||
|
Loans |
38,067 |
|
5,881 |
|
5,048 |
|
— |
|
— |
|
48,996 |
| |||||||||||
|
Deposits |
29,704 |
|
23,558 |
|
4,126 |
|
88 |
|
265 |
|
57,741 |
| |||||||||||
|
Statistical
data: |
|||||||||||||||||||||||
|
Return
on average assets (b) |
1.61 |
% |
0.02 |
% |
1.42 |
% |
N/M |
|
N/M |
|
0.67 |
% | |||||||||||
|
Efficiency
ratio (c) |
42.11 |
|
94.35 |
|
73.48 |
|
N/M |
|
N/M |
|
67.53 |
| |||||||||||
|
(dollar
amounts in millions) |
Business
Bank |
Retail
Bank |
Wealth
Management |
Finance |
Other |
Total | |||||||||||||||||
|
Year
Ended December 31, 2015 | |||||||||||||||||||||||
|
Earnings
summary: |
|||||||||||||||||||||||
|
Net
interest income (expense) |
$ |
1,497 |
|
$ |
623 |
|
$ |
177 |
|
$ |
(623 |
) |
$ |
15 |
|
$ |
1,689 |
| |||||
|
Provision
for credit losses |
158 |
|
8 |
|
(20 |
) |
— |
|
1 |
|
147 |
| |||||||||||
|
Noninterest
income |
571 |
|
185 |
|
235 |
|
44 |
|
— |
|
1,035 |
| |||||||||||
|
Noninterest
expenses |
778 |
|
734 |
|
305 |
|
(4 |
) |
14 |
|
1,827 |
| |||||||||||
|
Provision
(benefit) for income taxes |
371 |
|
21 |
|
43 |
|
(206 |
) |
— |
|
229 |
| |||||||||||
|
Net
income (loss) |
$ |
761 |
|
$ |
45 |
|
$ |
84 |
|
$ |
(369 |
) |
$ |
— |
|
$ |
521 |
| |||||
|
Net
credit-related charge-offs (recoveries) |
$ |
89 |
|
$ |
29 |
|
$ |
(17 |
) |
$ |
— |
|
$ |
— |
|
$ |
101 |
| |||||
|
Selected
average balances: |
|||||||||||||||||||||||
|
Assets |
$ |
39,501 |
|
$ |
6,474 |
|
$ |
5,153 |
|
$ |
11,764 |
|
$ |
7,355 |
|
$ |
70,247 |
| |||||
|
Loans |
37,889 |
|
5,792 |
|
4,953 |
|
— |
|
(6 |
) |
48,628 |
| |||||||||||
|
Deposits |
30,894 |
|
22,876 |
|
4,151 |
|
138 |
|
267 |
|
58,326 |
| |||||||||||
|
Statistical
data: |
|||||||||||||||||||||||
|
Return
on average assets (b) |
1.93 |
% |
0.19 |
% |
1.62 |
% |
N/M |
|
N/M |
|
0.74 |
% | |||||||||||
|
Efficiency
ratio (c) |
37.59 |
|
90.64 |
|
73.68 |
|
N/M |
|
N/M |
|
66.93 |
| |||||||||||
|
(a) |
Included
a $107
million
charge to adjust deferred taxes as a result of the enactment of the Tax
Cuts and Jobs Act and a $35
million
tax benefit from employee stock
transactions. |
|
(b) |
Return
on average assets is calculated based on the greater of average assets or
average liabilities and attributed
equity. |
|
(c) |
Noninterest
expenses as a percentage of the sum of net interest income (fully taxable
equivalent basis) and noninterest income excluding net securities
gains. |
|
(dollar
amounts in millions) |
Michigan |
California |
Texas |
Other
Markets |
Finance
& Other |
Total | |||||||||||||||||
|
Year
Ended December 31, 2017 | |||||||||||||||||||||||
|
Earnings
summary: |
|||||||||||||||||||||||
|
Net interest income
(expense) |
$ |
685 |
|
$ |
719 |
|
$ |
465 |
|
$ |
331 |
|
$ |
(139 |
) |
$ |
2,061 |
| |||||
|
Provision
for credit losses |
8 |
|
100 |
|
(72 |
) |
36 |
|
2 |
|
74 |
| |||||||||||
|
Noninterest
income |
324 |
|
171 |
|
131 |
|
423 |
|
58 |
|
1,107 |
| |||||||||||
|
Noninterest
expenses |
590 |
|
404 |
|
375 |
|
449 |
|
42 |
|
1,860 |
| |||||||||||
|
Provision (benefit) for
income taxes |
147 |
|
148 |
|
109 |
|
75 |
|
12 |
|
(a) |
491 |
| ||||||||||
|
Net
income (loss) |
$ |
264 |
|
$ |
238 |
|
$ |
184 |
|
$ |
194 |
|
$ |
(137 |
) |
$ |
743 |
| |||||
|
Net
credit-related (recoveries) charge-offs |
$ |
(1 |
) |
$ |
33 |
|
$ |
46 |
|
$ |
14 |
|
$ |
— |
|
$ |
92 |
| |||||
|
Selected
average balances: |
|||||||||||||||||||||||
|
Assets |
$ |
13,395 |
|
$ |
18,269 |
|
$ |
10,443 |
|
$ |
8,573 |
|
$ |
20,772 |
|
$ |
71,452 |
| |||||
|
Loans |
12,677 |
|
18,008 |
|
9,969 |
|
7,904 |
|
— |
|
48,558 |
| |||||||||||
|
Deposits |
21,823 |
|
17,533 |
|
9,625 |
|
7,874 |
|
403 |
|
57,258 |
| |||||||||||
|
Statistical
data: |
|||||||||||||||||||||||
|
Return
on average assets (b) |
1.17 |
% |
1.29 |
% |
1.69 |
% |
2.25 |
% |
N/M |
|
1.04 |
% | |||||||||||
|
Efficiency
ratio (c) |
58.30 |
|
45.26 |
|
62.80 |
|
59.57 |
|
N/M |
|
58.57 |
| |||||||||||
|
(dollar
amounts in millions) |
Michigan |
California |
Texas |
Other
Markets |
Finance
& Other |
Total | |||||||||||||||||
|
Year
Ended December 31, 2016 | |||||||||||||||||||||||
|
Earnings
summary: |
|||||||||||||||||||||||
|
Net interest income
(expense) |
$ |
666 |
|
$ |
716 |
|
$ |
470 |
|
$ |
350 |
|
$ |
(405 |
) |
$ |
1,797 |
| |||||
|
Provision
for credit losses |
9 |
|
21 |
|
225 |
|
(7 |
) |
— |
|
248 |
| |||||||||||
|
Noninterest
income |
320 |
|
162 |
|
129 |
|
393 |
|
47 |
|
1,051 |
| |||||||||||
|
Noninterest
expenses |
620 |
|
434 |
|
408 |
|
445 |
|
23 |
|
1,930 |
| |||||||||||
|
Provision (benefit) for
income taxes |
114 |
|
152 |
|
(12 |
) |
81 |
|
(142 |
) |
193 |
| |||||||||||
|
Net
income (loss) |
$ |
243 |
|
$ |
271 |
|
$ |
(22 |
) |
$ |
224 |
|
$ |
(239 |
) |
$ |
477 |
| |||||
|
Net
credit-related charge-offs |
$ |
9 |
|
$ |
26 |
|
$ |
118 |
|
$ |
4 |
|
$ |
— |
|
$ |
157 |
| |||||
|
Selected
average balances: |
|||||||||||||||||||||||
|
Assets |
$ |
13,105 |
|
$ |
18,012 |
|
$ |
11,101 |
|
$ |
9,062 |
|
$ |
20,463 |
|
$ |
71,743 |
| |||||
|
Loans |
12,457 |
|
17,731 |
|
10,637 |
|
8,171 |
|
— |
|
48,996 |
| |||||||||||
|
Deposits |
21,777 |
|
17,438 |
|
10,168 |
|
8,005 |
|
353 |
|
57,741 |
| |||||||||||
|
Statistical
data: |
|||||||||||||||||||||||
|
Return
on average assets (b) |
1.08 |
% |
1.46 |
% |
(0.18 |
)% |
2.47 |
% |
N/M |
|
0.67 |
% | |||||||||||
|
Efficiency
ratio (c) |
62.33 |
|
49.55 |
|
67.94 |
|
59.86 |
|
N/M |
|
67.53 |
| |||||||||||
|
(dollar
amounts in millions) |
Michigan |
California |
Texas |
Other
Markets |
Finance
& Other |
Total | |||||||||||||||||
|
Year
Ended December 31, 2015 | |||||||||||||||||||||||
|
Earnings
summary: |
|||||||||||||||||||||||
|
Net
interest income (expense) |
$ |
708 |
|
$ |
735 |
|
$ |
518 |
|
$ |
336 |
|
$ |
(608 |
) |
$ |
1,689 |
| |||||
|
Provision
for credit losses |
(27 |
) |
17 |
|
131 |
|
25 |
|
1 |
|
147 |
| |||||||||||
|
Noninterest
income |
329 |
|
150 |
|
131 |
|
381 |
|
44 |
|
1,035 |
| |||||||||||
|
Noninterest
expenses |
594 |
|
405 |
|
387 |
|
431 |
|
10 |
|
1,827 |
| |||||||||||
|
Provision
(benefit) for income taxes |
151 |
|
166 |
|
54 |
|
64 |
|
(206 |
) |
229 |
| |||||||||||
|
Net
income (loss) |
$ |
319 |
|
$ |
297 |
|
$ |
77 |
|
$ |
197 |
|
$ |
(369 |
) |
$ |
521 |
| |||||
|
Net
credit-related charge-offs |
$ |
8 |
|
$ |
18 |
|
$ |
46 |
|
$ |
29 |
|
$ |
— |
|
$ |
101 |
| |||||
|
Selected
average balances: |
|||||||||||||||||||||||
|
Assets |
$ |
13,598 |
|
$ |
17,044 |
|
$ |
11,778 |
|
$ |
8,708 |
|
$ |
19,119 |
|
$ |
70,247 |
| |||||
|
Loans |
13,016 |
|
16,778 |
|
11,168 |
|
7,673 |
|
(7 |
) |
48,628 |
| |||||||||||
|
Deposits |
21,848 |
|
17,788 |
|
10,882 |
|
7,403 |
|
405 |
|
58,326 |
| |||||||||||
|
Statistical
data: |
|||||||||||||||||||||||
|
Return
on average assets (b) |
1.40 |
% |
1.57 |
% |
0.62 |
% |
2.26 |
% |
N/M |
|
0.74 |
% | |||||||||||
|
Efficiency
ratio (c) |
56.93 |
|
45.88 |
|
59.63 |
|
59.92 |
|
N/M |
|
66.93 |
| |||||||||||
|
(a) |
Included
a $107
million
charge to adjust deferred taxes as a result of the enactment of the Tax
Cuts and Jobs Act and a $35
million
tax benefit from employee stock
transactions. |
|
(b) |
Return
on average assets is calculated based on the greater of average assets or
average liabilities and attributed
equity. |
|
(c) |
Noninterest
expenses as a percentage of the sum of net interest income (fully taxable
equivalent basis) and noninterest income excluding net securities
gains. |
|
(in
millions, except share data) |
|
| |||||
|
December
31 |
2017 |
2016 | |||||
|
Assets |
|||||||
|
Cash
and due from subsidiary bank |
$ |
1,059 |
|
$ |
761 |
| |
|
Other
short-term investments |
92 |
|
87 |
| |||
|
Investment
in subsidiaries, principally banks |
7,467 |
|
7,561 |
| |||
|
Premises
and equipment |
2 |
|
2 |
| |||
|
Other
assets |
127 |
|
150 |
| |||
|
Total
assets |
$ |
8,747 |
|
$ |
8,561 |
| |
|
Liabilities
and Shareholders’ Equity |
|||||||
|
Medium-
and long-term debt |
$ |
602 |
|
$ |
604 |
| |
|
Other
liabilities |
182 |
|
161 |
| |||
|
Total
liabilities |
784 |
|
765 |
| |||
|
Common
stock - $5 par value: |
|||||||
|
Authorized
- 325,000,000 shares |
|||||||
|
Issued
- 228,164,824 shares |
1,141 |
|
1,141 |
| |||
|
Capital
surplus |
2,122 |
|
2,135 |
| |||
|
Accumulated
other comprehensive loss |
(451 |
) |
(383 |
) | |||
|
Retained
earnings |
7,887 |
|
7,331 |
| |||
|
Less cost of common stock
in treasury - 55,306,483 shares at 12/31/17 and 52,851,156 shares at
12/31/16 |
(2,736 |
) |
(2,428 |
) | |||
|
Total
shareholders’ equity |
7,963 |
|
7,796 |
| |||
|
Total
liabilities and shareholders’ equity |
$ |
8,747 |
|
$ |
8,561 |
| |
|
(in
millions) |
|
||||||||||
|
Years
Ended December 31 |
2017 |
2016 |
2015 | ||||||||
|
Income |
|||||||||||
|
Income
from subsidiaries: |
|||||||||||
|
Dividends
from subsidiaries |
$ |
915 |
|
$ |
549 |
|
$ |
441 |
| ||
|
Other
interest income |
3 |
|
1 |
|
1 |
| |||||
|
Intercompany
management fees |
136 |
|
138 |
|
123 |
| |||||
|
Other
noninterest income |
8 |
|
3 |
|
1 |
| |||||
|
Total
income |
1,062 |
|
691 |
|
566 |
| |||||
|
Expenses |
|||||||||||
|
Interest
on medium- and long-term debt |
13 |
|
10 |
|
14 |
| |||||
|
Salaries
and benefits expense |
127 |
|
114 |
|
112 |
| |||||
|
Net
occupancy expense |
5 |
|
5 |
|
5 |
| |||||
|
Equipment
expense |
1 |
|
1 |
|
1 |
| |||||
|
Restructuring
charges |
6 |
|
33 |
|
— |
| |||||
|
Other
noninterest expenses |
80 |
|
72 |
|
70 |
| |||||
|
Total
expenses |
232 |
|
235 |
|
202 |
| |||||
|
Income before benefit for
income taxes and equity in undistributed earnings of
subsidiaries |
830 |
|
456 |
|
364 |
| |||||
|
Benefit
for income taxes |
(26 |
) |
(28 |
) |
(27 |
) | |||||
|
Income
before equity in undistributed earnings of subsidiaries |
856 |
|
484 |
|
391 |
| |||||
|
Equity
in undistributed earnings of subsidiaries, principally
banks |
(113 |
) |
(7 |
) |
130 |
| |||||
|
Net
income |
743 |
|
477 |
|
521 |
| |||||
|
Less
income allocated to participating securities |
5 |
|
4 |
|
6 |
| |||||
|
Net
income attributable to common shares |
$ |
738 |
|
$ |
473 |
|
$ |
515 |
| ||
|
(in
millions) |
|
|
| ||||||||
|
Years
Ended December 31 |
2017 |
2016 |
2015 | ||||||||
|
Operating
Activities |
|||||||||||
|
Net
income |
$ |
743 |
|
$ |
477 |
|
$ |
521 |
| ||
|
Adjustments to reconcile
net income to net cash provided by operating activities: |
|||||||||||
|
Undistributed
earnings of subsidiaries, principally banks |
113 |
|
7 |
|
(130 |
) | |||||
|
Depreciation
and amortization |
1 |
|
1 |
|
1 |
| |||||
|
Net
periodic defined benefit (credit) cost |
(2 |
) |
1 |
|
5 |
| |||||
|
Share-based
compensation expense |
16 |
|
14 |
|
14 |
| |||||
|
Benefit
for deferred income taxes |
(10 |
) |
(3 |
) |
— |
| |||||
|
Other,
net |
59 |
|
6 |
|
5 |
| |||||
|
Net
cash provided by operating activities |
920 |
|
503 |
|
416 |
| |||||
|
Investing
Activities |
|||||||||||
|
Net
change in premises and equipment |
— |
|
— |
|
(1 |
) | |||||
|
Net
cash used in investing activities |
— |
|
— |
|
(1 |
) | |||||
|
Financing
Activities |
|||||||||||
|
Medium-
and long-term debt: |
|||||||||||
|
Maturities
and redemptions |
— |
|
— |
|
(600 |
) | |||||
|
Common
Stock: |
|||||||||||
|
Repurchases |
(552 |
) |
(315 |
) |
(240 |
) | |||||
|
Cash
dividends paid |
(180 |
) |
(152 |
) |
(147 |
) | |||||
|
Issuances
of common stock under employee stock plans |
110 |
|
152 |
|
22 |
| |||||
|
Purchase
and retirement of warrants |
— |
|
— |
|
(10 |
) | |||||
|
Net
cash used in financing activities |
(622 |
) |
(315 |
) |
(975 |
) | |||||
|
Net
increase (decrease) in cash and cash equivalents |
298 |
|
188 |
|
(560 |
) | |||||
|
Cash
and cash equivalents at beginning of period |
761 |
|
573 |
|
1,133 |
| |||||
|
Cash
and cash equivalents at end of period |
$ |
1,059 |
|
$ |
761 |
|
$ |
573 |
| ||
|
Interest
paid |
$ |
12 |
|
$ |
9 |
|
$ |
16 |
| ||
|
Income
taxes recovered |
$ |
(331 |
) |
$ |
(139 |
) |
$ |
(62 |
) | ||
|
2017 | |||||||||||||||
|
(in
millions, except per share data) |
Fourth
Quarter |
Third
Quarter |
Second
Quarter |
First
Quarter | |||||||||||
|
Interest
income |
$ |
578 |
|
$ |
579 |
|
$ |
529 |
|
$ |
496 |
| |||
|
Interest
expense |
33 |
|
33 |
|
29 |
|
26 |
| |||||||
|
Net
interest income |
545 |
|
546 |
|
500 |
|
470 |
| |||||||
|
Provision
for credit losses |
17 |
|
24 |
|
17 |
|
16 |
| |||||||
|
Net
securities losses |
— |
|
(1 |
) |
(2 |
) |
— |
| |||||||
|
Noninterest
income excluding net securities losses |
285 |
|
276 |
|
278 |
|
271 |
| |||||||
|
Noninterest
expenses |
483 |
|
463 |
|
457 |
|
457 |
| |||||||
|
Provision
for income taxes |
218 |
|
108 |
|
99 |
|
66 |
| |||||||
|
Net
income |
112 |
|
226 |
|
203 |
|
202 |
| |||||||
|
Less
income allocated to participating securities |
— |
|
2 |
|
1 |
|
2 |
| |||||||
|
Net
income attributable to common shares |
$ |
112 |
|
$ |
224 |
|
$ |
202 |
|
$ |
200 |
| |||
|
Earnings
per common share: |
|||||||||||||||
|
Basic |
$ |
0.65 |
|
$ |
1.29 |
|
$ |
1.15 |
|
$ |
1.15 |
| |||
|
Diluted |
0.63 |
|
1.26 |
|
1.13 |
|
1.11 |
| |||||||
|
Comprehensive
income |
107 |
|
228 |
|
221 |
|
206 |
| |||||||
|
2016 | |||||||||||||||
|
(in
millions, except per share data) |
Fourth
Quarter |
Third
Quarter |
Second
Quarter |
First
Quarter | |||||||||||
|
Interest
income |
$ |
484 |
|
$ |
480 |
|
$ |
473 |
|
$ |
472 |
| |||
|
Interest
expense |
29 |
|
30 |
|
28 |
|
25 |
| |||||||
|
Net
interest income |
455 |
|
450 |
|
445 |
|
447 |
| |||||||
|
Provision
for credit losses |
35 |
|
16 |
|
49 |
|
148 |
| |||||||
|
Net
securities losses |
(2 |
) |
— |
|
(1 |
) |
(2 |
) | |||||||
|
Noninterest
income excluding net securities losses |
269 |
|
272 |
|
269 |
|
246 |
| |||||||
|
Noninterest
expenses |
461 |
|
493 |
|
518 |
|
458 |
| |||||||
|
Provision
for income taxes |
62 |
|
64 |
|
42 |
|
25 |
| |||||||
|
Net
income |
164 |
|
149 |
|
104 |
|
60 |
| |||||||
|
Less
income allocated to participating securities |
1 |
|
1 |
|
1 |
|
1 |
| |||||||
|
Net
income attributable to common shares |
$ |
163 |
|
$ |
148 |
|
$ |
103 |
|
$ |
59 |
| |||
|
Earnings
per common share: |
|||||||||||||||
|
Basic |
$ |
0.95 |
|
$ |
0.87 |
|
$ |
0.60 |
|
$ |
0.34 |
| |||
|
Diluted |
0.92 |
|
0.84 |
|
0.58 |
|
0.34 |
| |||||||
|
Comprehensive
income |
73 |
|
152 |
|
137 |
|
161 |
| |||||||
|
Ralph
W. Babb Jr. |
Muneera
S. Carr |
Mauricio
A. Ortiz | ||
|
Chairman
and |
Executive
Vice President and |
Senior
Vice President and | ||
|
Chief
Executive Officer |
Chief
Financial Officer |
Chief
Accounting Officer | ||
|
(in
millions) |
|
|
|
|
| ||||||||||||||
|
Years
Ended December 31 |
2017 |
2016 |
2015 |
2014 |
2013 | ||||||||||||||
|
ASSETS |
|||||||||||||||||||
|
Cash
and due from banks |
$ |
1,209 |
|
$ |
1,146 |
|
$ |
1,059 |
|
$ |
934 |
|
$ |
987 |
| ||||
|
Interest-bearing
deposits with banks |
5,443 |
|
5,099 |
|
6,158 |
|
5,513 |
|
4,930 |
| |||||||||
|
Other
short-term investments |
92 |
|
102 |
|
106 |
|
109 |
|
112 |
| |||||||||
|
Investment
securities |
12,207 |
|
12,348 |
|
10,237 |
|
9,350 |
|
9,637 |
| |||||||||
|
Commercial
loans |
30,415 |
|
31,062 |
|
31,501 |
|
29,715 |
|
27,971 |
| |||||||||
|
Real
estate construction loans |
2,958 |
|
2,508 |
|
1,884 |
|
1,909 |
|
1,486 |
| |||||||||
|
Commercial
mortgage loans |
9,005 |
|
8,981 |
|
8,697 |
|
8,706 |
|
9,060 |
| |||||||||
|
Lease
financing |
509 |
|
684 |
|
783 |
|
834 |
|
847 |
| |||||||||
|
International
loans |
1,157 |
|
1,367 |
|
1,441 |
|
1,376 |
|
1,275 |
| |||||||||
|
Residential
mortgage loans |
1,989 |
|
1,894 |
|
1,878 |
|
1,778 |
|
1,620 |
| |||||||||
|
Consumer
loans |
2,525 |
|
2,500 |
|
2,444 |
|
2,270 |
|
2,153 |
| |||||||||
|
Total
loans |
48,558 |
|
48,996 |
|
48,628 |
|
46,588 |
|
44,412 |
| |||||||||
|
Less
allowance for loan losses |
(728 |
) |
(730 |
) |
(621 |
) |
(601 |
) |
(622 |
) | |||||||||
|
Net
loans |
47,830 |
|
48,266 |
|
48,007 |
|
45,987 |
|
43,790 |
| |||||||||
|
Accrued
income and other assets |
4,671 |
|
4,782 |
|
4,680 |
|
4,443 |
|
4,477 |
| |||||||||
|
Total
assets |
$ |
71,452 |
|
$ |
71,743 |
|
$ |
70,247 |
|
$ |
66,336 |
|
$ |
63,933 |
| ||||
|
LIABILITIES
AND SHAREHOLDERS’ EQUITY |
|||||||||||||||||||
|
Noninterest-bearing
deposits |
$ |
31,013 |
|
$ |
29,751 |
|
$ |
28,087 |
|
$ |
25,019 |
|
$ |
22,379 |
| ||||
|
Money
market and interest-bearing checking deposits |
21,585 |
|
22,744 |
|
24,073 |
|
22,891 |
|
21,704 |
| |||||||||
|
Savings
deposits |
2,133 |
|
2,013 |
|
1,841 |
|
1,744 |
|
1,657 |
| |||||||||
|
Customer
certificates of deposit |
2,471 |
|
3,200 |
|
4,209 |
|
4,869 |
|
5,471 |
| |||||||||
|
Foreign
office time deposits |
56 |
|
33 |
|
116 |
|
261 |
|
500 |
| |||||||||
|
Total
interest-bearing deposits |
26,245 |
|
27,990 |
|
30,239 |
|
29,765 |
|
29,332 |
| |||||||||
|
Total
deposits |
57,258 |
|
57,741 |
|
58,326 |
|
54,784 |
|
51,711 |
| |||||||||
|
Short-term
borrowings |
277 |
|
138 |
|
93 |
|
200 |
|
211 |
| |||||||||
|
Accrued
expenses and other liabilities |
996 |
|
1,273 |
|
1,389 |
|
1,016 |
|
1,074 |
| |||||||||
|
Medium-
and long-term debt |
4,969 |
|
4,917 |
|
2,905 |
|
2,963 |
|
3,972 |
| |||||||||
|
Total
liabilities |
63,500 |
|
64,069 |
|
62,713 |
|
58,963 |
|
56,968 |
| |||||||||
|
Total
shareholders’ equity |
7,952 |
|
7,674 |
|
7,534 |
|
7,373 |
|
6,965 |
| |||||||||
|
Total
liabilities and shareholders’ equity |
$ |
71,452 |
|
$ |
71,743 |
|
$ |
70,247 |
|
$ |
66,336 |
|
$ |
63,933 |
| ||||
|
(in
millions, except per share data) |
|||||||||||||||||||
|
Years
Ended December 31 |
2017 |
2016 |
2015 |
2014 |
2013 | ||||||||||||||
|
INTEREST
INCOME |
|||||||||||||||||||
|
Interest
and fees on loans |
$ |
1,872 |
|
$ |
1,635 |
|
$ |
1,551 |
|
$ |
1,525 |
|
$ |
1,556 |
| ||||
|
Interest
on investment securities |
250 |
|
247 |
|
216 |
|
211 |
|
214 |
| |||||||||
|
Interest
on short-term investments |
60 |
|
27 |
|
17 |
|
14 |
|
14 |
| |||||||||
|
Total
interest income |
2,182 |
|
1,909 |
|
1,784 |
|
1,750 |
|
1,784 |
| |||||||||
|
INTEREST
EXPENSE |
|||||||||||||||||||
|
Interest
on deposits |
42 |
|
40 |
|
43 |
|
45 |
|
55 |
| |||||||||
|
Interest
on short-term borrowings |
3 |
|
— |
|
— |
|
— |
|
— |
| |||||||||
|
Interest
on medium- and long-term debt |
76 |
|
72 |
|
52 |
|
50 |
|
57 |
| |||||||||
|
Total
interest expense |
121 |
|
112 |
|
95 |
|
95 |
|
112 |
| |||||||||
|
Net
interest income |
2,061 |
|
1,797 |
|
1,689 |
|
1,655 |
|
1,672 |
| |||||||||
|
Provision
for credit losses |
74 |
|
248 |
|
147 |
|
27 |
|
46 |
| |||||||||
|
Net
interest income after provision for loan losses |
1,987 |
|
1,549 |
|
1,542 |
|
1,628 |
|
1,626 |
| |||||||||
|
NONINTEREST
INCOME |
|||||||||||||||||||
|
Card
fees |
333 |
|
303 |
|
276 |
|
81 |
|
78 |
| |||||||||
|
Service
charges on deposit accounts |
227 |
|
219 |
|
223 |
|
215 |
|
214 |
| |||||||||
|
Fiduciary
income |
198 |
|
190 |
|
187 |
|
180 |
|
171 |
| |||||||||
|
Commercial
lending fees |
85 |
|
89 |
|
99 |
|
98 |
|
99 |
| |||||||||
|
Letter
of credit fees |
45 |
|
50 |
|
53 |
|
57 |
|
64 |
| |||||||||
|
Bank-owned
life insurance |
43 |
|
42 |
|
40 |
|
39 |
|
40 |
| |||||||||
|
Foreign
exchange income |
45 |
|
42 |
|
40 |
|
40 |
|
36 |
| |||||||||
|
Brokerage
fees |
23 |
|
19 |
|
17 |
|
17 |
|
17 |
| |||||||||
|
Net
securities losses |
(3 |
) |
(5 |
) |
(2 |
) |
— |
|
(1 |
) | |||||||||
|
Other
noninterest income |
111 |
|
102 |
|
102 |
|
130 |
|
156 |
| |||||||||
|
Total
noninterest income |
1,107 |
|
1,051 |
|
1,035 |
|
857 |
|
874 |
| |||||||||
|
NONINTEREST
EXPENSES |
|||||||||||||||||||
|
Salaries
and benefits expense |
912 |
|
961 |
|
1,009 |
|
980 |
|
1,009 |
| |||||||||
|
Outside
processing fee expense |
366 |
|
336 |
|
318 |
|
111 |
|
111 |
| |||||||||
|
Net
occupancy expense |
154 |
|
157 |
|
159 |
|
171 |
|
160 |
| |||||||||
|
Equipment
expense |
45 |
|
53 |
|
53 |
|
57 |
|
60 |
| |||||||||
|
Restructuring
charges |
45 |
|
93 |
|
— |
|
— |
|
— |
| |||||||||
|
Software
expense |
126 |
|
119 |
|
99 |
|
95 |
|
90 |
| |||||||||
|
FDIC
insurance expense |
51 |
|
54 |
|
37 |
|
33 |
|
33 |
| |||||||||
|
Advertising
expense |
28 |
|
21 |
|
24 |
|
23 |
|
21 |
| |||||||||
|
Litigation-related
expenses |
(2 |
) |
1 |
|
(32 |
) |
4 |
|
52 |
| |||||||||
|
Gain
on debt redemption |
— |
|
— |
|
— |
|
(32 |
) |
(1 |
) | |||||||||
|
Other
noninterest expenses |
135 |
|
135 |
|
160 |
|
173 |
|
179 |
| |||||||||
|
Total
noninterest expenses |
1,860 |
|
1,930 |
|
1,827 |
|
1,615 |
|
1,714 |
| |||||||||
|
Income
before income taxes |
1,234 |
|
670 |
|
750 |
|
870 |
|
786 |
| |||||||||
|
Provision
for income taxes |
491 |
|
193 |
|
229 |
|
277 |
|
245 |
| |||||||||
|
NET
INCOME |
$ |
743 |
|
$ |
477 |
|
$ |
521 |
|
$ |
593 |
|
$ |
541 |
| ||||
|
Less
income allocated to participating securities |
5 |
|
4 |
|
6 |
|
7 |
|
8 |
| |||||||||
|
Net
income attributable to common shares |
$ |
738 |
|
$ |
473 |
|
$ |
515 |
|
$ |
586 |
|
$ |
533 |
| ||||
|
Earnings
per common share: |
|||||||||||||||||||
|
Basic |
$ |
4.23 |
|
$ |
2.74 |
|
$ |
2.93 |
|
$ |
3.28 |
|
$ |
2.92 |
| ||||
|
Diluted |
4.14 |
|
2.68 |
|
2.84 |
|
3.16 |
|
2.85 |
| |||||||||
|
Comprehensive
income |
762 |
|
523 |
|
504 |
|
572 |
|
563 |
| |||||||||
|
Cash
dividends declared on common stock |
193 |
|
154 |
|
148 |
|
143 |
|
126 |
| |||||||||
|
Cash
dividends declared per common share |
1.09 |
|
0.89 |
|
0.83 |
|
0.79 |
|
0.68 |
| |||||||||
|
Years
Ended December 31 |
2017 |
2016 |
2015 |
2014 |
2013 | ||||||||||||||
|
Average
Rates (Fully Taxable Equivalent Basis) |
|||||||||||||||||||
|
Interest-bearing
deposits with banks |
1.09 |
% |
0.51 |
% |
0.26 |
% |
0.26 |
% |
0.26 |
% | |||||||||
|
Other
short-term investments |
0.64 |
|
0.61 |
|
0.81 |
|
0.57 |
|
1.22 |
| |||||||||
|
Investment
securities |
2.05 |
|
2.02 |
|
2.13 |
|
2.26 |
|
2.25 |
| |||||||||
|
Commercial
loans |
3.83 |
|
3.26 |
|
3.07 |
|
3.12 |
|
3.28 |
| |||||||||
|
Real
estate construction loans |
4.18 |
|
3.63 |
|
3.48 |
|
3.41 |
|
3.85 |
| |||||||||
|
Commercial
mortgage loans |
3.97 |
|
3.49 |
|
3.41 |
|
3.75 |
|
4.11 |
| |||||||||
|
Lease
financing |
2.64 |
|
2.65 |
|
3.17 |
|
2.33 |
|
3.23 |
| |||||||||
|
International
loans |
4.07 |
|
3.63 |
|
3.58 |
|
3.65 |
|
3.74 |
| |||||||||
|
Residential
mortgage loans |
3.70 |
|
3.76 |
|
3.77 |
|
3.82 |
|
4.09 |
| |||||||||
|
Consumer
loans |
3.70 |
|
3.32 |
|
3.26 |
|
3.20 |
|
3.30 |
| |||||||||
|
Total
loans |
3.86 |
|
3.34 |
|
3.20 |
|
3.28 |
|
3.51 |
| |||||||||
|
Interest
income as a percentage of earning assets |
3.30 |
|
2.88 |
|
2.75 |
|
2.85 |
|
3.03 |
| |||||||||
|
Domestic
deposits |
0.16 |
|
0.14 |
|
0.14 |
|
0.14 |
|
0.18 |
| |||||||||
|
Deposits
in foreign offices |
0.64 |
|
0.35 |
|
1.02 |
|
0.82 |
|
0.52 |
| |||||||||
|
Total
interest-bearing deposits |
0.16 |
|
0.14 |
|
0.14 |
|
0.15 |
|
0.19 |
| |||||||||
|
Short-term
borrowings |
1.14 |
|
0.45 |
|
0.05 |
|
0.04 |
|
0.07 |
| |||||||||
|
Medium-
and long-term debt |
1.51 |
|
1.45 |
|
1.80 |
|
1.68 |
|
1.45 |
| |||||||||
|
Interest
expense as a percentage of interest-bearing sources |
0.38 |
|
0.34 |
|
0.29 |
|
0.29 |
|
0.33 |
| |||||||||
|
Interest
rate spread |
2.92 |
|
2.54 |
|
2.46 |
|
2.56 |
|
2.70 |
| |||||||||
|
Impact
of net noninterest-bearing sources of funds |
0.20 |
|
0.17 |
|
0.14 |
|
0.14 |
|
0.14 |
| |||||||||
|
Net
interest margin as a percentage of earning assets |
3.12 |
% |
2.71 |
% |
2.60 |
% |
2.70 |
% |
2.84 |
% | |||||||||
|
Ratios |
|||||||||||||||||||
|
Return
on average common shareholders’ equity |
9.34 |
% |
6.22 |
% |
6.91 |
% |
8.05 |
% |
7.76 |
% | |||||||||
|
Return
on average assets |
1.04 |
|
0.67 |
|
0.74 |
|
0.89 |
|
0.85 |
| |||||||||
|
Efficiency
ratio (a) |
58.57 |
|
67.53 |
|
66.93 |
|
64.16 |
|
68.72 |
| |||||||||
|
Common equity tier 1
capital as a percentage of risk weighted assets (b) |
11.68 |
|
11.09 |
|
10.54 |
|
n/a |
|
n/a |
| |||||||||
|
Tier
1 capital as a percentage of risk-weighted assets (b) |
11.68 |
|
11.09 |
|
10.54 |
|
10.50 |
|
10.64 |
| |||||||||
|
Total
capital as a percentage of risk-weighted assets |
13.84 |
|
13.27 |
|
12.69 |
|
12.51 |
|
13.10 |
| |||||||||
|
Common
equity ratio |
11.13 |
|
10.68 |
|
10.52 |
|
10.70 |
|
10.97 |
| |||||||||
|
Tangible
common equity as a percentage of tangible assets (c) |
10.32 |
|
9.89 |
|
9.70 |
|
9.85 |
|
10.07 |
| |||||||||
|
Per
Common Share Data |
|||||||||||||||||||
|
Book
value at year-end |
$ |
46.07 |
|
$ |
44.47 |
|
$ |
43.03 |
|
$ |
41.35 |
|
$ |
39.22 |
| ||||
|
Market
value at year-end |
86.81 |
|
68.11 |
|
41.83 |
|
46.84 |
|
47.54 |
| |||||||||
|
Market
value for the year |
|||||||||||||||||||
|
High |
88.22 |
|
70.44 |
|
53.45 |
|
53.50 |
|
48.69 |
| |||||||||
|
Low |
64.04 |
|
30.48 |
|
39.52 |
|
42.73 |
|
30.73 |
| |||||||||
|
Other
Data (share data in millions) |
|||||||||||||||||||
|
Average
common shares outstanding - basic |
174 |
|
172 |
|
176 |
|
179 |
|
183 |
| |||||||||
|
Average
common shares outstanding - diluted |
178 |
|
177 |
|
181 |
|
185 |
|
187 |
| |||||||||
|
Number
of banking centers |
438 |
|
458 |
|
477 |
|
481 |
|
483 |
| |||||||||
|
Number
of employees (full-time equivalent) |
7,999 |
|
7,960 |
|
8,880 |
|
8,876 |
|
8,948 |
| |||||||||
|
(a) |
Noninterest
expenses as a percentage of the sum of net interest income (FTE) and
noninterest income excluding net securities gains
(losses). |
|
(b) |
Ratios
calculated based on the risk-based capital requirements in effect at the
time. The U.S. implementation of the Basel III regulatory capital
framework became effective on January 1, 2015, with transitional
provisions. |
|
(c) |
See
Supplemental Financial Data section for reconcilements of non-GAAP
financial measures. |
|
COMERICA
INCORPORATED | |||
|
By: |
|
/s/
Ralph W. Babb, Jr. | |
|
|
Ralph
W. Babb, Jr.
Chairman
and Chief Executive Officer | ||
|
/s/
Ralph W. Babb, Jr. |
Chairman
and Chief Executive Officer and | |
|
Ralph
W. Babb, Jr. |
Director
(Principal Executive Officer) | |
|
/s/
Muneera S. Carr |
Executive
Vice President and Chief Financial Officer | |
|
Muneera
S. Carr |
(Principal
Financial Officer) | |
|
/s/
Mauricio A. Ortiz |
Senior
Vice President and Chief Accounting Officer | |
|
Mauricio
A. Ortiz |
(Principal
Accounting Officer) | |
|
/s/
Michael E. Collins |
||
|
Michael
E. Collins |
Director | |
|
/s/
Roger A. Cregg |
||
|
Roger
A. Cregg |
Director | |
|
/s/
T. Kevin DeNicola |
||
|
T.
Kevin DeNicola |
Director | |
|
/s/
Jacqueline P. Kane |
||
|
Jacqueline
P. Kane |
Director | |
|
/s/
Richard G. Lindner |
||
|
Richard
G. Lindner |
Director | |
|
/s/
Barbara R. Smith |
||
|
Barbara
R. Smith |
Director | |
|
/s/
Robert S. Taubman |
||
|
Robert
S. Taubman |
Director | |
|
/s/
Reginald M. Turner, Jr. |
||
|
Reginald
M. Turner, Jr. |
Director | |
|
/s/
Nina G. Vaca |
||
|
Nina
G. Vaca |
Director | |
|
/s/
Michael G. Van de Ven |
||
|
Michael
G. Van de Ven |
Director | |
Comerica Bank Tower
1717 Main Street
Dallas, Texas 75201