


Covanta is an internationally recognized owner and operator of Energy-from-Waste (EfW) projects. Our state-of-the-art facilities convert municipal solid waste into clean, renewable energy for communities around the world. For more information, please visit covantaenergy.com.
All around us, we see positive signs for our future: from enduring customer relationships to superior environmental solutions to cutting-edge technology. It’s the power of what’s possible that drives us in our daily pursuit to create energy for a cleaner world.
We are dedicated to cultivating strong relationships with our client communities. Enhancing knowledge and behavior is central to our mission and is realized daily, not only in philanthropic programs like Fishing for Energy, Rx4Safety, educational scholarships and poster contests, but also in our Community Outreach and Environmental Justice Policy, which codifies our outreach objectives of open communication and fair treatment of disadvantaged communities.

Few businesses have the luxury and the privilege to think long-term the way we do. We are secure in knowing that 75% of our waste business is contracted and, to date, we have successfully renewed nearly all contracts upon expiration. Not only does this pave a long and steady road for us into the future, this level of commitment from our loyal customers inspires us to constantly improve our operations and exceed their expectations.
Covanta Research & Development works to develop and evaluate emerging technologies and to enhance the efficiency and environmental performance of our facilities. Our pioneering efforts to achieve Nitrogen Oxide emissions 50% or more below permit levels led to our proprietary LNTM and VLNTM technologies and has secured our technology leadership position in the industry. And our new development project in Durham York, Ontario will redefine the standard for clean EfW.
Corporations are ramping up their sustainability efforts all across the globe. Covanta is poised to present itself as a smart partner, with proven expertise in landfill avoidance, logistics, e-waste recycling and environmental services. We’ve unified our waste services to form Covanta 4Recovery as a way to broaden our footprint and expand our offering in the waste market. It’s the right solution, in the right place, at the right time.
Innovation is a big word that fits into small spaces. Our Organic Growth & Innovation Group looks far beyond and close to home for ways to constantly improve our business: from new technologies that help us recover and recycle more metal, to incremental yet significant improvements in the operations, maintenance and administration of our day-to-day business–improvements that have the potential to both save money and grow the business over time.
We are proud of our consistent performance: steady earnings growth, strong cash flow and creating value for our shareholders. But what’s unique about our business model is its stability and predictability–allowing us to be confident about our future performance as well. The strength of our core business, our long-term contracts and predictable cash flow generation combine with our dedicated and knowledgable workforce to give us a positive outlook on our future.
There is momentum afoot to create new jobs and industry and governments alike are turning toward the energy sector to capitalize on these opportunities. Energy-from-Waste facilities can be major stimulants to a local economy, creating new and permanent jobs. They employ skilled workers throughout planning, construction and operation, with enduring economic benefits created by sustainable waste management and renewable energy generation.
Heightened awareness of energy conservation and clean energy sourcing makes this a particularly optimistic time for Covanta. Of the viable options for alternative energy, Energy-from-Waste is one of the few that is self-sufficient, offering reliable baseload power. Undeterred by unpredictable weather patterns or the natural impediments of windless days and sunless nights, Energy-from-Waste always keeps the lights on for you.

Chairman of the Board of Directors

President and
Chief Executive Officer
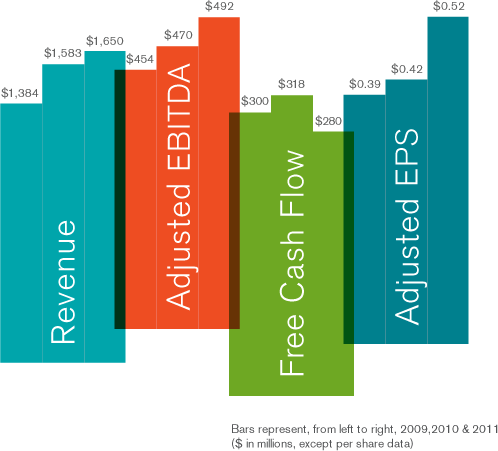
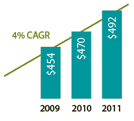
In 2011, we executed on our plan and achieved our goals of continuing growth and maximizing shareholder value. Year - over - year, Revenue increased 4%, Adjusted EBITDA grew 5% and Adjusted EPS was up 24%. Through a disciplined approach to capital allocation, we returned $272 million to shareholders in 2011. We established a regular cash dividend of $0.30 per share annually, and repurchased $230 million of stock. We achieved this strong performance through hard work, focusing on our client relationships and executing on organic growth opportunities.
Our solid financial performance is a result of our best-in-class team, which is second to none. We are continually finding innovative ways to improve the business and add value. In 2011, we recorded our best-ever safety and environmental performance. We operated at levels far better than our mandated emissions limits on all fronts and are continually looking at new technologies and advancements to drive further progress.
Our team successfully operated through a number of natural disasters – hurricanes, earthquakes, tornados and unexpected storms–during the past year, providing uninterrupted baseload power to the areas around our facilities.
We recognize that our employees live and work in the neighborhoods in which we operate, and we continue to develop programs to protect the health and well-being of community residents and the environment. One example is our Rx4Safety program, where we collect medications at community-sponsored drug take-back programs and provide safe, free, assured destruction at our Energy-from-Waste (EfW) facilities. To date, we have destroyed more than 200,000 pounds of unwanted medications, preventing these drugs from falling into the wrong hands or the chemicals they contain from polluting water resources. Giving back to our communities is a key element of our business model and helps cement the strong bonds that we enjoy with our employees and clients.
Further, we created numerous jobs in our client communities by expanding our business portfolio in the past year. The correlation between Covanta growth and job creation provides further evidence that there are exponential economic benefits created by sustainable waste management and renewable energy generation. For example, our Honolulu expansion peaked at 300 workers during the year. When this project is finished in 2012, we’ll hire more permanent employees and the facility will produce over 6% of Oahu’s electricity, a sustainable solution that supports local businesses by reducing the island’s dependence on imported oil.
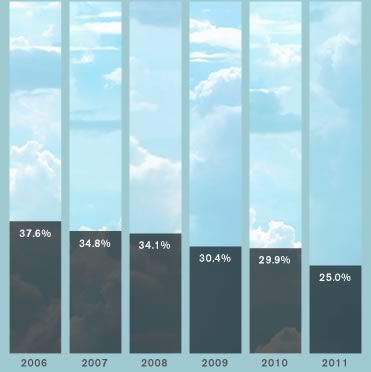
During the year, we saw a dramatic shift in energy pricing across the nation due to increased natural gas production and a mild winter. Fortunately, we have a great deal of stability in our business as 75% of our energy revenue in 2012 is either hedged or under fixed-price contract. Of course that means we still have 25% exposed to market, and while this creates challenges, it also presents opportunities. For example, we are converting some of our oil-fired auxiliary burners to natural gas and we are installing a natural gas fueling station at our Essex County facility in New Jersey. Both projects are investments in our future that enhance our competitive position.
Our organic growth strategy rests on three key pillars: improving metal recovery, growing our special waste business and using technology to enhance efficiencies.
In 2011, we increased our metals revenue by 35% to $74 million due to improved pricing and volume increases. During the year, Covanta’s 41 EfW facilities in North America recycled over 400,000 tons of ferrous and over 15,000 tons of non-ferrous metal. That’s the equivalent amount of steel in five Golden Gate Bridges and the amount of aluminum in over one billion aluminum beverage cans. To continue this growth, we plan to add new and upgraded ferrous and non-ferrous recovery systems throughout the coming years. These are relatively modest investments with very attractive payback. We are already enjoying the results at our Dade facility in Florida, where our recently acquired shredder contributed nicely to our metal revenue growth in 2011.
Special waste, another key component of our organic growth strategy, replaces lower-priced spot waste and is becoming an increasingly important revenue stream for us. While we’ve been growing this business for several years, we still have a lot of runway with enhanced customer offerings through our Covanta 4Recovery business, which provides waste procurement and logistics, environmental services, metals recycling, e-waste recycling, and energy recovery initiatives. This group will play a critical role in our special waste initiative, which consists of three primary offerings for our customers: sustainable solutions, specialty services and assured destruction.
The third component of our organic growth plan is performance improvements. We are applying new technologies to continually reduce costs and increase productivity. For example, we developed a new ash conditioning system to improve metal recovery and lower our ash disposal costs. This benefits both sides of the Income Statement. We’re also using innovation in terms of maintenance techniques and process automation to drive down costs.
Going forward, we are confident about Covanta’s future. We have a solid core business and a number of opportunities that could be significant drivers of additional growth. We are increasingly optimistic about the progressive energy policies being put in place throughout the world, particularly in Europe, Asia and Canada. This bodes well for EfW as an industry, and for Covanta as a world leader in the space. Furthermore, we are working to commercialize new technologies that, if successful, could accelerate our development potential. Finally, while not likely in the near-term, we believe that some form of new energy and waste policies in the U.S., one of the world’s largest producers of waste and users of energy, will be necessary. We continue to advocate for U.S. policies that discourage burying waste in the ground and burning fossil fuels, and that promote generating clean energy-from-waste.
We are proud of our performance in 2011 and look forward to the work ahead. We thank all of our clients; it is our privilege to serve you and we will continue working hard to earn your trust. We also thank the entire Covanta team for staying focused on safety, client service, continuous improvement, innovation and execution. With your dedication, we will continue to prosper in the years ahead. And finally, we thank our shareholders for your continued support; we see a bright future for Covanta and we are committed to creating value for you by serving our clients.

SAMUEL ZELL
Chairman of the Board of Directors

ANTHONY J. ORLANDO
President and Chief Executive Officer
In 2011, Covanta’s 41 EfW facilities in North America recycled over 400,000 tons of ferrous and over 15,000 tons of non-ferrous metal. That’s the equivalent amount of steel in five Golden Gate Bridges and the amount of aluminum in over one billion aluminum beverage cans.

Safety Today and Every day is Paramount-Unleash the Power!
Our performance in 2011 is something that we take pride in. We recorded our best ever safety record, our lowest emission levels, our highest boiler availability and we signed several contract extensions.

|
(In millions, except per share amounts)
For the Years Ended December 31, |
||||
| 2011 | 2010 | 2009 | ||
| Waste and service revenues | $ 1,082 | $ 1,036 | $ 916 | |
| Electricity and steam sales | 400 | 420 | 417 | |
| Other operating revenues | 168 | 127 | 51 | |
| Total operating revenues | $ 1,650 | $ 1,583 | $ 1,384 | |
| Operating expenses | $ (1,432) | $ (1,428) | $ (1,220) | |
| Write-down of assets, net of insurance recoveries | $ — | $ (34) | $ — | |
| Operating income | $ 218 | $ 155 | $ 164 | |
| Total other expenses | $ (111) | $ (98) | $ (60) | |
| Loss on extinguishment of debt | $ (1) | $ (15) | $ — | |
| Income tax expense | $ (28) | $ (24) | $ (42) | |
| Income from continuing operations | $ 84 | $ 35 | $ 65 | |
| Income from discontinued operations, net of taxes | $ 143 | $ 36 | $ 46 | |
| Net Income | $ 227 | $ 71 | $ 111 | |
| Net Income attributable to Covanta Holding Corporation | $ 219 | $ 62 | $ 102 | |
| Amounts attributable to Covanta Holding Corporation stockholders: | ||||
| Income from continuing operations | $ 79 | $ 30 | $ 61 | |
| Income from discontinued operations, net of taxes | 140 | 32 | 41 | |
| Net Income attributable to Covanta Holding Corporation | $ 219 | $ 62 | $ 102 | |
| Basic Earnings per share attributable to Covanta Holding Corporation: | ||||
| Continuing operations | $ 0.56 | $ 0.19 | $ 0.39 | |
| Discontinued operations | 0.99 | 0.21 | 0.27 | |
| Covanta Holding Corporation | $ 1.55 | $ 0.40 | $ 0.66 | |
| Diluted Earnings per share attributable to Covanta Holding Corporation: | ||||
| Continuing operations | $ 0.56 | $ 0.19 | $ 0.39 | |
| Discontinued operations | 0.98 | 0.21 | 0.27 | |
| Covanta Holding Corporation | $ 1.54 | $ 0.40 | $ 0.66 | |
| Cash Dividend Paid Per Share: | $ 0.30 | $ 1.50 | $ — | |
| Weighted average common shares outstanding: | ||||
| Basic | 141 | 153 | 154 | |
| Diluted | 142 | 154 | 155 | |
|
(In millions)
For the Years Ended December 31, |
||||
| Assets | 2011 | 2010 | 2009 | |
| Cash and cash equivalents | $ 232 | $ 126 | $ 418 | |
| Restricted funds held in trust | $ 191 | $ 233 | $ 240 | |
| Assets held for sale | $ 18 | $ 191 | $ 200 | |
| Property, plant and equipment, net | $ 2,423 | $ 2,478 | $ 2,541 | |
| Total Assets | $ 4,385 | $ 4,676 | $ 4,934 | |
| Liabilities and Equity | ||||
| Long-term debt | $ 1,486 | $ 1,565 | $ 1,438 | |
| Project debt | $ 680 | $ 803 | $ 928 | |
| Liabilities held for sale | $ 3 | $ 34 | $ 52 | |
| Total Liabilities | $ 3,297 | $ 3,517 | $ 3,517 | |
| Total Covanta Holding Corporation stockholders’ equity | $ 1,083 | $ 1,126 | $ 1,383 | |
|
(In millions, except per share amounts)
For the Years Ended December 31, |
||||
| 2011 | 2010 | 2009 | ||
| Continuing Operations-Diluted Earnings Per Share | $ 0.56 | $ 0.19 | $ 0.39 | |
| Reconciling Items | (0.04) | 0.23 | — | |
| Adjusted EPS | $ 0.52 | $ 0.42 | $ 0.39 | |
| Reconciling Items | ||||
| Loss on extinguishment of debt | $ 1 | $ 15 | $ — | |
| Effect on income of derivative instruments not designated as hedging instruments | (2) | (1) | (7) | |
| Effect of foreign exchange loss on indebtedness | 4 | — | — | |
| Gain on sales of businesses | (9) | — | — | |
| Transaction-related costs | — | — | 6 | |
| Development costs | 5 | — | — | |
| Contractual liability to pre-petition creditors | 15 | — | — | |
| Non-cash write-down of loan issued for the Harrisburg EfW facility to fund certain facility improvements | — | 7 | — | |
| Non-cash write-down of capitalized costs related to the Dublin development project | — | 23 | — | |
| Non-cash write-down of corporate real estate | — | 3 | — | |
| Total Reconciling Items, pre-tax | 14 | 47 | (1) | |
| Pro forma income tax impact | 3 | (9) | — | |
| Grantor trust activity | 1 | (2) | 1 | |
| Reversal of uncertain tax positions related to pre-emergence tax matters | (24) | — | — | |
| Total Reconciling Items, net of tax | $ (6) | $ 36 | $ — | |
| Diluted Earnings Per Share Impact | $ (0.04) | $ 0.23 | $ — | |
| Weighted Average Diluted Shares Outstanding | 142 | 154 | 155 | |
|
(In millions)
For the Years Ended December 31, |
||||
| 2011 | 2010 | 2009 | ||
| Net Income from Continuing Operations Attributable to Covanta Holding Corporation | $ 79 | $ 30 | $ 61 | |
| Depreciation and amortization expense | 193 | 190 | 197 | |
| Debt service: | ||||
| Net interest expense on project debt | 31 | 38 | 45 | |
| Interest expense | 67 | 45 | 38 | |
| Non-cash convertible debt related expense | 25 | 39 | 24 | |
| Investment income | (1) | (1) | (2) | |
| Subtotal debt service | 122 | 121 | 105 | |
| Income tax expense (adjusted for reversal of uncertain tax positions related to pre-emergence tax matters in 2011) | 52 | 24 | 42 | |
| Reversal of uncertain tax positions related to pre-emergence tax matters | (24) | — | — | |
| Contractual liability to pre-petition creditors | 15 | — | — | |
| Write-down of assets | — | 34 | — | |
| Development costs | 5 | — | — | |
| Loss on extinguishment of debt | 1 | 15 | — | |
| Gain on sale of business | (9) | — | — | |
| Net income attributable to noncontrolling interests in subsidiaries | 5 | 5 | 4 | |
| Other adjustments: | ||||
| Debt service billings in excess of revenue recognized | 22 | 29 | 20 | |
| Non-cash compensation expense | 18 | 17 | 14 | |
| Other non-cash items | 13 | 5 | 11 | |
| Subtotal other adjustments | 53 | 51 | 45 | |
| Total adjustments | 413 | 440 | 393 | |
| Adjusted EBITDA-Continuing Operations | $ 492 | $ 470 | $ 454 | |
|
(In millions)
For the Years Ended December 31, |
|||||
| 2011 | 2010 | 2009 | |||
| Cash flow provided by operating activities from continuing operations | $ 360 | $ 392 | $ 352 | ||
| Less: Maintenance capital expenditures(B) | (80) | (74) | (52) | ||
| Free Cash Flow from Continuing Operations | $ 280 | $ 318 | $ 300 | ||
| Weighted Average Diluted Shares Outstanding | 142 | 154 | 155 | ||
Selected Uses of Free Cash Flow from Continuing Operations: |
|||||
| Investments: | |||||
| Acquisition of businesses, net of cash acquired | $ (10) | $ (130) | $ (266) | ||
| Non-maintenance capital expenditures | (38) | (41) | (22) | ||
| Acquisition of land use rights | (8) | (19) | — | ||
| Acquisition of noncontrolling interest in subsidiaries | — | (2) | (24) | ||
| Purchase of equity interests | — | — | (9) | ||
| Other investing activities, net | (12) | (21) | (14) | ||
| Total investments | $ (68) | $ (213) | $ (335) | ||
| Return of Capital to Stockholders: | |||||
| Cash dividends paid to stockholders | $ (32) | $ (233) | $ — | ||
| Common stock repurchased | (229) | (95) | — | ||
| Total return of capital to stockholders | $ (261) | $ (328) | $ — | ||
| Capital Raising Activities: | |||||
| Net proceeds from issuance of corporate debt(C) | $ — | $ 390 | $ 388 | ||
| Net proceeds from issuance of project debt(D) | 15 | 10 | (5) | ||
| Net proceeds from asset sales | 12 | 12 | — | ||
| Other financing activities, net | (1) | 27 | 36 | ||
| Net proceeds from capital raising activities | $ 26 | $ 439 | $ 419 | ||
| Debt Repayments: | |||||
| Net cash used for scheduled principal payments on project debt(E) | $ (99) | $ (170) | $ (121) | ||
| Net cash used for scheduled principal payments on long-term debt | (7) | (7) | (7) | ||
| Optional repayment of corporate debt | (32) | (313) | — | ||
| Fees incurred for debt redemption | — | (2) | — | ||
| Total debt repayments | $ (138) | $ (492) | $ (128) | ||
| Purchases of Property, Plant and Equipment: | |||||
| Maintenance capital expenditures(B) | $ (80) | $ (74) | $ (52) | ||
| Capital expenditures associated with construction | (16) | (21) | (13) | ||
| Capital expenditures associated with technology development | (6) | (6) | (5) | ||
| Capital expenditures associated with organic growth initiatives | (4) | — | — | ||
| Capital expenditures-other | (12) | (14) | (4) | ||
| Total purchase of property, plant and equipment | $ (118) | $ (115) | $ (74) | ||
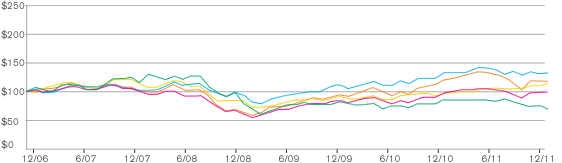
The following transitional graph sets forth a comparison of the yearly percentage change in the Company’s cumulative total stockholder return on common stock with the Standard and Poor’s Midcap 400 Index*, the Dow Jones US Electricity Index** and the Dow Jones Waste & Disposal Services Index**. Because the Standard and Poor’s Midcap 400 Index* provides a more appropriate broad-based index comparison for our performance graph than the Standard & Poor’s 500 Stock Index*, it will replace the Standard & Poor’s 500 Stock Index in future graphs. We have added the Dow Jones US Electricity Index** to provide an added point of comparison for our business. The foregoing cumulative total returns are computed assuming (a) an initial investment of $100, and (b) the reinvestment of dividends at the frequency which dividends were paid during the applicable years. The graph below reflects comparative information for the five fiscal years beginning with the close of trading on December 31, 2006 and ending December 31, 2011.
The stockholder return reflected below is not necessarily indicative of future performance.
Comparison of Five Year Cumulative Total Return
Assumes Initial Investment of $100
 Covanta Holding Corporation
 Dow Jones US Electricity Index
  Standard & Poor’s 500 Stock Index
 S&P Midcap 400 Index
 Dow Jones US Waste & Disposal Index
