Chairman's Letter
“Our goal for
post-
separation MetLife is to be a company that can perform well in a variety of macroeconomic environments.” To My Fellow Shareholders:
MetLife is in the midst of the most dramatic transformation in its history. For many years, we wrote business that looked attractive on a GAAP1 basis but depended on assumptions holding up over many years in a variety of economic environments. However, as the industry has learned, life insurance is a complex business in which assumptions don't always prove out. It would be easy to generate higher GAAP earnings over the near term by selling products with uncertain long-term economics. MetLife is shifting away from this way of doing business. We believe it is in the best interest of our shareholders to pursue strategic initiatives that will drive true economic value, or cash. MetLife has been moving in this direction since 2012, but the refreshed enterprise strategy we launched in November 2016 made the lines of demarcation even clearer. Under our strict new capital budgeting process, we will only fund businesses that prioritize strong risk-adjusted internal rates of return, lower capital intensity, and most important, a higher ratio of free cash flow to operating earnings.2 As I wrote last year, “Where GAAP can be opaque, cash is clear — a dollar of free cash flow is always available for dividends, share repurchases, and acquisitions.” MetLife's Board of Directors has reviewed and overseen our refreshed strategy throughout the process. In addition, in February of 2017, the Board conducted a deep dive examination of the strategy and our goals for increasing shareholder value. The centerpiece of our transformation remains the separation of a substantial portion of our U.S. retail business, which we have named Brighthouse Financial. Post-separation, we believe Brighthouse Financial and MetLife will offer investors unique value propositions. As a largely pure-play U.S. retail life and annuity manufacturer, we believe Brighthouse Financial will benefit from rising interest rates and equity markets. Our goal for post-separation MetLife is to be a company that can perform well in a variety of macroeconomic environments. The separation is only the latest in a series of steps we have taken to reduce capital intensity and increase free cash flow. We have exited the market for long-term care and universal life with lifetime secondary guarantees. We have redesigned and reduced the risk in our variable annuity products. And we have acquired and built fee-based businesses in ProVida and MetLife Investment Management, respectively. The changes we are making and will continue to make provide a clear path to our future as a simpler company with less market sensitivity and better cash flow. Our 2016 Financial Performance
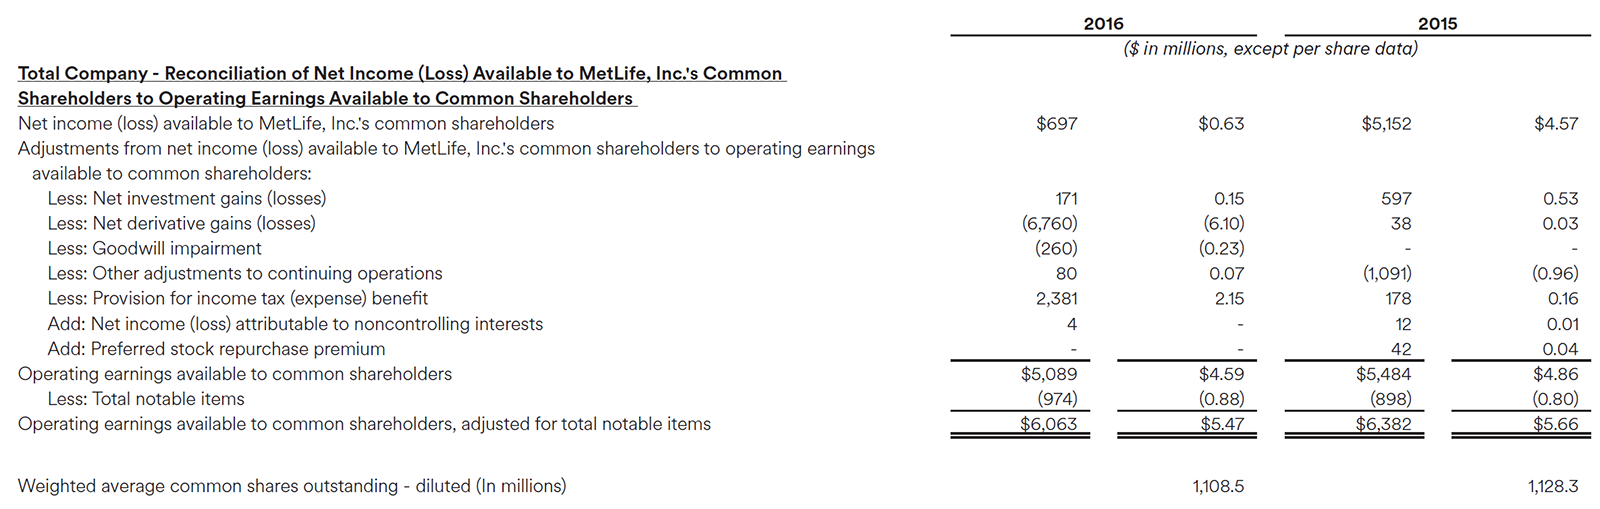
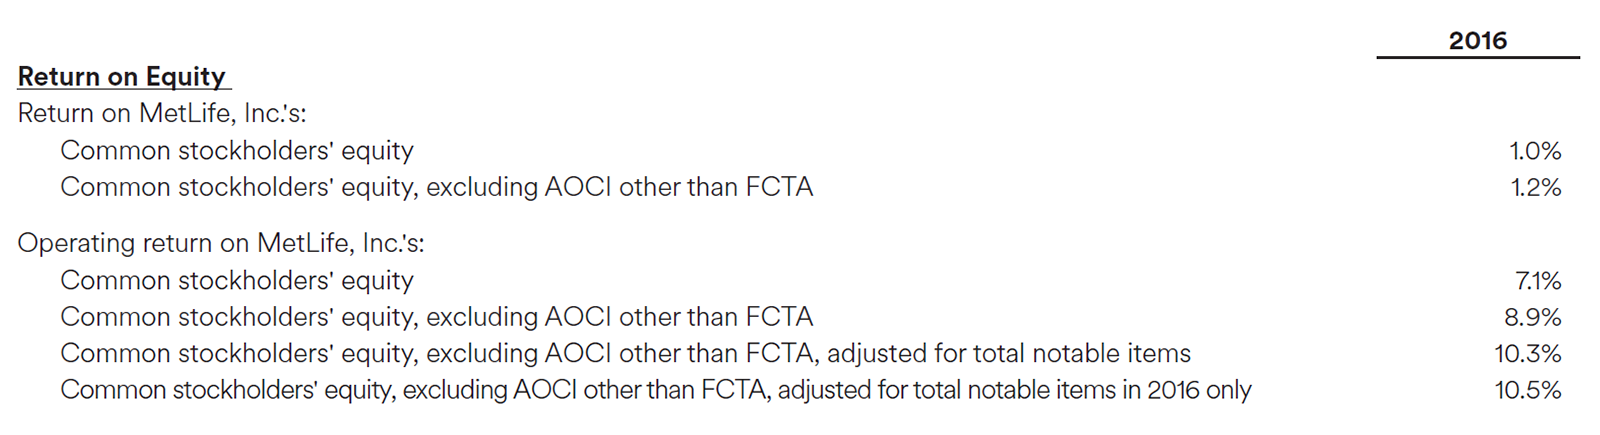
In 2016, the life insurance industry faced continued pressure from low interest rates, with the 10-year Treasury yield hitting an all-time low of 1.36 percent. Along with many other financial services firms, pension funds and retirees, MetLife was pressured by low rates in 2016. Operating earnings per share2 were $4.59, down 6 percent from 2015, and our operating return on equity2 (ROE) was 8.9 percent.3 A little more than a year ago, we announced our intention to separate a substantial portion of our U.S. retail business. In 2016, we took risk-management actions to safeguard our ability to execute the separation regardless of the interest rate environment. These actions contributed to asymmetrical and non-economic accounting losses. For much of 2016, we faced the risk that further declines in interest rates could have required additional capital contributions to Brighthouse Financial, potentially putting the separation in jeopardy. While the accounting losses were unwelcome, they should be viewed in the context of our determination to complete our transformation into a company that generates strong and sustainable free cash flow. Aside from low interest rates, the other macroeconomic factor weighing on our 2016 results was the strong U.S. dollar, which negatively impacted our international earnings. MetLife's non-U.S. businesses tend to be lower risk and higher growth, and we believe the earnings and cash flow they produce adequately compensate shareholders for currency fluctuations. Adjusting for all notable items in both periods, MetLife's operating earnings2 were down 5 percent in 2016 relative to 2015. Our operating return on equity, after adjusting for total notable items in 2016 only,2 was 10.5 percent,3 consistent with our target of an 8 to 9 percent spread over the 10-year Treasury yield.
“The most
important
development
in 2016 was the
completion of
our refreshed
enterprise
strategy.”
Highlights from the Year
The most important development in 2016 was the completion of our refreshed enterprise strategy. The strategy we rolled out in 2012 was correct directionally, but it assumed interest rates would revert to levels more in line with pre-2008 levels within a few years. As rate normalization kept receding over the horizon, we knew we needed to take bolder action. I have been asked if the 2016 election and the resulting rise in interest rates make our shift away from market-sensitive products no longer necessary. Not in my view. The average yield on the 10-year Treasury over the past 50 years was 6.5 percent, still significantly higher than today's rates. In addition, structural changes in the U.S. economy suggest we are unlikely to return to the lofty yields of earlier periods. I certainly hope that interest rates continue to rise from today's artificially low levels, but even if they do, we are not going to write business that might hurt us in an even lower rate environment.
“Our new
tagline —
‘Navigating Life
Together’ —
embodies
the trusted
partnership
our corporate
and individual
customers across
the globe tell us
they want from
MetLife.”
MetLife logged a number of additional achievements in 2016:
“Among large
employers, we
will continue to
grow [our Group
Benefits business]
through new
product offerings
and increased
employee
elections
of voluntary
benefits.”
2017: A Turning Point
We believe 2017 will be a pivotal year in MetLife's transformation. Once the separation is complete, investors will have a clearer picture of the company we are becoming. At our core will be the Group Benefits business in the United States, which MetLife pioneered 100 years ago when we first began offering this form of coverage to employers. MetLife is the leading player in group benefits, with a market share of 25 percent among large employers. Overall, we provide insurance and benefits to 40 million workers at 50,000 businesses. Among large employers, we will continue to grow through new product offerings and increased employee elections of voluntary benefits. We also plan to achieve solid growth in the mid-size and small business markets. If U.S. economic growth accelerates, it will lead to gains in wages and total employment, both of which will drive growth in the group business. Our non-U.S. businesses will continue to combine growth with lower capital intensity. Our decision last year to stop selling yen-denominated whole life products in Japan and shift our business mix to U.S. and Australian dollar-denominated alternatives represents the kind of value-creating choices we are making across all our markets. In the U.S. and abroad, we will continue to allow our older, more capital intensive liabilities to run off. As part of our restructuring to prepare for the Brighthouse Financial separation, we established MetLife Holdings as a new reporting segment to manage the U.S. portion of these liabilities. We intend to manage our closed blocks of business aggressively to reduce volatility, accelerate the appropriate release of capital and reserves, and improve distributable cash flow. From an expense perspective, we will be a far more efficient company as our technology investments yield permanent cost savings. From 2016 through 2019, we plan to invest $1 billion in efficiency enhancements. This will be more than offset by the $800 million in pre-tax annual run rate savings we expect to generate in 2020 and beyond.
“The U.S. federal
regulatory
outlook is now
more positive
than it has been in
nearly a decade.”
Focus on the Policy Environment
Free-market capitalism remains the greatest system of wealth creation the world has ever known. Private individuals and companies, with proper incentives, will drive economic growth, create jobs, and increase living standards. The role of government is to protect consumers while preserving the ability of businesses to compete. The strong regulatory upsurge since 2008 was understandable but, in my judgment, excessive. In the pro-regulatory climate that prevailed in the wake of the financial crisis, the benefits of additional regulation were given greater weight than the costs, and a single-minded focus on financial safety crowded out consideration of economic growth. More recently, it has become clear that Americans are deeply frustrated with an economy that has failed to live up to its potential, and the pendulum appears to be swinging in a more favorable direction. The U.S. federal regulatory outlook is now more positive than it has been in nearly a decade. After years of facing the prospect of costly and duplicative regulation, we believe MetLife will return to a level playing field with others in the life insurance industry — whether through judicial, administrative, or legislative means. The prospect for pro-growth tax reform has also brightened. This is a once-in-a-generation opportunity that we should not miss. Our view is that as long as tax reform does not pose a fundamental risk to our business model, we will be supportive. If every company and every industry views its tax preferences as sacred, reform will be impossible. We are also optimistic that reducing the U.S. corporate income tax rate, which is the highest in the developed world, will make U.S. companies more competitive globally. With regard to infrastructure, the United States has a significant opportunity to upgrade aging systems and boost the economy's productive capacity. MetLife is one of the world's largest institutional infrastructure investors, originating $5.3 billion in infrastructure debt in 2016 and growing our portfolio to nearly $44 billion overall. We believe public-private partnerships, properly structured, can play a meaningful role in rebuilding America's infrastructure. Finally, a word on monetary policy. I first highlighted the unintended consequences of artificially low interest rates in my 2012 chairman's letter, calling them “a form of taxation on savers and a subsidy to borrowers.” Those words are no less true today. The time is long past due for the Federal Reserve to fully normalize U.S. monetary policy. Environmental, Social and Governance Performance
Investors are increasingly focused on how companies perform on a range of environmental, social and governance (ESG) factors, and this is an area where MetLife recorded a number of notable achievements in 2016:
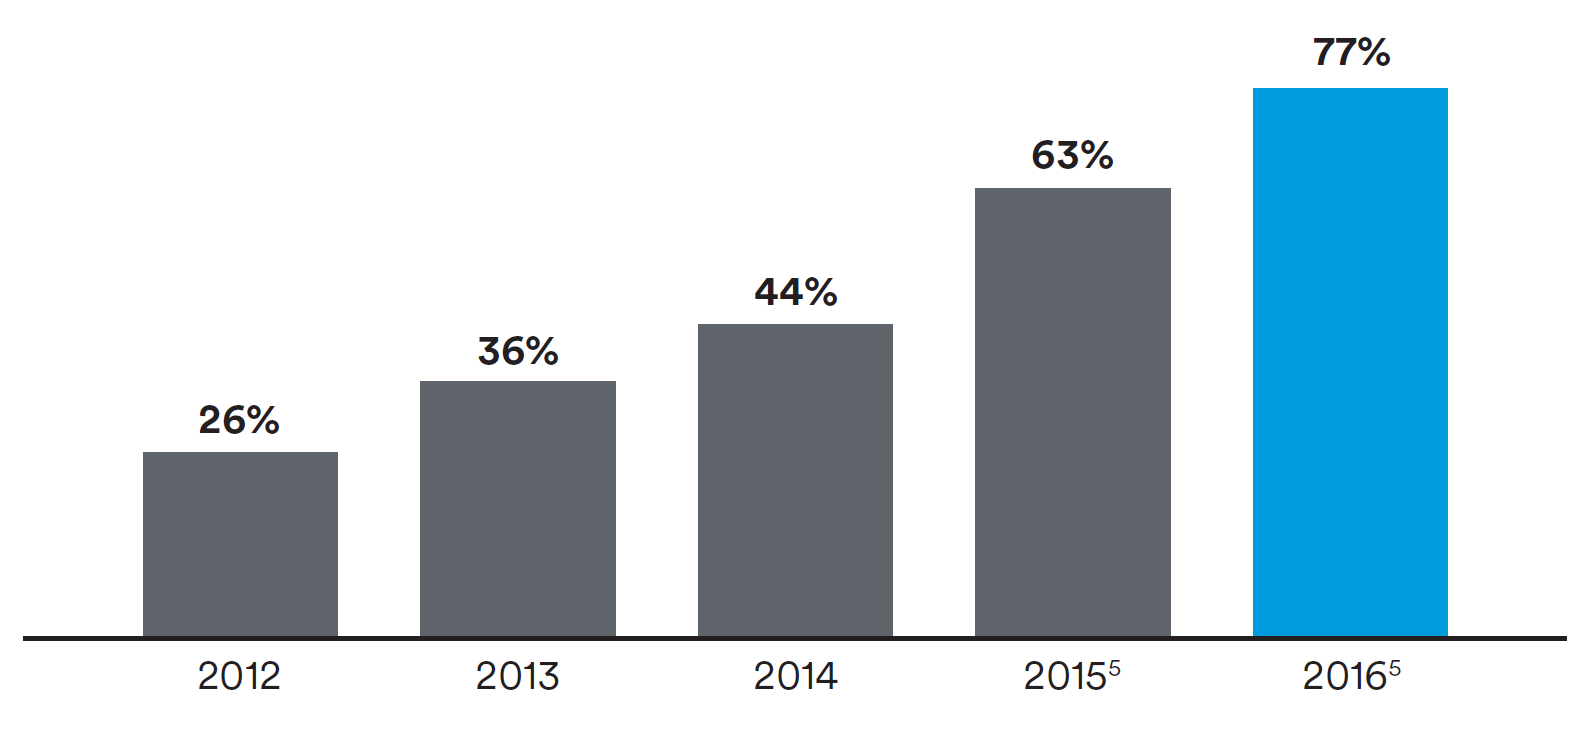
“In 2016, after
normalizing for
a few factors
including the
separation,
MetLife achieved a
free cash flow ratio
of 77 percent.”
Delivering Value to Shareholders
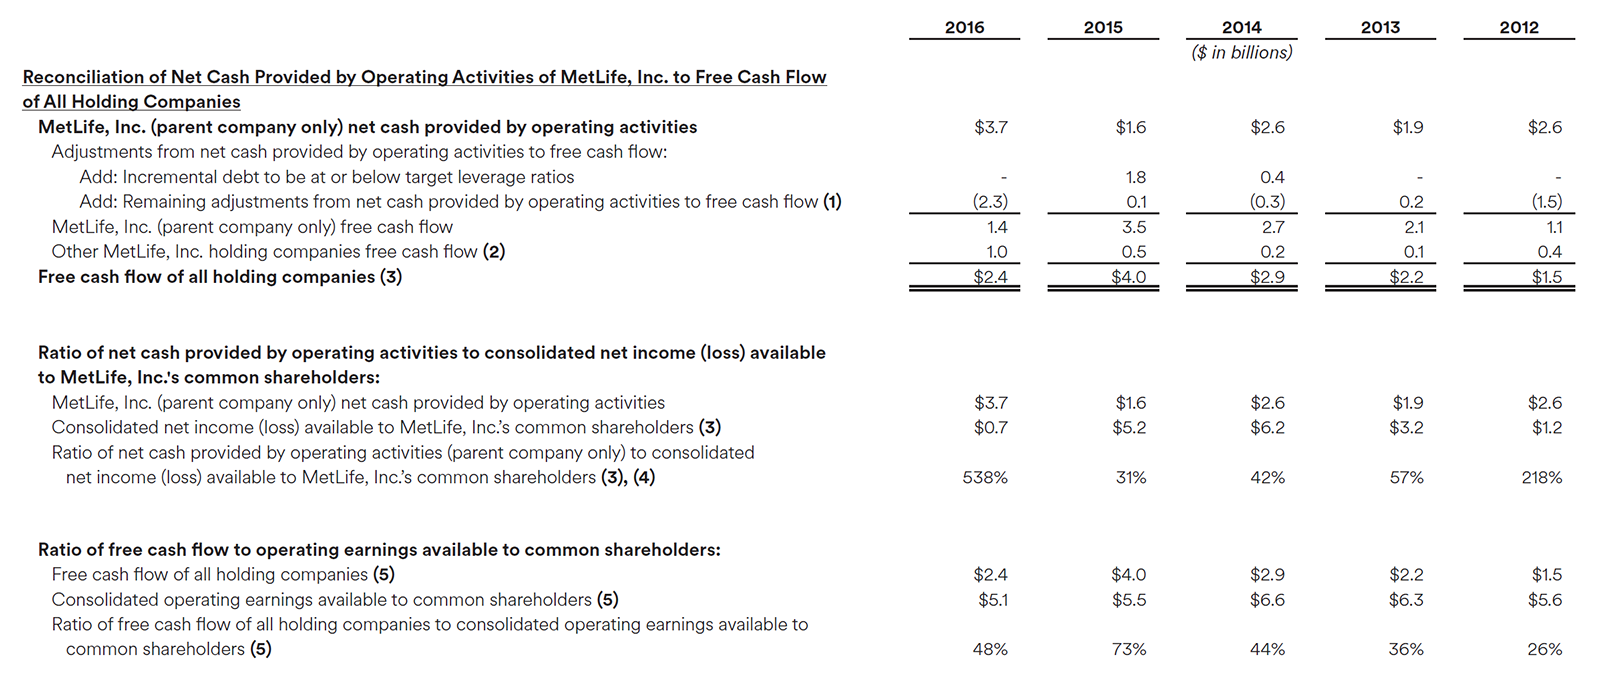
In 2012, my first full year as MetLife's CEO, the company generated a free cash flow to operating earnings ratio of 26 percent. This low ratio was consistent with MetLife's track record since its demutualization. Over the course of my tenure as CEO, MetLife has generated increasingly higher free cash flow ratios. In 2016, after normalizing for a few factors including the separation, MetLife achieved a free cash flow ratio of 77 percent. We are targeting a ratio — on average over the next two years — of 65 to 75 percent.4 Free Cash Flow as a Percentage of Operating Earnings
“For 2017, we
are on track to
return close to
$4.5 billion of
capital to our
shareholders.”
We believe this commitment represents one of the highest free cash flow ratios in the life insurance industry. Free cash offers a simple and tangible way to measure our ability to generate value for MetLife shareholders. Everything we do is viewed through the lens of long-term shareholder value creation. We seek to write business that generates an appropriate risk-adjusted return on capital with a reasonable payback period. We view capital as a precious commodity. If we are able to find attractive organic growth opportunities, we will pursue them. If strategic acquisitions with returns above an appropriate risk-adjusted hurdle rate are available, we will consider them. If not, we will return excess capital to its rightful owners — our shareholders — in the form of common stock dividends and share repurchases. Consistent with this commitment, we intend to maintain the MetLife, Inc. common stock annual dividend at $1.60 per share after the separation of Brighthouse Financial, and grow it over time. In the fall of 2016, our Board of Directors adopted a $3 billion share repurchase authorization, the largest in our history. For 2017, we are on track to return close to $4.5 billion of capital to our shareholders. A Final Word
I would like to conclude by letting MetLife's employees know how grateful I am for their efforts. The work of transforming a company is hard, and the pay-off does not happen overnight. We have made tremendous progress on our enterprise strategy, but we still have much to do. Together, I am confident we will complete the transformation of MetLife into a company that creates significant value for all of its stakeholders. Sincerely,
Forward-Looking Statements
This Chairman's Letter may contain or incorporate by reference information that includes or is based upon forward-looking statements within the meaning of the Private Securities Litigation Reform Act of 1995. Forward-looking statements give expectations or forecasts of future events. These statements can be identified by the fact that they do not relate strictly to historical or current facts. They use words such as “anticipate,” “estimate,” “expect,” “project,” “intend,” “plan,” “believe,” “will,” “goal,” “transform” and other words and terms of similar meaning, or that are tied to future periods, in connection with a discussion of future operating or financial performance. In particular, these include statements relating to future actions, prospective services or products, future performance or results of current and anticipated services or products, sales efforts, expenses, the outcome of contingencies such as legal proceedings, trends in operations and financial results. Any or all forward-looking statements may turn out to be wrong. They can be affected by inaccurate assumptions or by known or unknown risks and uncertainties. Many such factors will be important in determining the actual future results of MetLife, Inc., its subsidiaries and affiliates. These statements are based on current expectations and the current economic environment. They involve a number of risks and uncertainties that are difficult to predict. These statements are not guarantees of future performance. Actual results could differ materially from those expressed or implied in the forward-looking statements. Risks, uncertainties, and other factors that might cause such differences include the risks, uncertainties and other factors identified in MetLife, Inc.'s most recent Annual Report on Form 10-K (the “Form 10-K”) filed with the U.S. Securities and Exchange Commission (the “SEC”), any Quarterly Reports on Form 10-Q filed by MetLife, Inc. with the SEC after the date of the Form 10-K under the captions “Note Regarding Forward-Looking Statements” and “Risk Factors,” and other filings MetLife, Inc. makes with the SEC. MetLife, Inc. does not undertake any obligation to publicly correct or update any forward-looking statement if MetLife, Inc. later becomes aware that such statement is not likely to be achieved. Please consult any further disclosures MetLife, Inc. makes on related subjects in reports to the SEC. Non-GAAP and Other Financial Disclosures
In this Chairman's Letter, MetLife presents certain measures of its performance that are not calculated in accordance with accounting principles generally accepted in the United States of America (GAAP). MetLife believes that these non-GAAP financial measures enhance the understanding of MetLife's performance by highlighting the results of operations and the underlying profitability drivers of the business. The following non-GAAP financial measures should not be viewed as substitutes for the most directly comparable financial measures calculated in accordance with GAAP:
Reconciliations of these non-GAAP measures to the most directly comparable historical GAAP measures are included in this section. Reconciliations of these non-GAAP measures to the most directly comparable GAAP measures is not accessible on a forward-looking basis because we believe it is not possible without unreasonable efforts to provide other than a range of net investment gains and losses and net derivative gains and losses, which can fluctuate significantly within or outside the range and from period to period and may have a material impact on net income. MetLife's definitions of the various non-GAAP and other financial measures discussed in this Chairman's Letter may differ from those used by other companies: Operating earnings and related measures:
These measures are used by management to evaluate performance and allocate resources. Consistent with GAAP guidance for segment reporting, operating earnings is also MetLife's GAAP measure of segment performance. Operating earnings and other financial measures based on operating earnings are also the measures by which MetLife senior management's and many other employees' performance is evaluated for the purposes of determining their compensation under applicable compensation plans. Operating earnings and other financial measures based on operating earnings allow analysis of our performance relative to our business plan and facilitate comparisons to industry results. Operating earnings is defined as operating revenues less operating expenses, both net of income tax. Operating earnings available to common shareholders is defined as operating earnings less preferred stock dividends. Operating revenues and operating expenses These financial measures, along with the related operating premiums, fees and other revenues, focus on our primary businesses principally by excluding the impact of market volatility, which could distort trends, and revenues and costs related to non-core products and divested businesses and certain entities required to be consolidated under GAAP. Also, these measures exclude results of discontinued operations and other businesses that have been or will be sold or exited by MetLife and are referred to as divested businesses. In addition, for the year ended December 31, 2016, operating revenues and operating expenses exclude the financial impact of converting MetLife's Japan operations to calendar-year end reporting without retrospective application of this change to prior periods and is referred to as lag elimination. Operating revenues also excludes net investment gains (losses) (NIGL) and net derivative gains (losses) (NDGL). Operating expenses also excludes goodwill impairments. The following additional adjustments are made to revenues, in the line items indicated, in calculating operating revenues:
The following additional adjustments are made to expenses, in the line items indicated, in calculating operating expenses:
Operating earnings also excludes the recognition of certain contingent assets and liabilities that could not be recognized at acquisition or adjusted for during the measurement period under GAAP business combination accounting guidance. The tax impact of the adjustments mentioned above are calculated net of the U.S. or foreign statutory tax rate, which could differ from the Company's effective tax rate. Additionally, the provision for income tax (expense) benefit also includes the impact related to the timing of certain tax credits, as well as certain tax reforms. Return on equity, allocated equity, tangible equity and related measures:
The above measures represent a level of equity consistent with the view that, in the ordinary course of business, we do not plan to sell most investments for the sole purpose of realizing gains or losses. Also refer to the utilization of operating earnings and other financial measures based on operating earnings mentioned above. The following additional information is relevant to an understanding of MetLife's performance results:
| ||||||||||||||||||||||||||||||||||||||||||||||||||||||||||||||||||||||||||||||||||||||||||||||||||||||||||||||||||||||||||||||||||||||||||||||||||||||||||||||||||||||||||||||||||||||||||||||||||||||||||||||||||||||||||||||||||||||||||||||||||||||||||||||||||||||||||||||||||||||||||||||||||||||||||||||||||||||||||||||||||||||||||||||||||||||||||||||||||||||||||||||||||||||||||||||||||||||||||||||||||||||||||||||||||||||||||||||||||||||||||||||||||||||||||||||||||||||||||||||||||||||||||||||||||||||||||||||||