Chairman’s Letter
To My Fellow Shareholders:
Over the past seven years, MetLife has faced three main challenges it needed to overcome to create value for shareholders. The first was regulatory. The designation of MetLife as a systemically important financial institution (SIFI) was potentially an existential threat to the company. Only three out of roughly 800 U.S. life insurance companies were named SIFIs, and the possibility of bank-like capital requirements could have rendered entire product lines uncompetitive. Our 2016 federal court victory, sealed this January when the government dropped its appeal of the decision, means the Financial Stability Oversight Council has a high bar to clear if it ever tries to re-designate MetLife. The second challenge was macroeconomic. When MetLife announced its new strategy in May of 2012, we assumed that historically low interest rates would continue for a period of time but then return to more normal levels. It turns out we were overly optimistic. Our strategy refresh, announced in November of 2016, has made our pivot toward protection and fee-based products even stronger. Our view is that interest rates will drift higher but will not return to pre-crisis levels for the foreseeable future. We are confident that MetLife’s strategy will position us to perform well in any economic environment. Our third—and current—challenge is operational. The issue in our group annuity business was an operational failure that never should have happened. Nor was it the first negative surprise in recent years. Some of the company’s challenges have their roots in business written decades ago, but others occurred on the watch of this management team. Strengthening the company’s ability to execute is critical if we are going to deliver better returns to shareholders. The Board of Directors shares this view and is actively involved in overseeing management’s actions to improve operational performance.
“The year
2017 was one
of the most
transformational
in MetLife’s
history.”
2017 Year in Review
The year 2017 was one of the most transformational in MetLife’s history. The spinoff of our U.S. retail business, which dated to the company’s founding in 1868, was the centerpiece of our strategy to become a simpler, less capital intensive company with stronger free cash flow. Just as we made a bold move to solve our regulatory challenge, we made an equally bold move to overcome our macroeconomic challenge. We do not know when the next economic downturn will come, but we do know that MetLife will be better equipped to weather the storm. As part of our transformation, we have also been eager to grow our fee-based businesses such as MetLife Investment Management (MIM), which provides fixed income and real estate asset management services to institutional clients. Our acquisition of Logan Circle Partners, L.P., has added $38.5 billion1 to MIM’s assets under management and given our domestic and international clients a broader set of investment solutions while significantly enhancing our distribution reach. Asset management remains one of our top growth priorities, both organically and—when attractive opportunities are available—through acquisitions.
“Strong
free-cash-flow
generation
capacity helped
us return
$4.6 billion to
shareholders—a record for
MetLife—through
dividends
and share
repurchases.”
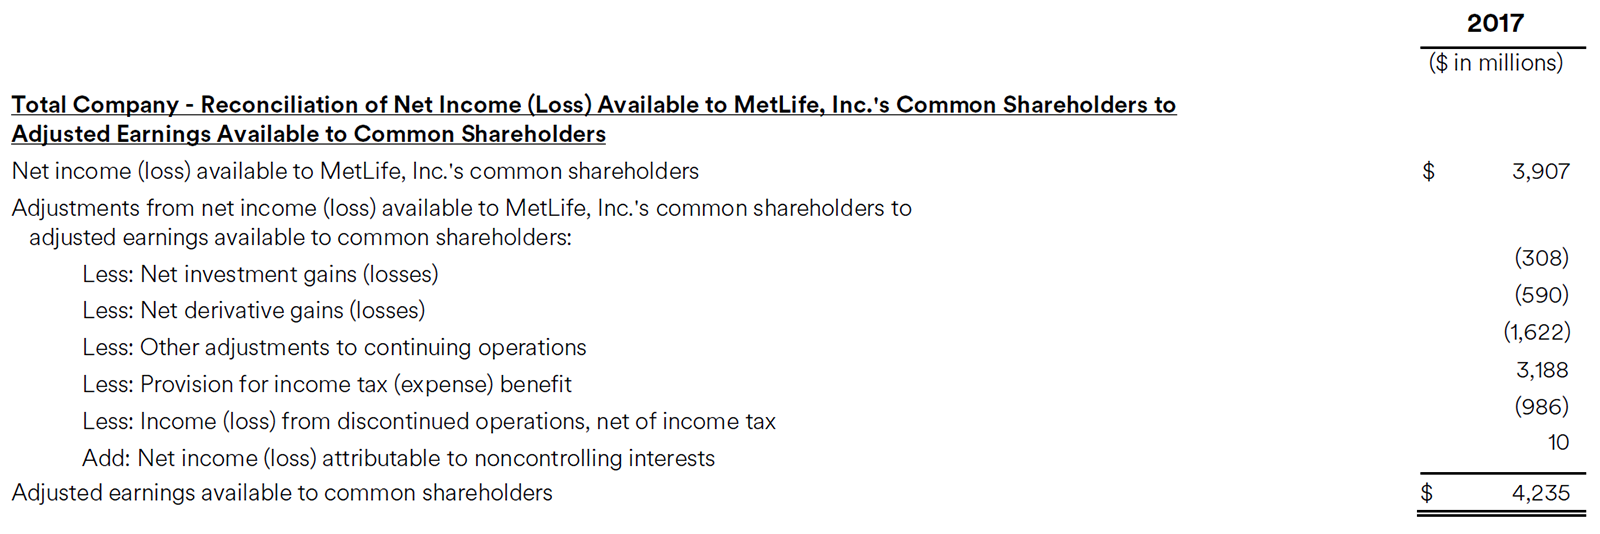
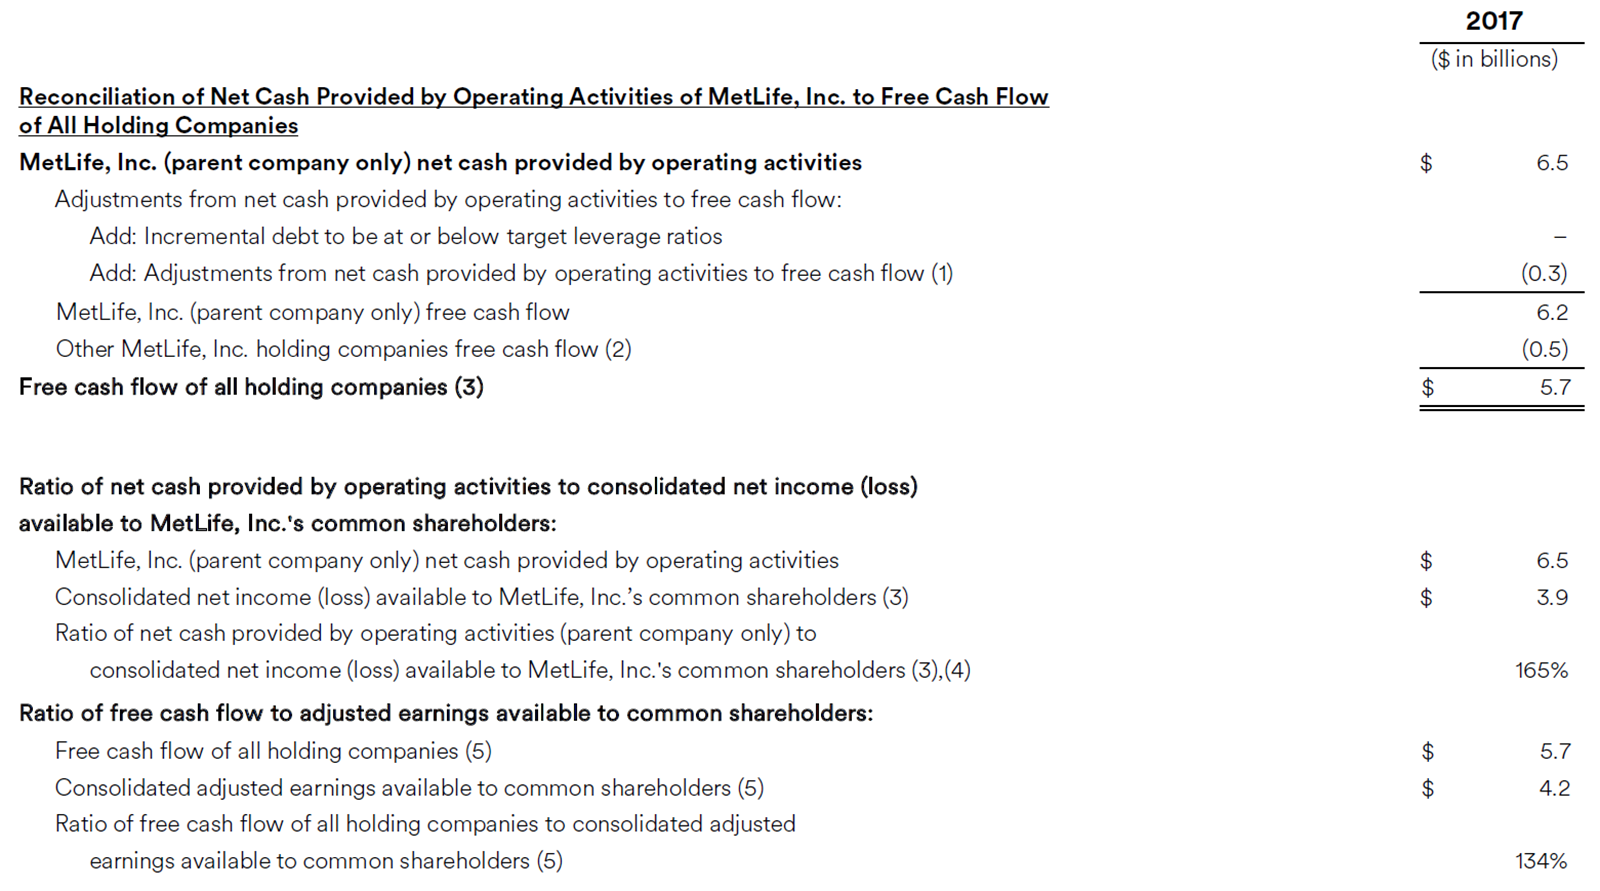
MetLife’s overall financial performance in 2017 was solid. We grew adjusted earnings per share by 8 percent. Our ratio of free cash flow to adjusted earnings came in at 75 percent2, the top end of our target range. This strong free-cash-flow generation capacity helped us return $4.6 billion to shareholders—a record for MetLife—through dividends and share repurchases. Overall since 2014, MetLife has returned $12.8 billion in capital to shareholders, or an average of $3.2 billion per year. Our philosophy on capital management has remained consistent over time. If we have attractive organic opportunities to fund, we will do so—and in fact, we have invested roughly $3 billion in our businesses in each of the past several years. If we have attractive M&A opportunities that align with us strategically and culturally, we will pursue them. But if organic and inorganic growth cannot clear a risk-adjusted hurdle rate, we will return excess capital to its rightful owners, the shareholders of MetLife. I would like to conclude our review of 2017 with a word about MetLife’s Auto & Home business. Not only did the business end the year on a strong note financially, but our dedicated Auto & Home employees made us all proud to be part of MetLife. In the wake of Hurricanes Harvey and Irma last fall, our claims professionals worked around the clock to restore stability to unsettled lives. Using streamlined procedures that quickly assess the severity of damage, they processed 70 percent of auto claims within 72 hours, and got homeowners paid in half the time it took in previous disasters. Operational Excellence
In other areas, MetLife did not live up to the high standards we set for ourselves. In our Retirement and Income Solutions business, we did not look hard enough for people in the pension plans whose obligations we assumed, and our decision to release the reserves backing those obligations was an error leading to a material weakness in internal control over financial reporting.
“Going forward,
we are re-setting
the bar to
best-in-class
methods to locate
annuitants.”
We are committed to locating and paying, with interest, as many of these group annuity customers as possible. Going forward, we are re-setting the bar to best-in-class methods to locate annuitants. While I wish this issue had been escalated earlier for remediation, MetLife discovered the issue itself, self-reported it to our primary regulator, and is taking all necessary steps to fix it. On the heels of the group annuity issue, we discovered that we were over-reserved for a run-off block of Japanese variable annuities within our MetLife Holdings segment. While the impact on MetLife’s financial results was generally positive, the over-reserving was also an error and led to a second material weakness finding. These errors are unacceptable and underscore why operational improvement is the third major challenge confronting this management team. We are dedicating the resources necessary to strengthen our internal controls and eliminate both material weaknesses as quickly as possible.
“Operationally,
we must have
a culture of
continuous
improvement—and we will.”
My goal for the company, and the goal of this entire management team, is to leave MetLife better than we found it. We are confident that our strict new capital budgeting process will position the company to perform well in any economic environment. Our task now is to insist on that same level of discipline in how we execute. It is not enough for MetLife to have the right strategy. Operationally, we must have a culture of continuous improvement—and we will. This is essential not just to resolve past problems, but to succeed on current and future initiatives. We have committed to our shareholders to achieve $800 million of pre-tax annual run-rate savings, net of stranded overhead, by the year 2020. Having an efficient cost structure will allow us to compete more effectively in the marketplace.
“For MetLife,
making the world
a better place is
the fundamental
purpose of
our business.”
Corporate Responsibility
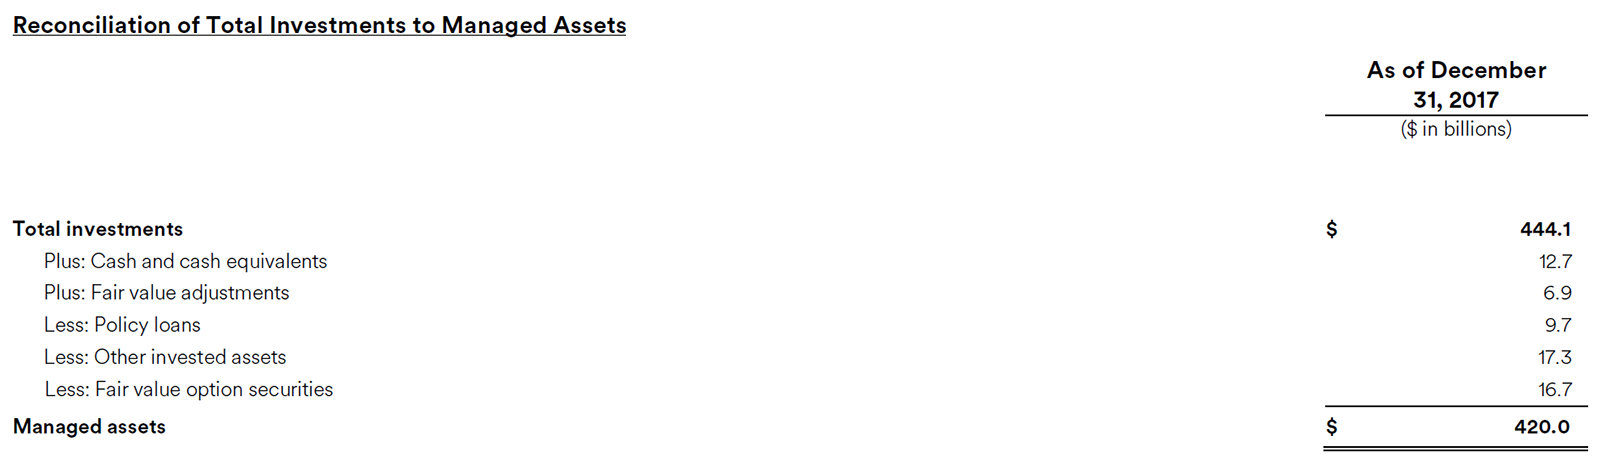
Another area in which we are committed to showing continuous improvement is corporate social responsibility. For MetLife, making the world a better place is the fundamental purpose of our business. On the liability side of our balance sheet, we paid approximately $45 billion to policyholders in 2017. On the asset side of our balance sheet, we fuel economic growth and jobs by investing MetLife’s $420 billion of managed assets in agriculture, infrastructure, real estate and a wide variety of businesses. The very nature of our business creates tremendous social value. Today, investors, regulators, non-governmental organizations and others are looking more closely than ever at how companies perform on a wide range of corporate responsibility measures. Some of our achievements since my last annual letter include:
“To ensure we
have a strategic
and coordinated
approach, we
are creating a
new corporate
responsibility
At MetLife, we are committed to engaging our stakeholders in a constructive way, and we have concluded that we should enhance our corporate responsibility efforts to meet evolving standards. To ensure we have a strategic and coordinated approach, we are creating a new corporate responsibility function to develop an integrated strategy that aligns with our priorities and positions us as a leader in this area. The Public Policy Environment
For the first time since the financial crisis, federal policies related to taxes, regulation and monetary matters have created a tailwind for life insurers. In 2017, I joined with other business leaders in advocating forcefully for tax reform. As I wrote in a September op-ed for The Wall Street Journal: “Done right, tax reform will drive faster economic growth, create additional jobs, and foster a more dynamic economy as capital-allocation decisions are no longer distorted by the tax code.” This is exactly what has happened, with economic growth and job creation both showing healthy gains. At this point fears of high inflation seem misplaced, as discouraged workers are coming off the sidelines and boosting the labor force participation rate. We have also seen a much more balanced approach to regulation and a gradual return to more normal monetary policy, both of which are positive for the financial services industry. One area of concern is trade policy, where the possibility of a trade war has raised fears of retaliation against the United States. MetLife is the largest life insurance provider in Mexico by gross written premium, selling predominantly to government employees. The United States must strike a careful balance on trade policy, recognizing that many U.S. companies benefit greatly under free-trade agreements such as NAFTA. In addition, a trade war could result in investors fleeing to Treasury securities as a safe haven and lead to lower interest rates. Conclusion
Last month, we marked MetLife’s 150th anniversary as a company. We have grown from six employees in a two-room office in lower Manhattan to become one of the world’s leading insurance companies with operations in more than 40 countries. Our history includes a notable legacy of innovation. MetLife was a leader in bringing life insurance to working class customers, in advancing public health and affordable housing, and in developing group insurance and pension products. MetLife’s ownership structure has changed over the years. We began as a stock company, mutualized in 1915, and went public again in 2000. What has remained constant is our focus on creating value for our customers, employees and owners. That is why we are one of only a dozen companies in the Fortune 100® to have survived for 150 years.
“Generations
of MetLife
employees built
this company into
the tremendous
franchise it
is
Generations of MetLife employees built this company into the tremendous franchise it is today, and generations of MetLife employees will follow us. I want them to say that the actions we took, in the second decade of the 21st century, positioned MetLife for another 150 years of success. Sincerely,
Forward-Looking Statements
This Chairman’s Letter may contain or incorporate by reference information that includes or is based upon forward-looking statements within the meaning of the Private Securities Litigation Reform Act of 1995. Forward-looking statements give expectations or forecasts of future events. These statements can be identified by the fact that they do not relate strictly to historical or current facts. They use words such as “anticipate,” “estimate,” “expect,” “project,” “intend,” “plan,” “believe,” “will,” “going to,” “become” and other words and terms of similar meaning, or that are tied to future periods, in connection with a discussion of future operating or financial performance. In particular, these include statements relating to future actions, prospective services or products, future performance or results of current and anticipated services or products, sales efforts, expenses, the outcome of contingencies such as legal proceedings, trends in operations and financial results. Any or all forward-looking statements may turn out to be wrong. They can be affected by inaccurate assumptions or by known or unknown risks and uncertainties. Many such factors will be important in determining the actual future results of MetLife, Inc., its subsidiaries and affiliates. These statements are based on current expectations and the current economic environment. They involve a number of risks and uncertainties that are difficult to predict. These statements are not guarantees of future performance. Actual results could differ materially from those expressed or implied in the forward-looking statements. Risks, uncertainties, and other factors that might cause such differences include the risks, uncertainties and other factors identified in MetLife, Inc.’s most recent Annual Report on Form 10-K (the “Form 10-K”) filed with the U.S. Securities and Exchange Commission (the “SEC”), any Quarterly Reports on Form 10-Q filed by MetLife, Inc. with the SEC after the date of the Form 10-K under the captions “Note Regarding Forward-Looking Statements” and “Risk Factors,” and other filings MetLife, Inc. makes with the SEC. MetLife, Inc. does not undertake any obligation to publicly correct or update any forward-looking statement if MetLife, Inc. later becomes aware that such statement is not likely to be achieved. Please consult any further disclosures MetLife, Inc. makes on related subjects in reports to the SEC. Non-GAAP and Other Financial Disclosures
In this Chairman’s Letter, MetLife presents certain measures of its performance that are not calculated in accordance with accounting principles generally accepted in the United States of America (GAAP). MetLife believes that these non-GAAP financial measures enhance the understanding of MetLife’s performance by highlighting the results of operations and the underlying profitability drivers of the business. The following non-GAAP financial measures should not be viewed as substitutes for the most directly comparable financial measures calculated in accordance with GAAP:
Reconciliations of these non-GAAP measures to the most directly comparable GAAP measures are included in this section. Reconciliations of these non-GAAP measures to the most directly comparable GAAP measures is not accessible on a forward-looking basis because we believe it is not possible without unreasonable efforts to provide other than a range of net investment gains and losses and net derivative gains and losses, which can fluctuate significantly within or outside the range and from period to period and may have a material impact on net income. MetLife’s definitions of the various non-GAAP and other financial measures discussed in this Chairman’s Letter may differ from those used by other companies: Adjusted earnings and related measures
These measures are used by management to evaluate performance and allocate resources. Consistent with GAAP guidance for segment reporting, adjusted earnings is also MetLife’s GAAP measure of segment performance. Adjusted earnings and other financial measures based on adjusted earnings are also the measures by which MetLife senior management’s and many other employees’ performance is evaluated for the purposes of determining their compensation under applicable compensation plans. Adjusted earnings and other financial measures based on adjusted earnings allow analysis of our performance relative to our business plan and facilitate comparisons to industry results. Adjusted earnings is defined as adjusted revenues less adjusted expenses, both net of income tax. Adjusted earnings available to common shareholders is defined as adjusted earnings less preferred stock dividends. Adjusted revenues and adjusted expenses
Adjusted earnings also excludes the recognition of certain contingent assets and liabilities that could not be recognized at acquisition or adjusted for during the measurement period under GAAP business combination accounting guidance. The tax impact of the adjustments mentioned above are calculated net of the U.S. or foreign statutory tax rate, which could differ from the Company’s effective tax rate. Additionally, the provision for income tax (expense) benefit also includes the impact related to the timing of certain tax credits, as well as certain tax reforms. The following additional information is relevant to an understanding of MetLife’s performance results:
| ||||||||||||||||||||||||||||||||||||||||||||||||||||||||||||||||||||||||||||||||||||||||||||||||||||||||