The 2013 results of Intelsat S.A. (“Intelsat” or the “company”) demonstrate the ability of our diversified business to deliver stable and strong cash flows. Full year 2013 included a number of significant strategic accomplishments, including our April 2013 initial public offering (“IPO”), that positioned Intelsat to execute on a two-phase plan for long-term equity growth.
Leveraging our contracted backlog and strong cash flows are important elements of the equity growth plan, in which increasing cash flows in the near-term are used to de-lever our business and create equity value.
| Full Year Total Revenue and Adjusted EBITDA |
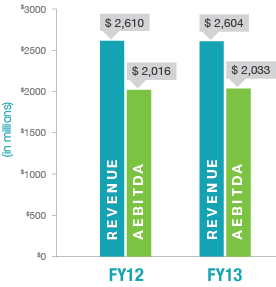 |
For the full year 2013, revenue was $2.604
billion, a less than one half percent decline as compared to full year 2012, in line with our expectations given the loss upon launch of the Intelsat 27 satellite in early 2013. Adjusted EBITDA* for the full year increased by one
percent to $2.033 billion, or 78 percent of revenue, as compared to $2.016 billion, or
77 percent of revenue, in 2012.
Two on-going business trends affected our revenue in 2013, namely reduced U.S. government spending due to budget pressures and reduction of force in Afghanistan, and an intensely competitive environment with respect to network services applications in Africa.
These unfavorable trends more than offset growth in areas such as media services
and aeronautical and maritime broadband mobility applications.
Our IPO, along with several refinancing activities completed in late 2012 and 2013, significantly reduced our debt service obligations, extended our debt maturities, and set the stage for
de-levering that began in 2013 and will continue over the next several years.
| Full Year Basic Diluted EPS and Adjusted EPS |
 |
2013 Financial Highlights include:
- Strong Adjusted EBITDA performance
of 78% of revenue; - Reduced interest expense of $263 million
on an annualized basis, following our
successful debt refinancing transactions
and prepayments of debt in 2013; - Invested $601 million as capital expenditures
for our global telecommunications network,
as we experience lower than normalized
capital expenditures in 2013 and 2014 due
to a natural pause in our fleet replacement requirements; - Use of an insurance claim and our IPO proceeds of approximately $550 million, after discounts and commissions, to repay nearly $500 million in debt;
- Extending our maturity profile, with no significant maturities until 2018.
Over the course of 2013, we reduced our total debt by $617 million. The above performance factors resulted in our business generating $116 million in free cash flow from operations* for the full year 2013, and having an ending cash balance of $248 million as of December 31, 2013.
Our fleet investment program is on track, with the satellites scheduled to enter service in the second half of 2014 through early 2016 expected to provide capacity to catalyze growth for our media and network services businesses and position us to deliver on the organic growth that will enable the second phase of our investment thesis.
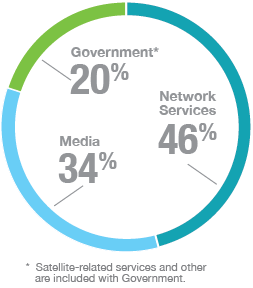
| Revenue Percentage by Customer Set |
 |
Contracted backlog ended the year at $10.1 billion, compared to $10.3 billion at September
30, 2013. Beginning of year backlog for 2014
was $2.1 billion, as compared to $2.3 billion at January 1, 2013. The modest decrease reflects
no sizeable new contracts or renewals naturally occurring during this period, as well as reduced government backlog, reflecting lower business activity from that sector and shorter renewal periods. At 3.9 times trailing annual revenue,
our backlog continues to provide our business
with predictability and visibility into future
cash flow.
Managing Intelsat’s Capital Structure
In 2013, Intelsat completed a number of transactions that improved our capital structure:
- 2013 Intelsat Luxembourg Notes Offerings and Redemptions: On April 5, 2013, our subsidiary, Intelsat Luxembourg S.A. (“Intelsat Luxembourg”,) completed an offering of $3.5 billion aggregate principal amount of Senior Notes, consisting of:
- $500.0 million aggregate principal amount of the Intelsat Luxembourg 6.75% Senior Notes due 2018;
- $2.0 billion aggregate principal amount of the Intelsat Luxembourg 7.75% Senior Notes due 2021; and
- $1.0 billion aggregate principal amount of the Intelsat Luxembourg 8.125% Senior Notes due 2023.
The net proceeds from this offering were used by Intelsat Luxembourg in April 2013 to redeem all $2.5 billion aggregate principal amount of Intelsat Luxembourg’s outstanding 11½%/12 ½% Senior PIK Election Notes and $754.8 million aggregate principal amount of Intelsat Luxembourg’s outstanding 11 ¼% Senior Notes due 2017 (the “2017 Senior Notes”).
- 2013 Intelsat Jackson Notes Offerings, Credit Facility Prepayments and Redemptions: On June 5, 2013, our subsidiary, Intelsat Jackson Holdings S.A. (“Intelsat Jackson”,) completed an offering of $2.6 billion aggregate principal amount of Senior Notes, consisting of:
- $2.0 billion aggregate principal amount of the Intelsat Jackson 5.5% Senior Notes due 2023; and
- $635.0 million aggregate principal amount of the Intelsat Jackson 6.625% Senior Notes due 2022.
The net proceeds from this offering were used by Intelsat Jackson in June 2013 to prepay all $672.7 million of indebtedness outstanding under its New Senior Unsecured Credit Facility, and all $195.2 million of indebtedness outstanding under its Senior Unsecured Credit Facility. The remaining net proceeds were used to redeem the remaining $1.7 billion aggregate principal amount outstanding of the 2017 Senior Notes.
- November 2013 Intelsat Jackson Second Amendment and Joinder Agreement to reduce the interest rates for borrowings and extend the maturity of the Intelsat Jackson Secured Credit Agreement.
With no significant maturities until 2018, Intelsat has been very successful in accessing the very favorable interest rate environment to the benefit of the corporation, providing us with additional flexibility as we continue to execute on our two-phase plan for long-term equity growth.
![]()