|
|
|
|||||
FirstMerit Corporation and Subsidiaries
Selected Financial Data (continued)
|
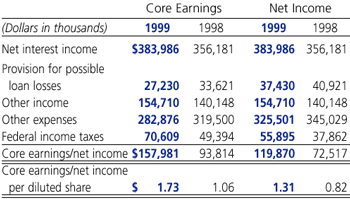
Earnings Summary FirstMerit Corporations core earnings totaled $158.0 million, or $1.73 core earnings per diluted share, excluding mergerrelated and extraordinary charges of $38.1 million, compared with $93.8 million, or $1.06 per diluted share, for 1998, excluding merger-related charges of $21.3 million. The 1998 results also include a $28.9 million pre-tax valuation charge related to residual interest on manufactured housing asset-backed securities. Reported net income for 1999 was $119.9 million, or $1.32 per share, compared with $72.5 million, or $0.82 per share for 1998. These results reflect the restatement of both years financial information to account for the pooling-of-interests acquisitions of Security First Corp. and Signal Corp. The 1998 results also include the earnings of CoBancorp Inc., accounted for as a purchase transaction, from May 22, 1998 through December 31, 1998. The Corporation uses the concept of core earnings to measure the recurring financial results for the periods presented. Excluding the merger-related costs and the extraordinary charge, 1999 returns on average common equity (ROE) and average assets (ROA) were 18.02% and 1.66%, compared with 11.14% and 1.10% for the prior year. Net interest income for 1999 on a fully tax-equivalent basis reached $388.2 million for the year compared to $359.7 million for 1998, an increase of 7.9%. The increase can be attributed to volume gains, where average earning assets increased 11.4%, offset to a lesser degree by increases in funding rates. Adjusted net revenue for 1999 of $534.5 million represents an 8.4% increase from the year earlier level of $493.0 million. Growth in fee income and earning assets more than offset the compression in the net interest margin. Excluding gains from the sale of securities and branches, non-interest income was $146.3 million, a 10.1% increase above the $132.9 million reported the prior year. Fee growth was strong in all categories except loan sales and servicing income, which decreased 54.3% as a result of a decline in the level of mortgage bookings and sales. 1999 fees account for 27.4% of net revenues compared with 27.0% in 1998. Excluding merger-related charges of $33.6 million in 1999 and $17.2 million in 1998, as well as the $8.4 million loss on the sale of a subsidiary in 1998, non-interest expense totaled $282.9 million in 1999 compared with $319.5 million the prior year. The 1998 results include the $28.9 million valuation adjustment of mobile home asset-backed residual interest reported earlier; if excluded, the decline in operating costs would have been 2.6%. On a component basis, improvement was experienced in salary and benefit expense and occupancy costs. Excluding the merger-related costs and the extraordinary expense, the efficiency ratio for 1999 was 50.9% compared to 63.6% in 1998, reflecting general cost declines and the 1998 residual interest valuation charge included in the 1998 calculation. If the residual interest charge was excluded in 1998 costs, the efficiency ratio would have been 57.69% for that period. The 1999 provision for loan losses was $37.4 million compared with a $40.9 million provision the prior year. Net charge-offs as a percentage of average loans were 0.43% for 1999 compared to 0.34% for 1998. At year-ends 1999 and 1998, the allowance as a percent of outstanding loans stands at approximately 1.50%. For both years, non-performing assets as a percent of loans and ORE was 0.36%, and reserve coverage was virtually unchanged at 4.1 times the level of non-performing assets. The following tables summarize the results of core earnings and net income and the changes in core earnings per share, and earnings per share for 1999 and 1998.
|