Financial Highlights
| 1999 52 weeks |
1998 53 weeks |
CHANGE |
|
| (In thousands of dollars except per share items) | |||
| Sales of services | $4,269,113 | $4,092,251 | +4.3% |
| Earnings before income taxes | 143,710 | 143,615 | +0.1% |
| Income taxes | 58,600 | 58,900 | -0.5% |
| Net earnings | 85,110 | 84,715 | +0.5% |
| Basic earnings per share | 2.37 | 2.24 | +5.8% |
| Diluted earnings per share | 2.36 | 2.23 | +5.8% |
| Dividends per share | .95 | .91 | +4.4% |
| Working capital | 284,850 | 293,393 | -2.9% |
| Stockholders' equity | 582,373 | 537,764 | +8.3% |
| Total assets | 1,033,691 | 964,247 | +7.2% |
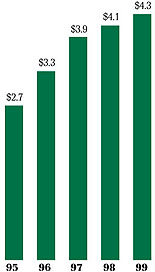 Sales of Services (billions of dollars) |
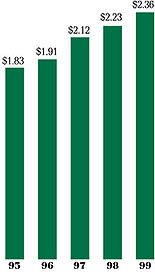 Diluted Earnings Per Share |
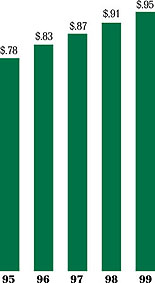 Dividends Per Share |
<< Back | 1999 Annual Report | Next >>