|
Subscribers’ commissions consist of fees which were paid on sales of investment products marketed through IFC and were paid to subscribing (client) institutions. These fees were lower in 2000 due to the sale of IFC at the end of September 2000. Other NIE were lower in 2000 primarily due to decreases in marketing expense, FDIC assessments and professional and outside services fees. The overall reduction of other NIE was a result of cost savings achieved through the Merger. In 1999, NIE were $1.6 billion, an increase of $242.2 million over 1998. Increases occurred across most major categories with the primary increases occurring in merger-related costs, salary and employee benefits expense, subscribers’ commissions, net occupancy expense, and equipment expense. Salaries and employee benefits expense increased in 1999 due primarily to merit increases, higher performance-based compensation and an increase in the number of employees. The increase in performance-based compensation in 1999 correlated directly with improvement in operating earnings and revenues. Investments in technology supporting the consumer, commercial and capital management lines of business resulted in higher equipment expense in 1999 compared to 1998. Net occupancy expense increased in 1999 due to branch expansion in Florida, higher net rent expense and depreciation expense on leasehold improvements. |
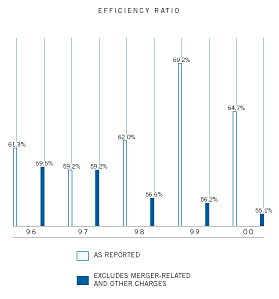
The increase in 1999 subscribers’ commissions reflected higher investment sales volume in 1999 over 1998. Other NIE increased in 1999 due to higher marketing expenses associated with increased promotions and direct marketing projects and costs for other professional and outsourced services. Operating Efficiency Productivity in the banking industry is commonly measured by the operating efficiency ratio. It measures the amount of expense dollars utilized to generate a dollar of revenue. The ratio is calculated by dividing total NIE by the sum of NII, on a taxable equivalent basis, and total NIR. Based on reported earnings, AmSouth’s operating efficiency ratio was 64.7 percent in 2000 compared to 69.2 percent in 1999 and 62.0 percent in 1998. Excluding the revenues and expenses of IFC as well as merger-related and other charges, the efficiency ratio was 53.0 percent in 2000 compared to 53.9 percent in 1999. Improvement in the ratio primarily reflected lower expenses due to synergies created by the Merger. Management’s ability to improve operating efficiency during 2001 will depend upon its ability to meet its revenue growth objectives while maintaining control across all noninterest expense categories. Income Taxes AmSouth’s income tax expense was $125.4 million in 2000, $200.9 million in 1999 and $264.7 million in 1998. The decrease in 2000 and 1999 was the result of lower pretax income. The effective tax rate for 2000 was 27.6 percent compared to 37.1 percent in 1999 and 35.8 percent in 1998. The decrease in the effective tax rate for 2000 is primarily due to the restructuring of a portion of AmSouth’s lease portfolio in 2000 which lowered the effective tax rate on income from leases. In addition, the reduction in the effective tax rate reflected a decrease in nondeductible acquisition cost in 2000 and the increase in the cash surrender value of bank-owned life insurance as compared to 1999. Details of the deferred tax assets and liabilities are included in Note 20 of the Notes to Consolidated Financial Statements. Balance Sheet Analysis |
 |
|