


Annual Report 2012
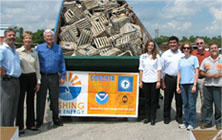
Covanta working with Lee County client and partners in the Fishing for Energy program to remove debris from marine environment.

Employee inspecting material scheduled for assured destruction.

Covanta Onondaga energy-from-waste facility.
Covanta signs new 20 year agreement with Bristol, CT municipalities for sustainable waste disposal.
Our team was exceptionally productive on the many fronts outlined in our Annual Report, and in the face of difficult commodity markets, we managed to maintain our profitability. This strong effort resulted in a handsome return for our shareholders and positioned Covanta for a sustainable and prosperous future.
Continuous improvement is part of our culture, and 2012 was no different. We stepped up our performance, renewing and solidifying our strong client relationships; continuing to advance our world-class safety, environmental and operating performance; executing on our commitment to return capital to our shareholders; and investing in numerous growth initiatives, big and small. We’re confident that with our never-ending drive to strengthen performance and proactively adapt to client needs, technological advances and market dynamics, we will continue to create value for all of our stakeholders.
Building and maintaining partnerships with our clients and communities are crucial to our success. We take great pride every time a client awards us a long-term contract or renews its relationship with us because it demonstrates confidence in our ability to deliver environmentally superior service on competitive terms. This past year, clients extended waste and energy contracts totaling $2.5 billion in revenue, with an average term of 12 years. By securing two million annual tons of waste and 750,000 megawatt-hours of annual electricity sales, we further solidified our base operations. We’ll continue to vigorously pursue contracts to build upon our long-standing tradition of developing sustainable solutions for our clients, and extend our predictable cash flow well into the future.
In terms of operating performance, 2012 was an outstanding year. We achieved record Energy-from-Waste boiler availability of over 92% and we improved our metal-recycling efforts, resulting in the recovery and recycling of 432,000 tons of metal. We also marked the five-year anniversary of our Clean World Initiative, which has had a remarkable impact on our business. One of the most gratifying accomplishments of this program has been our success in improving our already impressive emissions performance. We now consistently operate at less than 25% of the levels allowed under the U.S. Clean Air Act. This bodes well for the future as we continue to drive the leading edge of industry performance.
During the past year we also continued to demonstrate our disciplined approach to capital allocation. We doubled our annual dividend to $0.60 per share and repurchased nearly $90 million of stock, reducing our actual share count to 132 million by year-end—a reduction of almost 17% since we started the buyback program less than three years ago. We also completed several smart financial transactions, including refinancing nearly $2 billion in debt to extend maturities, enhance flexibility and lock in attractive interest rates. In addition, we positioned ourselves well for future growth on several other fronts:
The future—2013 and beyond—holds much promise for Covanta. There will be challenges in the years ahead, some known and some not yet foreseen, but we have a proven ability to mitigate, adapt and find hidden opportunities. Our experienced, innovative and opportunistic team will maintain a steadfast commitment to provide excellent service for our clients and generate strong returns for our shareholders. And to this commitment we dedicate our results.

Anthony J. Orlando, President and Chief Executive Officer


Samuel Zell, Chairman of the Board of Directors

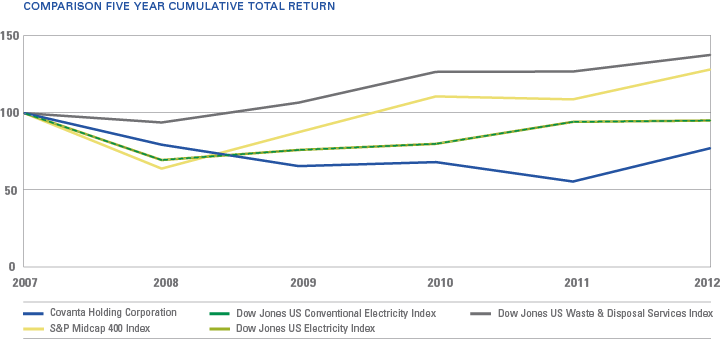
The following transitional performance graph sets forth a comparison of the yearly percentage change in the Company’s cumulative total stockholder return on common stock with the Standard and Poor’s Midcap 400 Index*, the Dow Jones US Conventional Electricity Index**, the Dow Jones US Electricity Index** and the Dow Jones US Waste & Disposal Services Index**. The Dow Jones US Conventional Electricity Index will replace the Dow Jones US Electricity Index in future graphs as it serves as a more appropriate peer comparison. The Dow Jones US Electricity Index will no longer be shown in subsequent total return performance graphs. The foregoing cumulative total returns are computed assuming (a) an initial investment of $100, and (b) the reinvestment of dividends at the frequency which dividends were paid during the applicable years. The graph above reflects comparative information for the five fiscal years beginning with the close of trading on December 31, 2007 and ending December 31, 2012.
The stockholder return reflected above is not necessarily indicative of future performance.
* The Standard and Poor’s Midcap 400 Index is a capitalization—weighted index designed to measure performance of the broad domestic economy through changes in the aggregate market value of the component stocks representing all major industries. Copyright 2013 Standard and Poor’s, Inc. All Rights Reserved. Used with permission.
** The Dow Jones US Waste & Disposal Services Index, the Dow Jones US Conventional Electricity Index, and the Dow Jones US Electricity Index are maintained by Dow Jones & Company, Inc. As described by Dow Jones, the Dow Jones US Waste & Services Index consists of providers of pollution control and environmental services for the management, recovery and disposal of solid and hazardous waste materials, such as landfills and recycling centers. The Dow Jones US Conventional Electricity Index consists of companies generating and distributing electricity through the burning of fossil fuels such as coal, petroleum and natural gas, and through nuclear energy. The Dow Jones US Electricity Index represents wholesale electricity transactions. Calculations for these average power transactions are from specific geographic areas. Copyright 2013 Dow Jones & Company. All Rights Reserved. Used with permission.
BOARD OF DIRECTORS
| Samuel Zell Chairman of the Board Covanta Holding Corporation Chairman and Chief Executive Officer Equity Group Investments David M. Barse President and Chief Executive Officer Third Avenue Management,LLC Ronald J. Broglio President RJB Associates |
Peter C.B. Bynoe Partner and Chief Operating Officer Loop Capital LLC Senior Counsel DLA Piper US, LLP Linda J. Fisher Vice President, Safety, Health & Environment and Chief Sustainability Officer E.I. du Pont de Nemours and Company Joseph M. Holsten Chairman of the Board LKQ Corporation |
Anthony J. Orlando President and Chief Executive Officer Covanta Holding Corporation William C. Pate Co-President Equity Group Investments Robert S. Silberman Chairman of the Board of Directors and Chief Executive Officer Strayer Education, Inc. Jean Smith Managing Director Gordian Group, LLC |
SENIOR MANAGEMENT
| Anthony J. Orlando President and Chief Executive Officer |
Timothy J. Simpson Executive Vice President, General Counsel and Secretary |
Michael A. Wright Senior Vice President and Chief Human Resources Officer |
| Sanjiv Khattri Executive Vice President and Chief Financial Officer |
John M. Klett Executive Vice President and Chief Technology Officer |
Thomas E. Bucks Senior Vice President and Chief Accounting Officer |
| Seth Myones Executive Vice President and Chief Operating Officer |
Matthew R. Mulcahy Senior Vice President and Head of Corporate Development |
Paul Gilman Senior Vice President and Chief Sustainability Officer |
In 2012, our Chief Executive Officer submitted to the New York Stock Exchange (“NYSE”) the annual certification regarding Covanta's compliance with the NYSE's corporate governance listing standard stating that he was not aware of any violation of the NYSE corporate governance listing standards. In addition, our Chief Executive Officer and Chief Financial Officer provided all certifications required by the U.S. Securities and Exchange Commission regarding the quality of Covanta's public disclosures in its reports during 2012.
SHAREHOLDER INFORMATION
|
Corporate Office Covanta Holding Corporation 445 South Street Morristown, NJ 07960 www.covantaenergy.com Independent Accountants and Auditors Ernst & Young, LLP Metropark, NJ |
Transfer Agent American Stock Transfer and Trust Company 59 Maiden Lane Plaza Level New York, NY 10038 800.937.5449 718.921.8124 718.236.2641 Fax Overnight Address American Stock Transfer and Trust Company Operations Center 6201 15th Avenue Brooklyn, NY 11219 Please send change of address notices directly to the Transfer Agent. |
Investor Services If you have questions regarding security ownership or would like to request printed information, including the most recent Annual Report on Form 10-K, please contact the Company’s Investor Relations Department. Write to the corporate office address, Attention: Investor Relations Department, or call 862.345.5000. |
This 2012 Annual Report to Shareholders (“2012 Annual Report”) contains an overview of our business, as well as information regarding our operations during 2012 and other information that our shareholders may find useful. Our 2012 Annual Report includes certain items from our Annual Report on Form 10-K for the fiscal year ended December 31, 2012 filed with the U.S. Securities and Exchange Commission (“SEC”) on February 15, 2013 (the “2012 Form 10-K”). Please note, however, that the 2012 Form 10-K is not incorporated by reference into this 2012 Annual Report.
CAUTIONARY NOTE REGARDING FORWARD-LOOKING STATEMENTS
Certain statements in this 2012 Annual Report may constitute “forward-looking” statements as defined in Section 27A of the Securities Act of 1933 (the “Securities Act”), Section 21E of the Securities Exchange Act of 1934 (the “Exchange Act”), the Private Securities Litigation Reform Act of 1995 (the “PSLRA”) or in releases made by the Securities and Exchange Commission (“SEC”), all as may be amended from time to time. Such forward-looking statements involve known and unknown risks, uncertainties and other important factors that could cause the actual results, performance or achievements of Covanta Holding Corporation and its subsidiaries (“Covanta”) or industry results, to differ materially from any future results, performance or achievements expressed or implied by such forward-looking statements. Statements that are not historical fact are forward-looking statements. Forward-looking statements can be identified by, among other things, the use of forward-looking language, such as the words “plan,” “believe,” “expect,” “anticipate,” “intend,” “estimate,” “project,” “may,” “will,” “would,” “could,” “should,” “seeks,” or “scheduled to,” or other similar words, or the negative of these terms or other variations of these terms or comparable language, or by discussion of strategy or intentions. These cautionary statements are being made pursuant to the Securities Act, the Exchange Act and the PSLRA with the intention of obtaining the benefits of the “safe harbor” provisions of such laws. Covanta cautions investors that any forward-looking statements made by Covanta are not guarantees or indicative of future performance. Important factors, risks and uncertainties that could cause actual results to differ materially from those forward-looking statements with respect to Covanta include, but are not limited to: fluctuations in the prices of energy, waste disposal, scrap metal and commodities; adoption of new laws and regulations in the United States and abroad; the fee structures of our contracts; difficulties in the operation of our facilities, including fuel supply and energy transfer interruptions, failure to obtain regulatory approvals, equipment failures, labor disputes and work stoppages, weather interference and catastrophic events; difficulties in the financing, development and construction of new projects and expansions, including increased construction costs and delays; limits of insurance coverage; our ability to avoid defaults under our long-term service contracts; performance of third parties under our contractual arrangements; concentration of suppliers and customers; increased competitiveness in the energy industry; changes in foreign currency exchange rates; limitations imposed by our existing indebtedness; exposure to counterparty credit risk and instability of financial institutions in connection with financing transactions; our ability to utilize our net operating losses; failures of disclosure controls and procedures; general economic conditions in the United States and abroad, including the availability of credit and debt financing and market conditions at the time our contracts expire; and other risks and uncertainties affecting our businesses described in Item 1A. Risk Factors of our Annual Report on Form 10-K and in other filings by Covanta with the SEC.
Although Covanta believes that its plans, intentions and expectations reflected in or suggested by such forward-looking statements are reasonable, actual results could differ materially from a projection or assumption in any of its forward-looking statements. Covanta’s future financial condition and results of operations, as well as any forward-looking statements, are subject to change and inherent risks and uncertainties. The forward-looking statements contained in this Annual Report are made only as of the date hereof and Covanta does not have, or undertake, any obligation to update or revise any forward-looking statements whether as a result of new information, subsequent events or otherwise, unless otherwise required by law.
Online Annual Report Design and Development by Curran & Connors, Inc.