U.S.
SECURITIES AND EXCHANGE COMMISSION
Washington, D.C. 20549
FORM 10-K
ANNUAL
REPORT UNDER SECTION 13 OR 15(d) OF
THE
SECURITIES EXCHANGE ACT OF 1934
For
fiscal year ended April 30, 2002
Commission File Number 0-20424
HI-TECH PHARMACAL
CO., INC.
(Name of
small business issuer in its charter)
|
Delaware |
11-2638720 | |
|
(State or other jurisdiction of incorporation
or
organization) |
(I.R.S. Employer Identification
Number) |
369
Bayview Avenue, Amityville, New York 11701
(Address
of principal executive offices) (Zip Code)
(631)
789-8228
Issuer’s
telephone number
Securities registered under Section 12(b) of the Exchange Act:
None
Securities registered under Section 12(g) of the Exchange Act:
Common
Stock, $.01 par value
(Title of
Class)
Indicate by check mark whether the registrant (1) has filed all reports
required to be filed by Section 13 or 15(d) of the Securities Exchange Act
during the preceding 12 months (or for such shorter period that the registrant
was required to file such reports), and (2) has been subject to such filing
requirements for the past 90 days. Yes x No ¨
Indicate by check mark if disclosure of delinquent filers, pursuant to
Item 405 of Regulation S-K is not contained herein, and will not be contained,
to the best of the registrant’s knowledge, in definitive proxy or information
statements incorporated by reference in Part III of this Form 10-K or any
amendment to this Form 10-K. ¨
The registrant’s revenues for its most recent fiscal year ended April 30,
2002 were $33,282,000.
The aggregate market value of the voting stock held by non-affiliates of
the registrant on July 31, 2002, based upon the price at which such stock was
sold on that date, was $30,377,775. The number of shares of common stock of the
registrant outstanding as of July 31, 2002 was 4,750,042.
Transitional Small Business Disclosure
Format: Yes ¨; No x
PART I
Item
1. Business.
General
Hi-Tech Pharmacal Co., Inc. (the “Company”) a Delaware corporation,
incorporated in April 1983, is a growing specialty manufacturer and marketer of
prescription, over-the-counter and nutritional products.
The Company manufactures and distributes its products from facilities at
Amityville, NY. The Company sells its products in two primary markets: 1)
Generic pharmaceuticals and 2) Branded products. The Company markets its generic
pharmaceuticals primarily under the Hi-Tech brand name. The Company also markets
a line of branded products primarily for people with diabetes, including
Diabetic Tussin®, DiabetiDerm®, DiabetiSweet® and Multi-betic®. In addition, the
Company markets other niche over the counter brands to the general healthcare
marketplace under such brands as Kosher Care™, Nasal Ease™, and Soothing Comfort™.
The Company’s primary business is the manufacture of liquid, cream and
ointment formulations. The Company also specializes in the manufacture of
products in its state of the art sterile facility capable of producing
ophthalmic, otic and inhalation products.
The Company’s customers include chain drug stores, drug wholesalers,
generic distributors, mass merchandisers, mail-order pharmacies and certain
Federal government agencies. Some of the Company’s key customers include
Bergen-Brunswig, CVS, Eckerds, K-Mart, McKesson, Rite-Aid, Rugby Labs, a
Division of Watson Pharmaceuticals, Walgreens, Wal-Mart and Ivax
Pharmaceuticals. The Company produces a wide range of products for various
disease states including asthma, cough and cold, allergies, pain, stomach, oral
care and neurological disorders and others.
The Company currently markets more than 70 products to approximately 100
customers. For the fiscal year ended April 30, 2002 the Company’s sales
breakdown was as follows: 79% generic manufacturing and 21% branded products.
The Steri-Med Division (sterile products) contributed approximately $3.9 million
of which 87% was from the sales of two albuterol inhalation products.
The Company’s Health Care Products Division (“HCP”) is a leading marketer
of branded products that include over-the-counter, as well as prescription
products primarily for people with diabetes. HCP recently introduced 3 new
products: Multi-betic®, a multi-vitamin and mineral supplement formula;
DiabetiDerm® Foot Rejuvenating Cream; and DiabeticTussin®Sore Throat Spray. These
new products supplement the Company’s existing products, including its flagship
brand Diabetic Tussin® which is available in several formulations, including DM, Max
Strength, EX, Allergy and Cough Drops. The Company also markets Diabetic
Tussin-C, a prescription formulation for severe coughs, through a joint venture
with TEAMM Pharmaceuticals.
HCP also markets DiabetiSweet®—a unique sugar substitute which is aspartame
free and heat stable for baking and cooking. DiabeticSweet® has become HCP’s number
two selling product after Diabetic Tussin®. HCP also markets the following products:
DiabetiDerm® Cream and Lotion for severe dry skin. The Company plans to
introduce at least two new brands for people with diabetes in this fiscal year.
2
HCP will continue to aggressively develop and market new items for the
diabetic market. There are estimated to be more than 16 million diabetics in the
United States alone; 10 million diagnosed and 800,000 new cases per year. There
are more than 100 million cases worldwide. The Company is confident that it can
maintain its leadership position in the area of improving the lifestyle of
people with diabetes and will continue its penetration of this market.
HCP also continues to market its Kosher Care™ brand of products, as
well as Nasal Ease™ and SoothIt™ Lotion.
The Company has received Abbreviated New Drug Application (“ANDA”)
approvals for 23 products. Most recently the Company received ANDA approval to
market Fluoxetine Oral Solution 20mg/5ml, the generic equivalent of Eli Lilly’s
Prozac™ Oral Solution.
The following table sets forth the principal products marketed by the
Company and the names of certain national brands with which these products
compete. All of the products listed below are marketed under the Company’s brand
names H-T™ or RX Choice™ or through its HCP Division and in certain cases under
private label.
3
|
Company
Product
|
Examples of Competing
National Products
| |
|
Prescription
Drugs | ||
|
Carbofed DM Syrup &
Drops |
Rondec®-DM | |
|
Triple Tannate Pediatric
Suspension |
Rynatan® | |
|
Quad-Tuss Tannate Pediatric
Suspension |
Rynatuss Pediatric
Suspension | |
|
Promethazine HCI &
Dextromethorphan Hbr Syrup |
Phenergan® w/ Dextromethorphan Syrup | |
|
Promethazine HCL &
Codeine |
Phenegran® with Codeine | |
|
Albuterol Sulfate Inhalation
0.5% (Sterile) |
Proventil® Inhalation Solution | |
|
Albuterol Sulfate
Syrup |
Ventolin® Syrup | |
|
Albuterol Sulfate Inhalation
0.83% (Sterile) |
Proventil® Inhalation Solution | |
|
Tri-Vitamin Drops with Iron
& Fluoride (0.25) |
Tri-Vi-Flor® w/Iron | |
|
Tri-Vitamin Drops with
Fluoride (0.25)(0.5) |
Tri-Vi-Flor® | |
|
Tri-Vitamin Drops with
Fl(.25)(.5) |
Tri-Vi-Flor® | |
|
Poly-Vitamin Drops with
Fluoride (0.25)(0.5) |
Poly-Vi-Flor® | |
|
Poly-Vitamin Drops with Iron
& Fluoride (0.25)(0.5)
|
Poly-Vi-Flor® | |
|
Valproic Acid
Syrup |
Depakene® Syrup | |
|
Hydroxyzine Hydrochloride
Syrup |
Atarax® | |
|
Amantadine Hydrochloride
Syrup |
Symmetrel® Syrup | |
|
Lidocaine HCL Oral Topical
Solution |
Xylocaine® | |
|
Lactulose Solution
USP |
Chronulac®, Cephulac® | |
|
APAP with Codeine Oral
Solution |
Tylenol® with
Codeine | |
|
Chlorhexidine Gluconate Oral
Rinse |
Peridex® | |
|
Cimetidine Hydrochloride Oral
Solution |
Tagamet® Oral Solution300
mg/5mL | |
|
Tannate-12
Suspension |
Tussi-12® | |
|
Erythromycin Topical
Soln. |
T-Stat Solution
2%® | |
|
Sulfamethoxazole &
Trimethoprim |
||
|
Oral Susp. Grape &
Cherry |
Bactrim Pediatric
Susp.® | |
|
Brometane DX |
Dimetane
DX® | |
|
H-T Tussin DM
20/2000 |
Dura Tuss
DM® | |
|
Luride Drops |
Sodium Fluoride
Drops® | |
|
Vitamins and Nutritional
Supplements | ||
|
Tri-Vitamin
Drops |
Tri-Vi-Sol® Drops | |
|
Poly-Vitamin
Drops |
Poly-Vi-Sol® Drops | |
|
Poly-Vitamin Drops with
Iron |
Poly-Vi-Sol® with Iron | |
|
Golden Age Liquid Vitamins
& Minerals |
Centrum®
Liquid | |
|
Ferrous Sulfate
Drops |
Fer-in-Sol® Drops | |
|
Ferrous Sulfate
Elixir |
Feosol
Exlixir | |
|
Vitamin C
Liquid |
Vitamin C
Liquid | |
4
|
Company
Product
|
Examples of Competing
National Products
| |
|
Over-The-Counter Pharmaceuticals
Branded Health Care Products
| ||
|
Diabetic Tussin®-Formula
DM |
||
|
Diabetic Tussin®-Formula DM Maximum
Strength |
||
|
Diabetic Tussin®-Formula
EX |
||
|
Diabetic Tussin® Allergy Relief
Formula |
||
|
Diabetic Tussin® Children’s
Formula
Diabetic Tussin® Sore Throat
Spray
DiabetiDerm™ Moisturizing
Lotion for Severe Dry Skin |
||
|
DiabetiDerm™ Moisturizing
Cream for Severe Dry Skin |
||
|
DiabetiDerm™ Foot Rejuvenating
Cream |
||
|
DiabetiSweet®—Aspartane Free
Sugar Substitute |
||
|
Multi-betic® |
||
|
Kosher Care™—Tussin
DM |
||
|
Kosher Care™—Pain and Fever
Relief |
||
|
Kosher Care™—Allergy
Relief |
||
|
NasalEase™ Moisturizing Nasal
Spray |
||
5
|
Company
Product
|
Examples of Competing
National Products
| |
|
Over-The-Counter Products | ||
|
Active Syrup |
Actifed
Syrup | |
|
Hygienol |
Balneol | |
|
Aromatic Cascara
Sagrada |
Cascara
Sagrada | |
|
Bromtapp Elixir Alcohol
Free |
Dimetapp® Elixir | |
|
Bromtapp DM Elixir Alcohol
Free |
Dimetapp® DM Elixir | |
|
Guaiatussin-DM |
Robitussin® DM | |
|
Guaiatussin DAC
(CV) |
Robitussin DAC
(CV) | |
|
Guaiatussin AC
(CV) |
Robitussin AC
(CV) | |
|
Guaiatussin (Alcohol
Free) |
Robitussin (Alcohol
Free) | |
|
Children’s Allergy
Medicine |
Benadryl® | |
|
Oxymetazoline Nasal
Spray |
Afrin® Nasal
Spray | |
|
Apap Drops |
Tylenol®
Drops | |
|
Apap Elixir |
Tylenol®
Elixir | |
|
Equalizer Gas Relief
Drops |
Mylicon®
Drops | |
|
K-Pec with
Attapulgite |
Kaopectate® | |
|
Minoxidil Topical Solution
2% |
Rogaine® | |
|
Loperamide HCL Oral
Solution |
Imodium
A-D® | |
|
Geri-Tonic |
Gevrabon | |
|
Nausea Control Cherry
Flavor |
Emetrol
Cherry | |
|
Peri-Docu
Syrup |
Peri-Colace | |
|
Docu Syrup |
Colace
Syrup | |
|
Docu Liquid |
Colace
Liquid | |
|
Eye Wash/Irrigating
Solution |
Eyewash | |
|
Hypotonic
Tears |
HypoTears | |
|
Redness Reliever Eye
Drops |
Visine® | |
|
Calcium Glubionate
Syrup |
Neo-Calglucon | |
Research and Product
Development
The Company’s research and development activities consist of new generic
drug product development efforts and manufacturing process improvements. New
product activities are primarily directed at conducting research studies to
develop generic drug formulations, reviewing and testing such formulations for
therapeutic equivalence to brand name products and development of unique
products for its Health Care Products Division.
The Company’s product development strategies depend upon its ability to
formulate and develop generic drug products equivalent to brand name drugs for
which, in some cases, patent protection is expiring or has already expired and
to obtain FDA approval using the ANDA procedure for the manufacture and sale of
such products.
The completion of a prospective product’s formulation, testing and FDA
approval generally takes up to several years. Development activities for each
generic product could begin several years in advance of the patent expiration
date, which may include bioequivalency studies which are a significant cost of
such ANDA submissions. Consequently, the Company is presently selecting and will
continue to select and develop drugs it
6
expects to market several
years in the future. On June 28, 2002 the Company received approval from the FDA
to market Fluoxetine Oral Solution 20 mg/5 ml, the generic equivalent of Eli
Lilly’s Prozac™ Oral Solution.
For the fiscal years ended April 30, 2002 and 2001, total R&D
expenditures were $1,747,000 and $1,683,000, respectively. The Company currently
has several products in various stages of development, which belong to different
therapeutic categories and when approved by the FDA, may represent a large
potential market for the Company. The Company continues to place increasing
emphasis on its R&D activities. The Company has 8 products currently
submitted to the FDA for approval and in addition has another 15 products in
various stages of development.
The Company has the approval of the DEA to sell certain generic
pharmaceutical products containing narcotics. The Company is currently
manufacturing six preparations containing narcotics. In order to manufacture and
sell products containing narcotics, the Company has implemented stringent
security precautions to insure that the narcotics are accounted for and properly
stored. The Company is currently developing other products that contain
narcotics.
The Company’s Steri-Med Division is manufacturing ophthalmic, otic and
inhalation products. The manufacture of ophthalmic, otic, and other products
requires a sterile environment, validation of the manufacturing process and
special equipment and trained personnel. The Company is currently producing 10
different products in its sterile facility. The Company intends to use the ANDA
procedure to obtain FDA approval for the manufacture of certain products in this
facility. In addition, the Company has several contract manufacturing agreements
for products at various stages of development to be manufactured in its sterile
facility. The Company currently manufactures over-the-counter eye drops, eye
wash and artificial tears and two sterile Albuterol inhalation products
previously approved by the FDA, as well as an FDA approved product for a
pharmaceutical company.
The Company and Reuben Seltzer, a director of the Company, each have a
21.25% interest in Marco Hi-Tech JV Ltd. (“Marco Hi-Tech”), a New York
corporation, which markets raw materials for nutraceutical products and has
licensed the patent rights to Huperzine and analogues from the Mayo Clinic.
Huperzine is a naturally derived compound belonging to a class known as acetyl
cholinesterase inhibitors. Huperzine has been shown to inhibit the enzyme
responsible for the breakdown of acetylcholine, a neurotransmitter or brain
chemical, that is believed to be critical in learning and memory. Marco Hi-Tech
is currently distributing Huperzine as a dietary supplement under the Dietary
Supplement Health and Education Act of 1994 and developing Huperzine A and
derivatives for a pharmaceutical application. Marco Hi-Tech has entered into a
supply arrangement for its Huperzine product with a multi-national leader in the
nutraceutical market. It is also developing other products for the nutraceutical
market.
Customers and
Marketing
The Company markets its products to chain drug stores, drug wholesalers,
generic distributors, mass merchandise chains, mail order pharmacies, managed
care providers, and local, state and Federal government agencies. The Company
sells its generic products to over 100 active accounts located throughout the
United States. For the fiscal year ended April 30, 2002, no customer accounted
for 10% or more of the Company’s net sales. For the fiscal year ended April 30,
2001, one customer, Rugby Labs, a division of Watson Laboratories, accounted for
net sales of approximately 10%. The Company’s top ten customers accounted for
approximately 53% and 58% of the Company’s total sales for each of the fiscal
years ended April 30, 2002 and 2001, respectively. If any of the Company’s top
five customers discontinues or substantially reduces its purchases from the
Company, it may have a material adverse effect on the Company’s business and
financial condition. The Company believes, however, that it has good
relationships with its customers.
7
The Company utilizes its state of the art facilities and laboratories to
offer contract manufacturing that includes research and development programs, to
its existing as well as potential customers.
The Company’s Health Care Products Division (“HCP”) currently markets
over the counter, nutritional and cosmetic products for the diabetic consumer.
The Company’s products are Diabetic Tussin®, its flagship brand available in several
formulations, including Diabetic Tussin® DM, Maximum Strength, Children’s Formula and
Allergy Formula and Cough Drops and Diabetic Tussin® Sore Throat Spray. The
Company’s Diabetic Tussin® DM is the best selling sugar free over-the-counter cough
medication in the United States. HCP also markets dermatological moisturizers
under the brand name DiabetiDerm®, which include DiabetiDerm® Cream and Lotion and
DiabetiDerm® Foot Rejuvenating Cream. HCP’s DiabetiSweet® is a unique aspartame
free heat stable sugar substitute formulated for use in baking and cooking. HCP
recently launched Multi-betic®, a multi-vitamin and mineral supplement formula,
DiabetiDerm® Foot Rejuvenating Cream and Diabetic Tussin® Sore Throat Spray.
HCP also markets several other niche over-the-counter brands, including
Nasal Ease™, a nasal moisturizer, which contains zinc and Kosher Care—a
line of over-the-counter products certified as Kosher. HCP intends to continue
its focus on introducing branded over-the-counter formulations targeted to the
diabetic market as well as other niche markets. HCP introduced its first ever
branded prescription product, Diabetic Tussin-C, a formulation for severe coughs
by prescription only. This product is being detailed to physicians through a
joint venture with TEAMM Pharmaceuticals. Products sold through the Health Care
Products Division accounted for approximately 18%, 20% and 24% of the Company’s
total net sales for fiscal 2002, fiscal 2001 and fiscal 2000, respectively.
The Company markets its products using various marketing strategies,
which include more contemporary packaging to improve point-of-purchase impact,
media, trade and consumer journal advertising, as well as coupon promotions,
professional and consumer sampling programs, as well as telemarketing efforts.
The Company has expanded its marketing strategy with programs to include
marketing ventures with major companies selling popular non-competing diabetic
medications, pharmacy programs and via the Internet using a website. As part of
its marketing strategy, the Company places increasing emphasis on the Internet
which it views as a very efficient tool in educating and reaching out to
millions of people with diabetes. The Company’s website is registered under the
domain name diabeticproducts.com and is linked to other diabetic based websites.
HCP currently employs 6 full time employees in sales and marketing and 2
independent commission sales representative organizations. The Company has
recently hired a director of marketing to assist in efficiently planning and
implementing the Company’s marketing program.
The Company is focused on growth and will continue to develop new branded
and generic products, and also will devise new marketing strategies to penetrate
its markets. In order to maximize its growth and shareholder value, the Company
is seeking to complement this internal effort by acquiring products for future
marketing, as well as licensing rights to proprietary products and technologies
for development and commercialization. The Company will place increasing
emphasis on establishing co-development and co-marketing agreements with
strategic partners.
Manufacturing
The Company’s manufacturing facilities are designed to be flexible in
order to allow the low cost production of a variety of products of different
dosages, sizes, packagings and quantities while maintaining a high level of
quality and customer service. This flexible production capability allows the
Company to adjust on-line production in order to meet customer requirements.
8
Manufacturing and
Facilities
The Company is operating from five buildings on one site in Amityville,
New York totaling approximately 141,000 square feet.
|
Building 1— |
|
This 40,000 sq. ft.
facility is dedicated to liquid and semi-solid production which consists
of a compounding facility, 5 high speed filling lines and raw material
warehousing space and pharmacy. |
|
Building 2— |
|
This 21,500 sq. ft.
facility consists of narcotic manufacturing and cream and ointment
filling, quality control and microbiology laboratories and the Company’s
Steri-Med Unit for sterile manufacturing and filling.
|
|
Building 3— |
|
This 21,500 sq. ft.
facility is used for research and development laboratories and warehousing
of components. |
|
Building 4— |
|
This 50,000 sq. ft.
facility is used for warehousing space and distribution center.
|
|
Building 5— |
|
This 8,000 sq. ft.
facility is used for administrative offices.
|
The Company owns all of its buildings, except for its 50,000 square foot
warehouse for which it has exercised an option to purchase for $1,300,000 during
fiscal 2003 on favorable terms.
The Company believes the current facilities will be adequate for the next
several years.
Raw Materials
The Company’s raw materials are readily available from multiple
suppliers, and the Company is not dependent upon any single supplier for its
needs, with the exception of certain products. The Company believes it has good,
cooperative working relationships with its suppliers and is not experiencing any
difficulty in obtaining its raw materials. If a supplier were unable to supply
the Company, the Company believes it could locate an alternative supplier.
However, any change in suppliers of a raw material could cause significant
delays and cost increases in the manufacture of such product.
Competition
The market for generic pharmaceuticals is highly competitive. The
Company’s direct competition consists of numerous generic drug manufacturers,
many of which have greater financial and other resources than the Company. If
one or more other generic pharmaceutical manufacturers significantly reduce
their prices in an effort to gain market share, the Company’s profitability or
market position could be adversely affected. Competition is based principally on
price, quality of products, customer service, reputation and marketing support.
Government Regulation
The Company’s products and facilities are subject to regulation by a
number of Federal and state governmental agencies. The FDA, in particular,
maintains oversight of the Company’s manufacturing process as well as the
distribution of the Company’s products. In July 1999, the Company received a
warning letter from the FDA, alleging certain non-compliance issues based upon a
previously conducted investigation. In
9
response to the warning
letter, the Company promptly met with the FDA, hired a highly qualified
compliance consultant and prepared and submitted a corrective action plan on
October 14, 1999 outlining its remediation efforts. The Company has since had
several FDA inspections including its most recent which took place from February
11, 2002 through March 13, 2002. The Company believes the issues cited during
the inspection were adequately addressed by the Company. On June 28, 2002 the
Company received an approval from the FDA for its ANDA for Fluoxetine Oral
Solution 20 mg/5 ml, which is the Company’s first approval since receiving a
warning letter in July 1999.
Although some of the products currently manufactured and marketed by the
Company do not require prior specific approval of the FDA, many products which
the Company currently markets and intends to market under its product
development program will require prior FDA approval using the ANDA procedure
prior to being marketed. The Company currently has pending submissions for FDA
approval of 8 generic products and has 23 approved products.
An ANDA can be filed for a drug which is the equivalent of a product
previously approved by the FDA. Under the ANDA procedure, applicants are
required to demonstrate through studies that, among other things, the drug
product is chemically equivalent to the previously approved drug, that its
facilities and personnel meet standards for the manufacture of such product, and
that its production procedures will consistently adhere to FDA quality
standards, and, in certain cases, the applicant is required to demonstrate the
bioequivalency of its product (the rate and extent of absorption of a drug’s
active ingredient and/or its availability at the site of drug action).
The FDA has extensive enforcement powers, including the power to seize
noncomplying products, to seek court action to prohibit their sale and to seek
criminal penalties for noncomplying manufacturers. Although it has no statutory
power to force the recall of products, the FDA usually accomplishes a recall as
a result of the threat of judicially imposed seizure, injunction and/or criminal
penalties.
The Company is also subject to regulation by the DEA, which regulates the
sale of pharmaceutical products that contain narcotics. The Company has received
DEA approval and is manufacturing and selling 6 products containing narcotics.
The DEA also has extensive enforcement powers, including the power to seize and
prohibit the manufacture and sale of noncomplying products.
Product Liability
The sale of pharmaceutical products can expose the manufacturer of such
products to product liability claims by consumers. A product liability claim, if
successful and in excess of the Company’s insurance coverage, could have a
material adverse effect on the Company’s financial condition. No product
liability suit has ever been filed against the Company. The Company maintains a
product liability insurance policy which provides coverage in the amount of
$5,000,000 per claim and in the aggregate, with a $100,000 deductible.
Employees
As of April 30, 2002, the Company employed 155 full-time persons and 9
part-time persons, of whom 21 were engaged in executive, financial and
administrative capacities; 12 in marketing, sales and service; 74
full-time employees and 9 part-time employees in production, warehousing and
distribution; and 48 in research and development and quality control functions.
The Company is not a party to a collective bargaining agreement. The management
of the Company considers its relations with its employees to be satisfactory.
10
Item
2. Properties.
The Company’s executive offices and manufacturing facilities are located
in Amityville, New York. The Company currently occupies such facility,
aggregating approximately 40,000 square feet. There is a first mortgage on the
property in the original principal amount of $922,500.
The Company also owns a facility in Amityville, New York of approximately
21,500 square feet, which is used as a sterile manufacturing facility and also
contains research and development, chemistry and microbiology laboratories.
There is a first mortgage on the property in the original principal amount of
$600,000.
The Company leases an approximately 50,000 square feet facility in
Amityville, New York which it uses for the warehousing of finished goods and
shipments. The Company has exercised its option to purchase this facility. The
current annual base rent is $199,000.
The Company also owns a 21,000 square feet warehouse facility in
Amityville, New York which it purchased in February 1994 for a purchase price of
$500,000. There is a first mortgage on the property in the original amount of
$375,000.
The Company also owns a 8,000 square foot office building adjacent to its
existing facilities which is utilized for administrative offices.
The Company’s five facilities in Amityville, New York total approximately
141,000 square feet.
The Company believes that its properties are adequately covered by
insurance and are suitable and adequate for its needs for several years.
Item
3. Legal Proceedings.
In March 2001, the Center for Environmental Health (“CEH”) filed a
lawsuit against several defendants alleging violations of California’s
Proposition 65 and Unfair Trade Practices Act for failure to provide clear and
reasonable warnings regarding the carcinogenicity and reproductive toxicity of
lead and the reproductive toxicity of cadmium to the users of FDA-approved
anti-diarrheal medicines. On May 14, 2002, the Company received a settlement
proposal from the plaintiffs offering to settle the matter against the Company.
The Company has not accepted this settlement offer. The Company believes that
the final settlement offer will not be in excess of $75,000.
In October 2001, the California Attorney General filed a lawsuit against
the Company and other defendants alleging violations of California’s Proposition
65 and Unfair Trade Practices Act for failure to provide clear and reasonable
warnings regarding the reproductive toxicity of mercury compounds to the users
of certain FDA-approved nasal sprays. The Company accepted a settlement offer
which would require the Company to pay under $10,000 and is currently awaiting
final settlement documents from the California Attorney General.
The Company believes that these litigation matters will not have a
material effect on the financial position or operations of the Company.
11
Item
4. Submission of Matters to a Vote of Security
Holders.
No matters were submitted to a vote of security holders during the
quarter ended April 30, 2002.
PART II
Item
5. Market For The Registrant’s Common Stock.
Market Information
The Company’s common stock is traded on the National Market System of the
National Association of Securities Dealers Automated Quotation System (“NASDAQ”)
under the symbol HITK.
The following table sets forth the high and low closing sales prices per
share of the Company’s common stock for the periods indicated on the NASDAQ
National Market System. The quotations are inter-dealer prices, without retail
mark-up, mark-down or commissions paid, and may not necessarily reflect actual
transactions.
|
Quarter
Ended
|
High
|
Low
| ||
|
Fiscal
2001 |
||||
|
July 31, 2000 |
4.81 |
3.75 | ||
|
October 31,
2000 |
5.19 |
3.25 | ||
|
January 31,
2001 |
4.50 |
3.69 | ||
|
April 30, 2001 |
6.06 |
4.00 | ||
|
Fiscal
2002 |
||||
|
July 31, 2001 |
15.15 |
5.79 | ||
|
October 31,
2001 |
12.10 |
6.88 | ||
|
January 31,
2002 |
13.82 |
8.40 | ||
|
April 30, 2002 |
13.35 |
10.07 |
As of July 31, 2002 the closing price of the Common Stock on the Nasdaq
National Market System was $9.80.
The table below sets forth, as of the end of the fiscal year ended April
30, 2002, for the Hi-Tech Pharmacal Co., Inc. Employee Stock Option Plan
(“Plan”) the number of securities to be issued upon the exercise of outstanding
options, warrants and rights, the weighted average exercise price of the
outstanding options, and other than securities to be issued upon the exercise of
the outstanding options, the number of securities remaining for future issuance
under the Plan:
12
Equity Compensation
Plan Information
|
Plan
Category
|
Number of securities to be issued upon exercise of outstanding
options, warrants and rights
(a)
|
Weighted-average exercise price of outstanding options, warrants
and rights
(b)
|
Number of securities remaining available for future issuance
under equity compensation plans (excluding securities reflected in
column (a))
(c)
| |||
|
Equity compensation plans
approved by security holder |
986,575 |
$5.73 |
93,675 | |||
|
Equity compensation plans not
approved by security holders |
25,000 |
$5.50 |
— | |||
|
Total |
1,011,575 |
93,675 |
There are no Company equity compensation plans not approved by the
Company’s stockholders. In November 2000, the Company granted 25,000 Warrants to
a consultant in return for financial advisory services.
Common Stock Holders
The Company believes there are approximately 1,513 holders of Common
Stock, including shares held in street name by brokers.
Dividends
The Company has never declared or paid any cash dividends, and it does
not anticipate that it will pay cash dividends in the foreseeable future. The
declaration of dividends by the Company in the future is subject to the sole
discretion of the Company’s Board of Directors and will depend upon the
operating results, capital requirements and financial position of the Company,
general economic conditions and other pertinent conditions or restrictions
relating to any financing. The Company’s loan agreement prohibits the payment of
cash dividends by the Company.
13
Item
6. Selected Financial Data
The selected financial data presented below for the five years ended
April 30, 2002 are derived from the audited financial statements of the Company.
This data is qualified in its entirety by reference to, and should be read in
conjunction with, Management’s Discussion and Analysis of Financial Condition
and Results of Operations and the Company’s financial statements and related
notes thereto included elsewhere herein.
|
Year Ended April 30,
|
||||||||||||||||
|
2002
|
2001
|
2000
|
1999
|
1998
|
||||||||||||
|
Statement of operations
data: |
||||||||||||||||
|
Net sales |
$ |
33,282,000 |
|
29,649,000 |
|
26,414,000 |
|
23,266,000 |
|
22,366,000 |
| |||||
|
|
|
|
|
|
|
|
|
|
|
| ||||||
|
Costs and
expenses: |
||||||||||||||||
|
Costs of goods
sold |
|
17,507,000 |
|
15,315,000 |
|
14,979,000 |
|
13,210,000 |
|
13,084,000 |
| |||||
|
Research and
development |
|
1,747,000 |
|
1,683,000 |
|
1,367,000 |
|
1,124,000 |
|
1,003,000 |
| |||||
|
Selling, general and
administrative |
|
8,941,000 |
|
9,197,000 |
|
7,786,000 |
|
6,262,000 |
|
5,497,000 |
| |||||
|
Contract research
(income) |
|
(368,000 |
) |
(250,000 |
) |
(279,000 |
) |
(336,000 |
) |
(228,000 |
) | |||||
|
Interest
expense |
|
55,000 |
|
104,000 |
|
126,000 |
|
220,000 |
|
268,000 |
| |||||
|
Interest (income) and
other |
|
(202,000 |
) |
(319,000 |
) |
(277,000 |
) |
(210,000 |
) |
(93,000 |
) | |||||
|
|
|
|
|
|
|
|
|
|
|
| ||||||
|
$ |
27,680,000 |
|
25,730,000 |
|
23,702,000 |
|
20,270,000 |
|
19,531,000 |
| ||||||
|
|
|
|
|
|
|
|
|
|
|
| ||||||
|
Income before
provision |
||||||||||||||||
|
for income
taxes |
|
5,602,000 |
|
3,919,000 |
|
2,712,000 |
|
2,996,000 |
|
2,835,000 |
| |||||
|
Provision for income
taxes |
|
2,089,000 |
|
1,528,000 |
|
1,020,000 |
|
1,118,000 |
|
1,100,000 |
| |||||
|
|
|
|
|
|
|
|
|
|
|
| ||||||
|
Net income |
$ |
3,513,000 |
|
2,391,000 |
|
1,692,000 |
|
1,878,000 |
|
1,735,000 |
| |||||
|
|
|
|
|
|
|
|
|
|
|
| ||||||
|
Basic earnings per
share |
$ |
0.79 |
|
0.55 |
|
0.38 |
|
0.42 |
|
0.38 |
| |||||
|
|
|
|
|
|
|
|
|
|
|
| ||||||
|
Diluted earnings per
share |
$ |
0.71 |
|
0.54 |
|
0.38 |
|
0.42 |
|
0.38 |
| |||||
|
|
|
|
|
|
|
|
|
|
|
| ||||||
|
Weighted average common shares
outstanding basic earnings per share |
|
4,460,000 |
|
4,357,000 |
|
4,401,000 |
|
4,487,000 |
|
4,516,000 |
| |||||
|
Effect of potential common
shares |
|
458,000 |
|
57,000 |
|
57,000 |
|
32,000 |
|
64,000 |
| |||||
|
Weighted average common shares
outstanding diluted earnings per share |
|
4,918,000 |
|
4,414,000 |
|
4,458,000 |
|
4,519,000 |
|
4,580,000 |
| |||||
|
|
|
|
|
|
|
|
|
|
|
| ||||||
|
April 30,
|
||||||||||||||||
|
2002
|
2001
|
2000
|
1999
|
1998
|
||||||||||||
|
Balance sheet
data: |
||||||||||||||||
|
Working
capital |
$ |
17,937,000 |
|
13,095,000 |
|
10,676,000 |
|
9,939,000 |
|
8,321,000 |
| |||||
|
Total assets |
$ |
33,072,000 |
|
27,510,000 |
|
25,829,000 |
|
23,210,000 |
|
21,622,000 |
| |||||
|
Long-term debt |
$ |
62,000 |
|
217,000 |
|
556,000 |
|
1,003,000 |
|
14,500,00 |
| |||||
|
Stockholders'
equity |
$ |
26,111,000 |
|
20,980,000 |
|
18,739,000 |
|
17,307,000 |
|
15,685,000 |
| |||||
14
Item
7. Management’s Discussion and Analysis of
Financial Condition and Results of Operations
General
The following discussion and analysis should be read in conjunction with
the Financial Statements and Notes thereto appearing elsewhere in this Report.
The following table sets forth, for all periods indicated, the percentage
relationship that items in the Company’s Statements of Operations bear to net
sales.
|
Year Ended April 30,
|
|||||||||
|
2002
|
2001
|
2000
|
|||||||
|
Net Sales |
100.0 |
% |
100.0 |
% |
100.0 |
% | |||
|
Cost of Sales |
52.6 |
% |
51.7 |
% |
56.7 |
% | |||
|
|
|
|
|
|
| ||||
|
Gross profit |
47.4 |
% |
48.3 |
% |
43.3 |
% | |||
|
Selling, general and
administrative expense |
26.9 |
% |
31.0 |
% |
29.4 |
% | |||
|
Research and development
costs |
5.2 |
% |
5.7 |
% |
5.2 |
% | |||
|
Contract research
(income) |
-1.1 |
% |
-0.8 |
% |
-1.1 |
% | |||
|
Interest
expense |
0.2 |
% |
0.3 |
% |
0.5 |
% | |||
|
Interest (income) and
other |
-0.6 |
% |
-1.1 |
% |
-1.0 |
% | |||
|
|
|
|
|
|
| ||||
|
Total expenses |
30.6 |
% |
35.1 |
% |
33.0 |
% | |||
|
|
|
|
|
|
| ||||
|
Income before tax
provision |
16.8 |
% |
13.2 |
% |
10.3 |
% | |||
|
Income tax
provision |
6.3 |
% |
5.1 |
% |
3.9 |
% | |||
|
|
|
|
|
|
| ||||
|
Net income |
10.5 |
% |
8.1 |
% |
6.4 |
% | |||
|
|
|
|
|
|
| ||||
Results of Operations Years Ended April 30, 2002 and 2001
For the fiscal year ended April 30, 2002 (“Fiscal 2002”), net sales
increased by $3,633,000, or 12.3% to $33,282,000 from $29,649,000 for the fiscal
year ended April 30, 2001 (“Fiscal 2001”). The increase was primarily the result
of the increased shipments to our existing customers as well as several new
customers in Fiscal 2002. Generic pharmaceutical products, which include private
label contract manufacturing, had net sales for Fiscal 2002 of $27,232,000, an
increase of $3,517,000, or 15%, compared to the Fiscal 2001 respective period,
and $20,204,000 for fiscal 2000. No one product accounted for sales of 10% or
more of total sales for each respective period.
Health Care Products division, which markets the Company’s branded
products, for Fiscal 2002 and 2001 had net sales of $6,050,000 and $5,934,000,
respectively, and $6,210,000 for fiscal 2000. Sales of the Health Care Products
Division increased modestly as a result of a mild cold and flu season.
Cost of sales, as a percentage of net sales, increased from 51.7% for
Fiscal 2001 to 52.6% for Fiscal 2002. In the generic drug industry, certain
products may contribute significantly to a Company’s gross profit. The gross
profit on these products may change as market conditions change. In the
aggregate, the costs, as a percentage of sales, for materials increased 1.5% and
labor and overhead decreased 0.6 %. Units shipped increased 4.3% and the average
unit selling price increased 8.8% which resulted from changes in product mix and
competitive conditions. If one or more other generic pharmaceutical
manufacturers significantly reduce their prices in an effort to gain market
share, the Company’s profitability could be adversely affected.
Selling, General and Administrative expenses, as percentage of net sales
decreased from 31.0% to 26.9%, or decreased to $8,941,000 for Fiscal 2002 from
$9,197,000 for Fiscal 2001, a decrease of $256,000 resulting principally from
reduced advertising and promotion expenditures for the Health Care Products
division as a result of a mild cold and flu season.
Research and development costs increased to $1,747,000 or 5.2% of sales
for Fiscal 2002 from $1,683,000 or 5.7% of sales for Fiscal 2001 as a result of,
among other things, expenses associated with the
15
filing of Abbreviated New
Drug Applications (ANDAs) with the FDA as well as development of new products
for the Company’s Health Care Products Division. Many of the Company’s
pharmaceutical products do not require prior approval before marketing. However,
certain products which the Company introduced and intends to introduce under its
product development program will require prior FDA approval using the ANDA
procedure before they can be manufactured and marketed. Such products include
products to be manufactured in the Company’s sterile facility.
Net income increased to $3,513,000 for Fiscal 2002 from net income of
$2,391,000 for Fiscal 2001, as a result of the factors noted above.
Results of Operations Years Ended April 30, 2001 and 2000
For Fiscal 2001, net sales increased by $3,235,000, or 12.2% to
$29,649,000 from $26,414,000 for the fiscal year ended April 30, 2000 (“Fiscal
2000”). The increase was primarily the result of the increased shipments to our
existing customers as well as several new customers in Fiscal 2001. Sales of the
Health Care Products Division declined approximately $276,000.
Cost of sales, as a percentage of net sales, decreased from 56.7% for
Fiscal 2000 to 51.7% for Fiscal 2001. In the generic drug industry, certain
products may contribute significantly to a Company’s gross profit. The gross
profit on these products may change as market conditions change. In the
aggregate, labor and overhead including the sterile manufacturing facility,
expense increased less than increased sales. Primarily, a higher proportion of
revenues from certain higher gross profit products influenced the results
favorably. If one or more other generic pharmaceutical manufacturers
significantly reduce their prices in an effort to gain market share, the
Company’s profitability could be adversely affected.
Selling, General and Administrative expenses, as percentage of net sales
increased from 29.4% to 31.0%, or increased to $9,197,000 for Fiscal 2001 from
$7,786,000 for Fiscal 2000 resulting principally from an increased sales staff
and test mailing a product catalog to direct mail prospects.
Research and development costs increased to $1,683,000 or 5.7% of sales
for Fiscal 2001 from $1,367,000 or 5.2% of sales for Fiscal 2000 as a result of,
among other things, expenses associated with the filing of ANDAs with the FDA as
well as development of new products for the Company’s Health Care Products
Division. Many of the Company’s pharmaceutical products do not require prior
approval before marketing. However, certain products which the Company
introduced and intends to introduce under its product development program will
require prior FDA approval using the ANDA procedure before they can be
manufactured and marketed. Such products include products to be manufactured in
the Company’s sterile facility.
Net income increased to $2,391,000 for Fiscal 2001 from net income of
$1,692,000 for Fiscal 2000, as a result of the factors noted above.
Liquidity and Capital Resources
The Company’s operations are historically financed principally by cash
flow from operations and bank borrowing. At April 30, 2002 and April 30, 2001,
working capital was approximately $17,937,000 and $13,095,000, respectively.
Accounts payable increased 53% from $2,313,000 for Fiscal 2001 to
$3,538,000 for Fiscal 2002 due principally to a greater level of business during
the fourth fiscal quarter and the aging of days of payables increasing 20%.
Accrued expenses decreased 6% from $2,210,000 for Fiscal 2001 to
$2,053,000 for Fiscal 2002 as a
16
result of the decreased
levels of selling price concessions.
Cash flows from operating activities were approximately $4,110,000, which
was the result principally of net income and depreciation of $4,738,000. Cash
flows used in investing activities was approximately $1,344,000 from operating
activities funds and was principally payments for fixed assets acquired. Cash
flows from financing activities approximated $577,000 and resulted principally
from the exercise of incentive stock options which generated $917,000 in new
capital.
On February 2, 2000 the Company renewed its $6,000,000 working capital
credit line which expires January 31, 2003. At April 30, 2002 the rate for
borrowing was 5.25% and there was no balance outstanding. Borrowings under the
line are collateralized by inventory, accounts receivable and all other assets.
The agreement contains covenants with respect to working capital, net worth and
certain financial ratios, as well as other covenants and prohibits the payment
of cash dividends.
The Company is responsible for all operating costs of its leased facility
and has exercised its option to purchase the premises at the end of the lease in
January 2003 for $1,300,000.
The Company believes that its financial resources consisting of current
working capital, anticipated future operating revenue and its credit line will
be sufficient to enable it to meet its working capital requirements for at least
the next 12 months.
In August 2001, the Financial Accounting Standards Board (“FASB”) issued
SFAS No. 144, Accounting for the Impairment or Disposal of Long-Lived Assets.
SFAS 144 addresses financial accounting and reporting for the impairment or
disposal of long-lived assets. SFAS 144 is effective for fiscal years beginning
after December 5, 2001, and interim periods within those fiscal years with early
application encouraged. Management has not determined the effect, if any, to the
Company’s financial position or results of operations upon adoption of SFAS 144.
In June 2001, the FASB issued SFAS 143, Accounting for Asset Retirement
Obligations. SFAS 143 requires that the fair value of a liability for an asset
retirement obligation be recognized in the period in which it is incurred if a
reasonable estimate of fair value can be made. The provisions of SFAS 143 are
effective for financial statements issued for fiscal years beginning after June
15, 2002.
In June 2001, the FASB issued SFAS No. 141, Business Combinations, and
SFAS No. 142, Goodwill and Other Intangible Assets. SFAS 141 required that the
purchase method of accounting be used for all business combinations subsequent
to June 30, 2001 and specific criteria for recognizing intangible assets
acquired in a business combination. Under SFAS No. 142, the Company will be
required to re-assess the goodwill and other intangible assets previously
recorded in connection with prior acquisitions, as well as their useful lives.
SFAS No. 142 requires that goodwill and intangible assets with indefinite useful
lives no longer be amortized, but instead be tested for impairment at least
annually. Whenever there is an impairment indicator, all acquired goodwill must
be assigned to reporting units for purposes of impairment testing and segment
reporting. Effective January 1, 2002, goodwill will no longer be subject to
amortization. Intangible assets with definite useful lives will continue to be
amortized over their respective lives.
Management does not anticipate that adoption of these standards will have
a material impact on our financial position or results of operations.
In May 1997, the Company announced a stock buy-back program under which
the Board of Directors authorized the purchase of up to $500,000 of its common
stock. In August 1999 the Company increased the stock buy-back program to an
aggregate of $1,000,000. As of April 30, 2002 the Company had purchased 194,700
shares at a cost of $801,000.
17
Item
8. Financial Statements and
Supplementary Data
INDEX
|
Page
Number
| ||
|
Independent Auditors’
Report |
F-2 | |
|
Balance Sheets |
F-3 | |
|
Statements of
Operations |
F-4 | |
|
Statements of Changes in
Stockholders’ Equity |
F-5 | |
|
Statements of Cash
Flows |
F-6 | |
|
Notes to Financial
Statements |
F-7 |
F-1
INDEPENDENT AUDITORS’
REPORT
To the Board of Directors
and Stockholders
Hi-Tech Pharmacal Co.,
Inc.
Amityville, New York
We have audited the accompanying balance sheets of Hi-Tech Pharmacal Co.,
Inc. as of April 30, 2002 and 2001, and the related statements of operations,
changes in stockholders’ equity and cash flows for each of the years in the
three-year period ended April 30, 2002. These financial statements are the
responsibility of the Company’s management. Our responsibility is to express an
opinion on these financial statements based on our audits.
We conducted our audits in accordance with auditing standards generally
accepted in the United States of America. Those standards require that we plan
and perform the audits to obtain reasonable assurance about whether the
financial statements are free of material misstatement. An audit includes
examining, on a test basis, evidence supporting the amounts and disclosures in
the financial statements. An audit also includes assessing the accounting
principles used and significant estimates made by management, as well as
evaluating the overall financial statement presentation. We believe that our
audits provide a reasonable basis for our opinion.
In our opinion, the financial statements enumerated above present fairly,
in all material respects, the financial
position of Hi-Tech Pharmacal Co., Inc. as of
April 30, 2002 and 2001, and the results of its operations and its cash flows
for each of the years in the three-year period ended April 30, 2002 in
conformity with accounting principles generally accepted in the United States of
America.
EISNER LLP (formerly
Richard A. Eisner & Company, LLP)
New York, New York
July 3, 2002
F-2
HI-TECH
PHARMACAL CO., INC.
BALANCE
SHEETS
|
April 30,
|
|||||||
|
2002
|
2001
|
||||||
|
ASSETS |
|||||||
|
CURRENT
ASSETS: |
|||||||
|
Cash and cash
equivalents |
$ |
10,487,000 |
|
7,144,000 |
| ||
|
Accounts receivable (less
allowances for doubtful accounts of $270,000 at April 30,2002 and
$240,000 at April 30, 2001) |
|
5,550,000 |
|
4,435,000 |
| ||
|
Inventory |
|
6,020,000 |
|
5,487,000 |
| ||
|
Prepaid taxes |
|
464,000 |
|
— |
| ||
|
Deferred taxes |
|
514,000 |
|
437,000 |
| ||
|
Other current
assets |
|
648,000 |
|
708,000 |
| ||
|
|
|
|
|
| |||
|
TOTAL CURRENT
ASSETS |
$ |
23,683,000 |
|
18,211,000 |
| ||
|
Property and equipment at
cost, net of accumulated depreciation and amortization |
|
9,004,000 |
|
8,960,000 |
| ||
|
Other assets |
|
385,000 |
|
339,000 |
| ||
|
|
|
|
|
| |||
|
TOTAL |
$ |
33,072,000 |
|
27,510,000 |
| ||
|
|
|
|
|
| |||
|
LIABILITIES |
|||||||
|
CURRENT
LIABILITIES: |
|||||||
|
Current portion of long-term
debt |
$ |
155,000 |
|
340,000 |
| ||
|
Accounts
payable |
|
3,538,000 |
|
2,313,000 |
| ||
|
Accrued
expenses |
|
2,053,000 |
|
2,210,000 |
| ||
|
Taxes payable |
|
— |
|
253,000 |
| ||
|
|
|
|
|
| |||
|
TOTAL CURRENT
LIABILITIES |
$ |
5,746,000 |
|
5,116,000 |
| ||
|
Long-term debt (less current
portion) |
|
62,000 |
|
217,000 |
| ||
|
Deferred taxes |
|
1,153,000 |
|
1,197,000 |
| ||
|
|
|
|
|
| |||
|
TOTAL
LIABILITIES |
$ |
6,961,000 |
|
6,530,000 |
| ||
|
|
|
|
|
| |||
|
COMMITMENTS AND
CONTINGENCIES |
|||||||
|
STOCKHOLDERS’
EQUITY |
|||||||
|
Preferred stock, par value
$.01 per share; authorized 3,000,000 shares, none issued |
|
— |
|
— |
| ||
|
Common stock, par value $.01;
authorized 10,000,000 shares, 4,729,000 and 4,527,000 shares issued,
respectively |
|
47,000 |
|
45,000 |
| ||
|
Additional paid-in
capital |
|
10,304,000 |
|
8,688,000 |
| ||
|
Retained
earnings |
|
16,561,000 |
|
13,048,000 |
| ||
|
Treasury stock, 194,700 shares
of common stock, at cost April 30, 2002 and 2001. |
|
(801,000 |
) |
(801,000 |
) | ||
|
|
|
|
|
| |||
|
TOTAL STOCKHOLDERS’
EQUITY |
$ |
26,111,000 |
|
20,980,000 |
| ||
|
|
|
|
|
| |||
|
TOTAL |
$ |
33,072,000 |
|
27,510,000 |
| ||
|
|
|
|
|
| |||
See notes to
Financial Statements
F-3
HI-TECH
PHARMACAL CO., INC.
STATEMENTS OF OPERATIONS
|
Year Ended April 30,
|
||||||||||
|
2002
|
2001
|
2000
|
||||||||
|
NET SALES |
$ |
33,282,000 |
|
29,649,000 |
|
26,414,000 |
| |||
|
Cost of goods
sold |
|
17,507,000 |
|
15,315,000 |
|
14,979,000 |
| |||
|
|
|
|
|
|
|
| ||||
|
GROSS PROFIT |
|
15,775,000 |
|
14,334,000 |
|
11,435,000 |
| |||
|
COST AND
EXPENSES: |
||||||||||
|
Selling, general and
administrative expense |
|
8,941,000 |
|
9,197,000 |
|
7,786,000 |
| |||
|
Research and
product |
||||||||||
|
development
costs |
|
1,747,000 |
|
1,683,000 |
|
1,367,000 |
| |||
|
Contract research
(income) |
|
(368,000 |
) |
(250,000 |
) |
(279,000 |
) | |||
|
Interest
expense |
|
55,000 |
|
104,000 |
|
126,000 |
| |||
|
Interest (income) and
other |
|
(202,000 |
) |
(319,000 |
) |
(277,000 |
) | |||
|
|
|
|
|
|
|
| ||||
|
TOTAL |
$ |
10,173,000 |
|
10,415,000 |
|
8,723,000 |
| |||
|
|
|
|
|
|
|
| ||||
|
Income before provision for
income taxes |
|
5,602,000 |
|
3,919,000 |
|
2,712,000 |
| |||
|
Provision for income
taxes |
|
2,089,000 |
|
1,528,000 |
|
1,020,000 |
| |||
|
|
|
|
|
|
|
| ||||
|
NET INCOME |
$ |
3,513,000 |
|
2,391,000 |
|
1,692,000 |
| |||
|
|
|
|
|
|
|
| ||||
|
BASIC EARNINGS PER
SHARE |
|
0.79 |
|
0.55 |
|
0.38 |
| |||
|
|
|
|
|
|
|
| ||||
|
DILUTED EARNINGS PER
SHARE |
|
0.71 |
|
0.54 |
|
0.38 |
| |||
|
|
|
|
|
|
|
| ||||
|
WEIGHTED AVERAGE COMMON SHARES
OUTSTANDING BASIC |
|
4,460,000 |
|
4,357,000 |
|
4,401,000 |
| |||
|
EFFECT OF POTENTIAL COMMON
SHARES |
|
458,000 |
|
57,000 |
|
57,000 |
| |||
|
|
|
|
|
|
|
| ||||
|
WEIGHTED AVERAGE COMMON SHARES
OUTSTANDING DILUTED |
|
4,918,000 |
|
4,414,000 |
|
4,458,000 |
| |||
|
|
|
|
|
|
|
| ||||
F-4
HI-TECH
PHARMACAL CO., INC.
STATEMENTS OF CHANGES IN STOCKHOLDERS’ EQUITY
|
Common Stock
|
Additional Paid in Capital
|
Retained Earnings
|
Treasury
Stock at Cost
|
Total
Stockholders’ Equity
|
|||||||||||
|
Shares
|
Amount
|
||||||||||||||
|
BALANCE—APRIL 30,
1999 |
4,526,000 |
$ |
45,000 |
8,634,000 |
8,965,000 |
(337,000 |
) |
17,307,000 |
| ||||||
|
Net income |
— |
|
— |
— |
1,692,000 |
— |
|
1,692,000 |
| ||||||
|
Treasury stock |
— |
|
— |
— |
— |
(260,000 |
) |
(260,000 |
) | ||||||
|
|
|
|
|
|
|
|
|
| |||||||
|
BALANCE—APRIL 30,
2000 |
4,526,000 |
|
45,000 |
8,634,000 |
10,657,000 |
(597,000 |
) |
18,739,000 |
| ||||||
|
Net income |
— |
|
— |
— |
2,391,000 |
— |
|
2,391,000 |
| ||||||
|
Consulting expense
attributable to options and warrants |
51,000 |
51,000 |
| ||||||||||||
|
Exercise of
options |
1,000 |
3,000 |
3,000 |
| |||||||||||
|
Treasury stock |
— |
|
— |
— |
— |
(204,000 |
) |
(204,000 |
) | ||||||
|
|
|
|
|
|
|
|
|
| |||||||
|
BALANCE—APRIL 30,
2001 |
4,527,000 |
|
45,000 |
8,688,000 |
13,048,000 |
(801,000 |
) |
20,980,000 |
| ||||||
|
Net income |
3,513,000 |
3,513,000 |
| ||||||||||||
|
Consulting expense
attributable to options |
106,000 |
106,000 |
| ||||||||||||
|
Exercise of
options |
202,000 |
|
2,000 |
915,000 |
— |
— |
|
917,000 |
| ||||||
|
Tax benefit from exercise of
options |
595,000 |
595,000 |
| ||||||||||||
|
|
|
|
|
|
|
|
|
| |||||||
|
BALANCE—APRIL 30,
2002 |
4,729,000 |
$ |
47,000 |
10,304,000 |
16,561,000 |
(801,000 |
) |
26,111,000 |
| ||||||
|
|
|
|
|
|
|
|
|
| |||||||
See notes to
Financial Statements
F-5
HI-TECH
PHARMACAL CO., INC.
STATEMENTS OF CASH FLOWS
|
Year Ended April 30,
|
||||||||||
|
2002
|
2001
|
2000
|
||||||||
|
CASH FLOWS FROM OPERATING
ACTIVITIES: |
||||||||||
|
Net income |
$ |
3,513,000 |
|
2,391,000 |
|
1,692,000 |
| |||
|
Adjustments to reconcile net
income to net cash provided by operating |
||||||||||
|
activities: |
||||||||||
|
Depreciation and
amortization |
|
1,225,000 |
|
1,273,000 |
|
1,355,000 |
| |||
|
Loss on sale of
equipment |
|
10,000 |
|
|||||||
|
Valuation of options and
warrants for consulting expense |
|
106,000 |
|
51,000 |
|
— |
| |||
|
Deferred income
taxes |
|
(121,000 |
) |
(246,000 |
) |
(32,000 |
) | |||
|
Tax benefit from exercise of
options |
|
595,000 |
|
— |
|
— |
| |||
|
Provision for doubtful
accounts |
|
30,000 |
|
— |
|
(65,000 |
) | |||
|
CHANGES IN OPERATING ASSETS
AND LIABILITIES: |
||||||||||
|
Accounts
receivable |
|
(1,145,000 |
) |
363,000 |
|
(519,000 |
) | |||
|
Inventory |
|
(533,000 |
) |
(565,000 |
) |
(637,000 |
) | |||
|
Prepaid taxes / Taxes
payable |
|
(717,000 |
) |
957,000 |
|
(35,000 |
) | |||
|
Other current
assets |
|
60,000 |
|
(109,000 |
) |
(170,000 |
) | |||
|
Other assets |
|
19,000 |
|
(74,000 |
) |
(60,000 |
) | |||
|
Accounts
payable |
|
1,225,000 |
|
(1,022,000 |
) |
1,231,000 |
| |||
|
Accrued
expenses |
|
(157,000 |
) |
464,000 |
|
435,000 |
| |||
|
|
|
|
|
|
|
| ||||
|
NET CASH PROVIDED BY
OPERATING ACTIVITIES |
$ |
4,110,000 |
|
3,483,000 |
|
3,195,000 |
| |||
|
CASH FLOWS FROM INVESTING
ACTIVITIES: |
||||||||||
|
Purchase of fixed
assets |
|
(1,329,000 |
) |
(873,000 |
) |
(1,511,000 |
) | |||
|
Proceeds from sale of
equipment |
|
50,000 |
|
|||||||
|
Deposit for purchase of
building |
|
(65,000 |
) |
|||||||
|
|
|
|
|
|
|
| ||||
|
NET CASH (USED IN)
INVESTING ACTIVITIES |
$ |
(1,344,000 |
) |
(873,000 |
) |
(1,511,000 |
) | |||
|
CASH FLOWS FROM FINANCING
ACTIVITIES: |
||||||||||
|
Payments—long-term debt and
notes payable |
|
(340,000 |
) |
(446,000 |
) |
(447,000 |
) | |||
|
Proceeds from exercise of
options |
|
917,000 |
|
3,000 |
|
— |
| |||
|
Purchase of treasury
stock |
|
— |
|
(204,000 |
) |
(260,000 |
) | |||
|
|
|
|
|
|
|
| ||||
|
NET CASH PROVIDED BY (USED
IN) FINANCING ACTIVITIES |
$ |
577,000 |
|
(647,000 |
) |
(707,000 |
) | |||
|
|
|
|
|
|
|
| ||||
|
NET INCREASE IN CASH AND
CASH EQUIVALENTS |
|
3,343,000 |
|
1,963,000 |
|
977,000 |
| |||
|
Cash and cash equivalents at
beginning of year |
|
7,144,000 |
|
5,181,000 |
|
4,204,000 |
| |||
|
|
|
|
|
|
|
| ||||
|
CASH AND CASH EQUIVALENTS
AT END OF YEAR |
$ |
10,487,000 |
|
7,144,000 |
|
5,181,000 |
| |||
|
|
|
|
|
|
|
| ||||
|
SUPPLEMENTAL DISCLOSURES OF
CASH FLOW INFORMATION: |
||||||||||
|
Cash paid
for: Interest |
$ |
57,000 |
|
100,000 |
|
128,000 |
| |||
|
Income
taxes |
$ |
2,317,000 |
|
641,000 |
|
758,000 |
| |||
See notes to
Financial Statements
F-6
(NOTE
A) The Company and Summary of Significant Accounting
Policies:
[1] Business:
Hi-Tech Pharmacal Co., Inc. manufactures and sells prescription and
over-the- counter generic drugs, in liquid and semi-solid dosage forms including
higher margin prescription products. In the generic drug industry, certain
products may contribute significantly to a Company’s gross profit. The gross
profit on these products may change as market conditions change. The Company
markets its products in the United States through distributors, retail drug and
mass- merchandise chains and mail order companies. Sales of the Company are
seasonal and usually peak between September and March of each year. This
seasonality is caused by the fact that a significant portion of the Company’s
products are pharmaceutical preparations acting on the the human respiratory
system. There was no one product which accounted for sales of 10% or more of
total sales for each respective period.
Generic pharmaceutical products, which includes private label contract
manufacturing, had net sales of $27,232,000, $23,715,000 and $20,204,000 for
years ended April 30, 2002, 2001 and 2000, respectively.
Health Care Products division, which markets the Company’s branded
products, had net sales of $6,050,000, $5,934,000, and $6,210,000 for the years
ended April 30, 2002, 2001 and 2000, respectively.
[2] Inventory:
F-7
Inventories are valued at the lower of cost (first-in first-out or
average cost) or market.
[3] Property and equipment:
Property and equipment is stated at cost less accumulated depreciation.
Estimated accumulated depreciation and amortization of the respective assets is
computed using the straight line method over their estimated useful lives.
[4] Income taxes:
The Company uses the liability method to account for deferred income
taxes in accordance with statement of financial accounting standards (“SFAS”)
No. 109. The liability method measures deferred income taxes by applying enacted
statutory rates in effect at the balance sheet date to the differences between
the tax bases of assets and liabilities and their reported amounts in the
financial statements. The resulting asset or liability is adjusted to reflect
changes in the tax law as they occur.
[5] Revenue recognition:
Sales are recorded as products are shipped and collection of sales
proceeds is reasonably assured and the Company has no further performance
obligations. Estimated sales returns and discounts are provided for. Contract
research income is recognized as work is completed and as billable costs are
incurred. In certain cases, contract research income is based on attainment of
designated milestones.
[6] Advertising Expense:
Advertising costs are expensed when first shown. Advertising expense for
the years ended April 30, 2002, 2001 and 2000 amounted to $1,682,000,
$1,979,000,and $1,888,000 respectively.
[7] Cash
and cash equivalents:
The Company considers U.S. Treasury bills and government agency
obligations with a maturity of three months or less when purchased to be cash
equivalents.
[8] Net
income per share:
Net income per common share is computed based on the weighted average
number of common shares outstanding for basic earnings per share and on the
weighted average number of common shares and common share equivalents
outstanding for diluted earnings per share.
[9] Long-lived assets:
In accordance with Statement of Financial Accounting Standards No. 121,
“Accounting for the Impairment of Long-Lived Assets and for Long-Lived Assets to
be Disposed of”, the Company records impairment losses on long-lived assets used
in operations, including intangible assets, when events and circumstances
indicate that the assets might be impaired and the un-discounted cash flows
estimated to be generated by those assets are less than the carrying amounts of
those assets. No such losses have been incurred.
[10] Use
of estimates:
The preparation of financial statements in conformity with accounting
principles generally accepted in the United States of America requires
management to make estimates and assumptions that affect the reported amounts of
assets and liabilities and disclosure of contingent assets and liabilities at
the date of the financial statements and the reported amounts of revenues and
expenses during the reporting period. Actual results could differ from those
estimates.
[11] Stock based compensation:
F-8
The Company accounts for its stock based compensation plans under
Accounting Principles Board Opinion No. 25, “Accounting for Stock Issued to
Employees”. The Financial Accounting Standards Board issued SFAS No. 123,
“Accounting for Stock—Based Compensation” (“SFAS No. 123”). SFAS No. 123
established a fair value based method of accounting for stock based compensation
plans. The Company has adopted the disclosure requirements of SFAS No. 123 and
has presented the proforma effects on earnings and earnings per share as if SFAS
No. 123 had been adopted, as well as certain other information (see Note L[4]).
[12] New
accounting pronouncements:
In August 2001, the Financial Accounting Standards Board (“FASB”) issued
SFAS No. 144, Accounting for the Impairment or Disposal of Long-Lived Assets.
SFAS 144 addresses financial accounting and reporting for the impairment or
disposal of long-lived assets. SFAS 144 is effective for fiscal years beginning
after December 5, 2001, and interim periods within those fiscal years with
early application encouraged.
In June 2001, the FASB issued SFAS 143, Accounting for Asset Retirement
Obligations. SFAS 143 requires that the fair value of a liability for an asset
retirement obligation be recognized in the period in which it is incurred if a
reasonable estimate of fair value can be made. The provisions of SFAS 143 are
effective for financial statements issued for fiscal years beginning after June
15, 2002.
In June 2001, the FASB issued SFAS No. 141, Business Combinations, and
SFAS No. 142, Goodwill and Other Intangible Assets. SFAS 141 requires that the
purchase method of accounting be used for all business combinations subsequent
to June 30, 2001 and specifies criteria for recognizing intangible assets
acquired in a business combination. Under SFAS No. 142, we will be required to
re-assess the goodwill and other intangible assets previously recorded in
connection with prior acquisitions, as well as their useful lives. SFAS No. 142
requires that goodwill and intangible assets with indefinite useful lives no
longer be amortized, but instead be tested for impairment at least annually.
Whenever there is an impairment indicator, all acquired goodwill must be
assigned to reporting units for purposes of impairment testing and segment
reporting. Effective January 1, 2002, goodwill will no longer be subject to
amortization. Intangible assets with definite useful lives will continue to be
amortized over their respective lives.
Management does not anticipate that adoption of these standards will have
a material impact on our financial position or results of operations.
F-9
(NOTE
B) Inventory:
The components of inventory consist of the following:
|
April 30,
| |||||
|
2002
|
2001
| ||||
|
Finished goods and work in
process |
$ |
2,667,000 |
2,114,000 | ||
|
Raw materials |
|
3,353,000 |
3,373,000 | ||
|
|
|
| |||
|
Total |
$ |
6,020,000 |
5,487,000 | ||
|
|
|
| |||
(NOTE
C) Property and Equipment:
The components of net property and equipment consist of the following:
|
April 30,
| ||||||
|
2002
|
2001
| |||||
|
Land and building and
improvements |
$ |
5,787,000 |
|
5,773,000 | ||
|
Machinery and
equipment |
|
12,294,000 |
|
11,588,000 | ||
|
Transportation
equipment |
|
13,000 |
|
13,000 | ||
|
Computer
equipment |
|
777,000 |
|
639,000 | ||
|
Furniture and
fixtures |
|
477,000 |
|
324,000 | ||
|
|
|
|
| |||
|
$ |
19,348,000 |
|
18,337,000 | |||
|
Accumulated depreciation and
amortization |
|
10,344,000 |
|
9,377,000 | ||
|
|
|
|
| |||
|
Total property and
equipment—net |
$ |
9,004,000 |
$ |
8,960,000 | ||
|
|
|
|
| |||
(NOTE
D) Other Assets:
Included in other assets is the Company’s investment in a joint venture
for the marketing and development of a nutritional supplement. The net
investment is approximately $159,000 and $148,000 at April 30, 2002 and 2001
respectively. The Company was released from its guarantee of $1,500,000 of
revolving debt of this joint venture to its lender. Mr. Reuben Seltzer, a
director of the Company, has an ownership interest in the joint venture and is
the son of Mr. Bernard Seltzer, Chairman of the Board of the Company. The
results of operations of the joint venture were not material to the results of
operations of the Company.
(NOTE
E) Customer Deposits and Contract Research Income:
Contract research income is recognized as work is completed and as
billable costs are incurred. In certain cases, contract research income is based
on attainment of designated milestones. Advance payments may be received to fund
certain development costs.
(NOTE
F) Note Payable Bank:
F-10
On February 2, 2000 the Company renewed its $6,000,000 working capital
credit line which expires January 31, 2003. At April 30, 2002 the rate for
borrowing was 5.25% and there was no balance outstanding. Borrowing under the
line is collateralized by inventory, accounts receivable and all other assets.
The agreement contains covenants with respect to working capital, net worth and
certain financial ratios, as well as other covenants and prohibits the payment
of cash dividends.
(NOTE
G) Long Term Debt:
Long-term debt consists of the following:
|
April 30,
| |||||
|
2002
|
2001
| ||||
|
Mortgage
payable(1) |
$ |
25,000 |
85,000 | ||
|
Mortgage
payable(2) |
|
123,000 |
216,000 | ||
|
Mortgage
payable(3) |
|
69,000 |
106,000 | ||
|
Equipment term loan
collateralized by the Related equipment purchased, inventory, and accounts
receivable and other assets(4) |
|
0 |
150,000 | ||
|
|
|
| |||
|
Total |
$ |
217,000 |
557,000 | ||
|
Less current
portion |
|
155,000 |
340,000 | ||
|
|
|
| |||
|
Long-term debt |
$ |
62,000 |
217,000 | ||
|
|
|
| |||
|
[1] |
|
The mortgage is
payable over ten years in monthly installments of $5,000 plus interest at
8.26% at April 30, 2002. |
|
[2] |
|
The mortgage is
payable in monthly installments of approximately $8,000 and interest at a
varying rate of 1/2% above the bank’s prime rate,4.75% at April 30,
2002. |
|
[3] |
|
The mortgage is
payable in monthly installments of $3,125 plus interest at the rate of
1/2% over
the bank’s prime rate,4.75% per annum through September 2002.
|
|
[4] |
|
The equipment term
loan bears interest at 1/2% above the bank’s prime lending rate, 4.75% or 1.5%
above the Libor rate,6.6% at April 30, 2001. The loan requires monthly
payments of principal in the amount of $21,429 plus interest.
|
F-11
(NOTE
G) Long Term Debt: (continued)
Long term debt is payable as follows:
|
2003 |
$ |
155,000 | |
|
2004 |
|
62,000 | |
|
|
| ||
|
Total |
$ |
217,000 | |
|
|
|
(NOTE
H) Related Party Transactions:
The Chairman of the Board’s employment agreement, as amended, effective
as of May 1, 2001 expires on April 30, 2004, pursuant to which he agreed to
serve in his capacity at an annual salary of approximately $242,000 and may
receive a bonus during each year of employment equal to 1% of the increase in
net sales of the Company. The President and Chief Executive Officer, Chief
Operating Officer, Secretary and Treasurer agreed to serve in his capacity
through April 30, 2004 at an annual salary of approximately $347,000 for the
fiscal year May 1, 2001 through April 30, 2002 and receives a guaranteed bonus
during each year of employment in the amount equal to 3% of the Company’s
pre-tax net income for such year in the event the Company pre-tax net income
exceeds $2 million.
Increases in annual base salary for each fiscal year thereafter are
determined by multiplying the annual base salary for the prior fiscal year by
the greater of 5% or the increase in the Consumer Price Index as of May 1 of
each such year over the index as of May 1 of the prior year. The Board of
Directors in its discretion will determine the additional annual bonus, if any,
to be received. The employment agreements also contain standard confidentiality
provisions and a non-compete provision for a term of one year after the
termination of their employment.
The Company utilizes the services of Reuben Seltzer, an attorney and a
director, and the son of the Company’s Chairman of the Board. He provided legal
and new business development services throughout the year. For each of the
fiscal years 2002, 2001 and 2000 he received fees and expense reimbursements of
$128,000, $102,000 and $ 93,000, respectively. In addition, in each of fiscal
years 2002 and 2001 the Company granted him an option to purchase 25,000 shares
of the Company’s common stock at an exercise price of $9.50 and $4.00
respectively which vests at 25% per annum exercisable through November 10, 2006.
During the year ended April 30, 2002 and 2001, the Company valued this option
using the Black Scholes option pricing model at $93,000 and $9,000 respectively
which were charged to operations. The Company valued this option using the Black
Scholes option pricing model assuming risk free rate of 3.66%-4.53%, volatility
of 42%-58%, dividend yield of 0%, 5 year term and a stock price of $11.30
to $11.60 and an exercise price of $4.00 to $8.64 for the year ended April 30,
2002 and a risk free rate of 4.76%, volatility of 4.2%, dividend yield of 0%,
five year term, stock price of $5.68 and an exercise price of $4.00 on April 30,
2001. The Company may record additional expense relating to this option as and
when they vest at the then market price.
(NOTE
I) Commitments and Contingencies:
[1] Government regulation:
The Company’s products and facilities are subject to regulation by number
of Federal and State governmental agencies. The Food and Drug Administration
(“FDA”), in particular, maintains oversight of the formulation, manufacture,
distribution, packaging and labeling of all of the Company’s products.
In July 1999 the FDA issued a “Warning Letter” which indicated certain
areas of particular concern. The Company responded to the FDA with its
Corrective Action Plan as a result of the Warning Letter. The plan included the
hiring of additional personnel in certain areas of the Company’s operations
which resulted in additional overhead expense. In October 1999 and July 2000,
the
F-12
FDA commenced a new
inspection. The results of these inspections and such additional expense
resulting from the Corrective Action Plan did not have a material adverse affect
on the Company’s operations or financial condition. In June 2002, the FDA
approved the Company’s application to manufacture and market its 20mg / 5ml
Fluoxetine Oral Solution.
Pending regulatory matters are not expected to have a material effect on
the Company’s financial condition and the Company believes that it is
substantially in compliance with the FDA’s Good Manufacturing Practices.
[2] Employment agreements:
The Company has entered into a two year employment agreement with its
Vice President-Finance and Chief Financial Officer ending on July 31, 2002. The
agreement provides for an annual base salary of approximately $140,000 and an
annual bonus to be determined at the discretion of the Board of Directors. An
increase in annual base salary for each year thereafter is determined by
multiplying his annual base salary for the prior fiscal year by the greater of
5% or the increase in the Consumer Price Index as of September 1 of each such
year over the index as of September 1 of the prior year.
See Note H for other employment agreements.
[3] Leased property:
On July 18, 1996, the Company executed an operating lease for a 50,000
square foot building in Amityville, New York which expires January 31, 2003. The
Company is responsible for all operating costs of this facility and has
exercised an option to purchase the premises at the end of the lease for
$1,300,000. Rental expense for the fiscal year ended April 30, 2002, 2001 and
2000 was approximately $209,000, $199,000 and $194,000 respectively.
(NOTE
J) Fair Value of Financial Instruments:
The carrying amounts of certain financial instruments such as cash and
cash equivalents, accounts receivable, accounts payable, short-term borrowings
and long-term debt approximate their fair values. The fair value of the
financial instruments are determined by reference to market data and other
valuation techniques, as appropriate.
F-13
(NOTE
K) Income Taxes:
[1] The provision for
income taxes is comprised of the following:
|
Year Ended April 30,
|
||||||||||
|
2002
|
2001
|
2000
|
||||||||
|
Current: |
||||||||||
|
Federal |
$ |
1,948,000 |
|
1,658,000 |
|
946,000 |
| |||
|
State |
|
262,000 |
|
116,000 |
|
106,000 |
| |||
|
Deferred: |
||||||||||
|
Federal |
|
(103,000 |
) |
(209,000 |
) |
(29,000 |
) | |||
|
State |
|
(18,000 |
) |
(37,000 |
) |
(3,000 |
) | |||
|
|
|
|
|
|
|
| ||||
|
Total |
$ |
2,089,000 |
|
1,528,000 |
|
1,020,000 |
| |||
|
|
|
|
|
|
|
| ||||
[2] Expected tax expense based on the statutory rate is
reconciled with actual tax expense as follows:
|
Year Ended April 30
|
|||||||||
|
2002
|
2001
|
2000
|
|||||||
|
Statutory rate |
34.0 |
% |
34.0 |
% |
34.0 |
% | |||
|
State income tax, net of
federal income tax benefit |
3.3 |
% |
3.4 |
% |
2.6 |
% | |||
|
Other |
0.0 |
% |
1.5 |
% |
1.0 |
% | |||
|
|
|
|
|
|
| ||||
|
Effective tax
rate |
37.3 |
% |
38.9 |
% |
37.6 |
% | |||
|
|
|
|
|
|
| ||||
[3] Deferred tax benefit is composed of the following:
|
Year Ended April 30,
|
||||||||||
|
2002
|
2001
|
2000
|
||||||||
|
Depreciation and
amortization |
$ |
(44,000 |
) |
(107,000 |
) |
(42,000 |
) | |||
|
Inventory uniform
capitalization |
|
(20,000 |
) |
— |
|
10,000 |
| |||
|
Accrued
expenses |
|
(57,000 |
) |
(139,000 |
) |
— |
| |||
|
|
|
|
|
|
|
| ||||
|
$ |
(121,000 |
) |
(246,000 |
) |
(32,000 |
) | ||||
|
|
|
|
|
|
|
| ||||
[4] The
deferred tax liability at April 30, 2002 and 2001relates principally to
depreciation. The deferred tax asset at April 30, 2002 and 2001 relates
principally to certain accrued expenditures not currently deductible for tax
purposes.
F-14
(NOTE
L) Common Stock:
[1] Stock Option Plans:
The Company’s 1992 Stock Option Plan, as amended (the “Plan”) provides
for the issuance of either incentive stock options or non-qualified options. The
maximum number of shares of common stock for which options may be granted is
1,175,000 shares. All stock options granted are exercisable at a price
determined by the stock option committee of the Plan. However, Incentive Stock
Options (“ISOs”), as defined by the Internal Revenue Code, must not be less than
the fair market value of the stock, at the date of grant. All options are
exercisable in installments commencing one year from date of grant and must be
exercised within ten years of the date of grant, except for ISOs granted to
persons owning more than 10% of the Company’s common stock which must be
exercised within five years of the date of the grant.
In August 1994 the Company adopted the 1994 Directors Stock Option Plan
and reserved 100,000 shares of common stock for issuance thereunder. The plan
provides for the annual grant of options to purchase 5,000 shares of common
stock (plus 500 additional shares for committee chairpersons) to non-employee
directors at fair market value at the date of grant.
In March 2001, the Company granted 5,000 options under the Plan to a
consultant for promotion services. The options vest 50% immediately and 50% in
six months. The options are exercisable at $ 6.00 per share through March 1,
2004. The Company has valued these options using the Black Scholes option
pricing model assuming risk free rates of 4.46%, volatility of 42%, dividend
yield of 0%, term of 3 years, and stock price of $5.68 and $8.97 for years ended
April 30, 2001 and April 30, 2002, respectively, and charged operations $13,000
and $ 4,000 for the years ended April 30, 2002 and 2001, respectively.
[2] Additional information with respect to the 1992
Stock Option Plan is as follows:
|
Options
|
Exercisable Options
| |||||||||
|
Number of
Shares
|
Weighted Average Exercise
Price Per
Share
|
Number of
Shares
|
Weighted
Average Exercise
Price Per
Share
| |||||||
|
Outstanding at April 30,
1999 |
781,125 |
|
$ |
5.040 |
456,763 |
5.40 | ||||
|
|
| |||||||||
|
Cancelled |
(14,350 |
) |
$ |
4.610 |
||||||
|
|
|
|
|
|||||||
|
Outstanding at April 30,
2000 |
766,775 |
|
$ |
4.950 |
568,538 |
5.20 | ||||
|
|
|
|
| |||||||
|
Cancelled |
(25,575 |
) |
$ |
4.850 |
||||||
|
Exercised |
(625 |
) |
$ |
4.500 |
||||||
|
Granted |
162,450 |
|
$ |
4.070 |
||||||
|
|
|
|
|
|||||||
|
Outstanding at April 30,
2001 |
903,025 |
|
$ |
4.790 |
644,838 |
5.07 | ||||
|
|
|
|
| |||||||
|
Cancelled |
(4,550 |
) |
$ |
4.406 |
||||||
|
Exercised |
(198,350 |
) |
$ |
4.590 |
||||||
|
Granted |
180,450 |
|
$ |
8.885 |
||||||
|
|
|
|
|
|||||||
|
Outstanding at April 30,
2002 |
880,575 |
|
$ |
5.676 |
564,811 |
5.10 | ||||
|
|
|
|
|
|
| |||||
F-15
Employee
As of April 30, 2002, 78,175 shares were available for future
grant under the Plan. The weighted average remaining contractual life of the
outstanding options are 5.58 years and the range of exercise prices are as
follows:
|
Range of exercise price
|
Number of
Shares
| |||
|
From
|
To
|
|||
|
$3.50 |
$4.75 |
383,787 | ||
|
$4.75 |
$6.00 |
163,488 | ||
|
$6.00 |
$7.25 |
152,850 | ||
|
$7.25 |
$9.00 |
180,450 | ||
|
880,575 | ||||
(NOTE
L) Common Stock (continued):
[3] Additional information with respect to the 1994
Directors Stock Option Plan is as follows:
|
Options
|
Exercisable Options
| ||||||||||
|
Number of
Shares
|
Weighted Average Exercise Price Per Share
|
Number of
Shares
|
Weighted
Average Exercise Price Per Share
| ||||||||
|
Outstanding at April 30,
1999 |
45,500 |
|
$ |
5.640 |
22,250 |
$ |
5.580 | ||||
|
|
|
| |||||||||
|
Granted |
10,000 |
|
$ |
4.500 |
|||||||
|
|
|
||||||||||
|
Outstanding at April 30,
2000 |
55,500 |
|
$ |
5.430 |
30,625 |
$ |
6.090 | ||||
|
|
|
| |||||||||
|
Granted |
13,500 |
|
$ |
4.310 |
|||||||
|
|
|
||||||||||
|
Outstanding at April 30,
2001 |
69,000 |
|
$ |
5.190 |
40,500 |
$ |
5.750 | ||||
|
|
|
| |||||||||
|
Granted |
15,500 |
|
$ |
9.650 |
|||||||
|
Exercised |
(3,500 |
) |
$ |
4.625 |
|||||||
|
|
|
|
|
||||||||
|
Outstanding at April 30,
2002 |
81,000 |
|
$ |
6.074 |
46,750 |
$ |
5.579 | ||||
|
|
|
|
|
|
|
| |||||
F-16
As of April 30, 2002, 15,500 shares were available for future grant under
the Plan. The weighted average remaining contractual life of the outstanding
options is 6.6 years and the range of exercise prices are as follows:
|
Range of exercise price
|
Number of
Shares
| |||
|
From
|
To
|
|||
|
$4.25 |
$ 5.25 |
43,500 | ||
|
$5.25 |
$ 6.50 |
6,000 | ||
|
$6.50 |
$ 7.75 |
16,000 | ||
|
$7.75 |
$10.00 |
15,500 | ||
|
81,000 | ||||
(NOTE
L) Common Stock (continued):
[4] The
Company applies APB 25 in accounting for its stock option plan, which requires
the recognition of compensation expense for the difference between the fair
value of the underlying common stock and the grant price of the option at the
grant date. Had the compensation expense been determined based upon the fair
value at the grant date, as prescribed under SFAS No. 123, the Company’s net
profit for the years ended April 30, 2002, 2001 and 2000, would have been as
follows:
|
Year EndeD April 30
| |||||||||
|
2002
|
2001
|
2000
| |||||||
|
Net income: |
|||||||||
|
As reported |
$ |
3,513,000 |
|
2,391,000 |
|
1,692,000 | |||
|
Pro-forma under SFAS
123 |
$ |
3,343,000 |
|
2,220,000 |
|
1,509,000 | |||
|
Earnings per
share: |
|||||||||
|
As reported |
|||||||||
|
Basic |
$ |
0.79 |
$ |
0.55 |
$ |
0.38 | |||
|
Diluted |
$ |
0.71 |
$ |
0.54 |
$ |
0.38 | |||
|
Pro-forma under SFAS
123 |
|||||||||
|
Basic |
$ |
0.75 |
$ |
0.51 |
$ |
0.34 | |||
|
Diluted |
$ |
0.68 |
$ |
0.50 |
$ |
0.34 | |||
The fair value of each option is estimated on the date of grant using the
Black Scholes option pricing model with the following weighted average
assumptions:
|
2002
|
2001
|
2000
|
|||||||
|
Risk-free interest
rate |
4.24 - 4.53 |
% |
4.89 - 6.33 |
% |
6.03 |
% | |||
|
Expected life of
options |
5 |
|
5 |
|
5 |
| |||
|
Expected stock price
volatility |
61.00 |
% |
42.00 |
% |
61.00 |
% | |||
|
Expected dividend
yield |
0.00 |
% |
0.00 |
% |
0.00 |
% |
The Black Scholes option valuation model was developed for use in
estimating the fair value of traded options which have no vesting restrictions
and are fully transferable. Because the Company’s stock
F-17
(NOTE
L) Common Stock (continued):
options have
characteristics significantly different from those of traded options, and
because changes in the subjective input assumptions can materially affect the
fair value estimate, in management’s opinion, the existing models do not
necessarily provide a reliable single measure of the fair value of its stock
options. The pro-forma effect on net income in fiscal 2002, 2001 and 2000 is not
necessarily representative of the pro-forma effect on net income in future years
because it does not take into consideration pro-forma compensation expense
related to grants made prior to fiscal 1998. The weighted average fair value of
options granted is $4.83 in fiscal 2002, $4.31 in fiscal 2001 and $4.50 in
fiscal 2000.
[5] Stock buy-back program:
In May 1997, the Company announced a stock buy-back program under which
the Board of Directors authorized the purchase of up to $1,000,000 of its common
stock. As of April 30, 2002 the Company had purchased 194,700 shares at a cost
of $801,000.
[6] Warrants:
In November 2000, the Company granted 25,000 Warrants to a consultant in
return for financial advisory services. The warrants which vested immediately
are exercisable at $5.50 per share through March 15, 2005. The Company valued
these warrants at $38,000 using the Black Scholes model and charge operations
immediately.
(NOTE
M) Significant Customers and Concentration of Credit
Risk:
No customer accounted for net sales of 10% or more for the year ended
April 30, 2002, One major customer accounted for net sales of approximately 10%
for the year ended April 30, 2001 and 14% for the year ended April 30, 2000,
respectively. One customer represented approximately 12% of the outstanding
trade receivables at April 30, 2002. Cash in excess of Federal Deposit Insurance
Company limitations may be held in certain banks.
(NOTE
N) Savings Plan:
The Company has a defined contribution plan that qualifies under Section
401(k) of the Internal Revenue Code for the benefit of substantially all full
time eligible employees. Employees may contribute between 1% and 15% of their
salary up to the dollar maximum allowed by the Internal Revenue Service. Company
contributions are voluntary and are made at the discretion of the Board of
Directors. The Company contributed $106,000, $87,000 and $71,000, respectively,
for fiscal years 2002, 2001 and 2000.
F-18
(Note
O) Quarterly Financial Results (unaudited):
|
Quarter
|
|||||||||||
|
1
|
2
|
3
|
4
|
Year
| |||||||
|
Fiscal
2002 |
|||||||||||
|
Net Sales |
$ |
5,893,000 |
8,454,000 |
9,341,000 |
9,594,000 |
33,282,000 | |||||
|
Gross profit |
$ |
2,743,000 |
3,833,000 |
4,774,000 |
4,425,000 |
15,775,000 | |||||
|
Net income |
$ |
481,000 |
878,000 |
1,009,000 |
1,145,000 |
3,513,000 | |||||
|
Earnings per
share—Basic |
$ |
0.11 |
0.20 |
0.22 |
0.25 |
0.79 | |||||
|
Earnings per
share—Diluted |
$ |
0.10 |
0.18 |
0.20 |
0.23 |
0.71 | |||||
|
Fiscal
2001 |
|||||||||||
|
Net Sales |
$ |
5,023,000 |
7,870,000 |
8,839,000 |
7,917,000 |
29,649,000 | |||||
|
Gross profit |
$ |
2,229,000 |
3,291,000 |
4,298,000 |
4,516,000 |
14,334,000 | |||||
|
Net income |
$ |
271,000 |
509,000 |
660,000 |
951,000 |
2,391,000 | |||||
|
Earnings per
share—Basic |
$ |
0.06 |
0.12 |
0.15 |
0.22 |
0.55 | |||||
|
Earnings per
share—Diluted |
$ |
0.06 |
0.12 |
0.15 |
0.21 |
0.54 | |||||
Per common share amounts
for fiscal quarters have been calculated independently and may not in the
aggregate equal the amount for the full year.
Item 9. Changes in and
Disagreements With Accountants on Accounting and Financial
Disclosure.
NONE
F-19
INDEPENDENT AUDITORS’
REPORT ON SCHEDULE II
To the Board of Directors
and Stockholders
Hi-Tech Pharmacal Co.,
Inc.
Amityville, New York
Our audits were conducted
for the purpose of forming an opinion on the basic financial statements of
Hi-Tech Pharmacal Co., Inc. as of April 30, 2002 and 2001 and for each of the
years in the three-year period ended April 30, 2002 taken as a whole. The
information included on Schedule II is presented for purposes of additional
analysis and is not a required part of the basic financial statements. Such
information has been subjected to the auditing procedures applied in the audits
of the basic financial statements and, in our opinion, is fairly stated in all
material respects in relation to the basic financial statements taken as a
whole.
Eisner LLP (formerly
Richard A. Eisner & Company, LLP)
New York, New York
July 3, 2002
F-20
SCHEDULE
II
HI-TECH
PHARMACAL CO., INC
VALUATION
AND QUALIFYING ACCOUNTS
|
Description
|
Balance at
Beginning
of
Period
|
Charged
in
costs
and
expenses
|
Charged to
Other
Accounts
|
Deductions
|
Balance at
End
of
Period
| |||||
|
Allowance for doubtful
accounts |
||||||||||
|
Year ended April 30,
2002 |
240,000 |
30,000 |
a |
270,000 | ||||||
|
Year ended April 30,
2001 |
240,000 |
240,000 | ||||||||
|
Year ended April 30,
2000 |
305,000 |
65,000
a |
240,000 | |||||||
|
Accumulated
depreciation |
||||||||||
|
Year ended April 30,
2002 |
9,377,000 |
1,225,000 |
258,000 b |
10,344,000 | ||||||
|
Year ended April 30,
2001 |
8,104,000 |
1,273,000 |
9,377,000 | |||||||
|
Year ended April 30,
2000 |
6,764,000 |
1,355,000 |
15,000
b |
8,104,000 |
|
(a) |
|
Change in reserve
required |
|
(b) |
|
Disposition of
equipment or retirements |
F-21
PART III
Item
10. Directors and Executive Officers of The
Registrant.
The Board of Directors consists of six members. All Directors are elected
at each Annual Meeting of Shareholders and hold office until the next Annual
Meeting of Shareholders when their respective successors are duly elected and
qualified.
Set forth below is the name and age of each Director, his position with
the Company and his principal occupation during the past five years and the year
in which each Director was first elected as a Director of the Company.
|
Name of
Director
|
Principal Occupation
and
other Directorships
|
Age
|
Elected
to
the
Board
| |||
|
Bernard
Seltzer |
Bernard Seltzer has
been Chairman of the Company since January 1990. As of May 1, 1998 Mr.
Seltzer resigned as President and Chief Executive Officer of the Company.
From May 1983 to January 1990, Mr. Seltzer was Vice President of Sales of
the Company. Prior thereto, Mr. Seltzer was the Vice President of Sales
and Marketing of Ketchum Laboratories, Inc., a pharmaceutical manufacturer
and the predecessor of the Company. |
78 |
1983 |
18
|
Name of
Director
|
Principal Occupation
and
other Directorships
|
Age
|
Elected
to
the
Board
| |||
|
David S.
Seltzer |
David S. Seltzer
has been Chief Executive Officer and President of the Company since May 1,
1998 and a Director, Secretary and Treasurer since February 1992. From
July 1992 to May 1, 1998 Mr. Seltzer was Executive Vice
President-Administration and since July 1992, Vice President-
Administration and Chief Operating Officer of the Company since March
1992. Mr. Seltzer received a B.A. in Economics from Queens College in
1984. David S. Seltzer is the son of Bernard Seltzer. |
42 |
1992 | |||
|
Reuben Seltzer |
Reuben Seltzer has
been a Director of the Company since April 1992. Mr. Seltzer is currently
serving as a consultant to the Company on legal matters and special
projects. Mr. Seltzer has been president of R.M. Realty Services Inc., a
real estate investment and consulting company since May 1988. From May
1983 to May 1988 Mr. Seltzer was a vice president and attorney with
Merrill Lynch Hubbard Inc., a real estate investment subsidiary of Merrill
Lynch and Company. Mr. Seltzer received a B.A. in Economics from Queens
College in 1978, a Juris Doctor from the Benjamin N. Cardozo School of Law
in 1981 and a L.L.M. from the New York University School of Law in 1987.
Reuben Seltzer is the son of Bernard Seltzer. |
46 |
1992 | |||
|
Martin M.
Goldwyn |
Martin M. Goldwyn
was elected a Director of the Company in May 1992. Mr. Goldwyn is a member
in the law firm of Tashlik, Kreutzer, Goldwyn & Crandell P.C. Mr.
Goldwyn received a B.A. in finance from New York University in 1974 and a
Juris Doctor from New York Law School in 1977. |
50 |
1992 |
19
|
Name of
Director
|
Principal Occupation
and
other Directorships
|
Age
|
Elected to the Board
| |||
|
Yashar Hirshaut,
M.D. |
Yashar Hirshaut has
been a Director of the Company since September 1992.
Dr. Hirshaut is a
practicing medical oncologist and is currently an Associate Clinical
Professor of Medicine at Cornell University Medical College. Since July
1986, he has been a Research Professor of Biology at Yeshiva University.
In addition, he has served as editor-in-chief of the Professional Journal
of Cancer Investigation since July 1981. Dr. Hirshaut received a B.A. from
Yeshiva University in 1959 and his medical degree from Albert Einstein
College of Medicine in 1963. |
63 |
1992 | |||
|
Robert M.
Holster |
Robert M. Holster
was elected a Director of the Company in April, 2002. Mr. Holster is
President and Chief Operating Officer of Health Management Systems, Inc.
(NASD: HMSY), a company providing information based revenue enhancement
services to healthcare providers and payors. From 1993 to 1998 Mr. Holster
was President and Chief Executive Officer of HHL Financial Services Inc.,
a healthcare accounts receivable management company. Prior to that Mr.
Holster served in a number of executive positions, including Chief
Financial Officer of Macmillan, Inc. and Controller of Pfizer
Laboratories, a division of Pfizer, Inc. |
55 |
2002 |
Executive Officers
The executive officers of the Company are set forth in the table below.
All executive officers are elected at the annual meeting or interim meetings of
the Board of Directors. No arrangements or understanding exists between any
executive officer and any other person pursuant to which he was elected as an
executive officer.
20
|
Name
|
Age
|
Position and Period Served
| ||
|
Bernard
Seltzer |
78 |
Chairman of the
Company since January 1990. | ||
|
David S.
Seltzer |
42 |
Chief Executive
Officer and President of the Company since May 1, 1998 and a Director,
Secretary and Treasurer since February 1992. Mr. Seltzer served as
Executive Vice President of Administration since February
1992. | ||
|
Elan Bar-Giora |
58 |
Executive Vice
President-Operations of the Company since July 1992 and Vice
President-Operations of the Company since August 1990. | ||
|
Arthur S.
Goldberg |
60 |
Vice
President-Finance and Chief Financial Officer of the Company since
September 1991. |
Significant Employees
|
Name
|
Age
|
Position and Period Served
| ||
|
Michael
McConnell |
44 |
Director of Product
Development since January 1992. | ||
|
Gary M. April |
45 |
President of Health
Care Products Division since May 1998 and Divisional Vice President of
Sales since January 1993. | ||
|
Suzanne Fenton |
47 |
Director of
Compliance since September 1995. | ||
|
Jesse Kirsh |
41 |
Director of Quality
Assurance since March 1994. | ||
|
Pudpong
Poolsuk |
58 |
Senior Director of
Science since May 2000. | ||
|
Joanne Curri |
58 |
Director of
Regulatory Affairs since January 1992. | ||
|
Edward Berrios |
50 |
Vice
President—Sales since November 2000 and National Accounts Manager since
November 1997. | ||
|
Therese Ast |
60 |
Vice
President—Scientific Affairs since September,
2001. |
21
Section 16(a)
Beneficial Ownership Reporting Compliance
Section 16(a) of the Securities Exchange Act of 1934 requires the
Company’s Directors and Executive Officers and persons who own more than ten
percent of a registered class of the Company’s equity securities to file with
the Securities and Exchange Commission initial reports of ownership and reports
of changes in ownership of Common Stock and other equity securities of the
Company. Officers, Directors and greater than ten percent shareholders are
required by Securities and Exchange Commission regulation to furnish the Company
with copies of all Section 16(a) forms they file. The Company believes that all
Section 16(a) filing requirements were met during Fiscal 2002 except for one
filing of a Form 3 for Robert M. Holster and one filing of a Form 5 for Yashar
Hirshaut, MD, which were not timely made. In making this statement, the Company
has relied on the written representations of its incumbent directors and
officers and copies of the reports that they have filed with the Securities and
Exchange Commission and Nasdaq.
Item
11. Executive Compensation.
The following table shows, for the fiscal years ended April 30, 2002,
2001, and 2000, the compensation paid or accrued by the Company to or for each
of the executive officers of the Company.
I. SUMMARY COMPENSATION TABLE
|
Annual Compensation
|
Long Term Compensation Awards
|
|||||||||||
|
Awards
|
||||||||||||
|
Name and
Principal Position
|
Year
|
Salary($)
|
Bonus($)
|
Other Annual Compensation(1)($)
|
Securities Underlying Options/(#)(2)
|
All
Other
Compensation(3)
($)
| ||||||
|
Bernard Seltzer
Chairman |
2002
2001
2000 |
241,500
230,000
230,000 |
30,000
22,000
-0- |
—
—
— |
-0-
-0-
-0- |
-0-
-0-
-0- | ||||||
|
David S. Seltzer
President, Chief Executive Officer, Secretary and
Treasurer |
2002
2001
2000 |
347,000
325,000
325,000 |
154,000
119,000
-0- |
—
—
— |
50,000
50,000
50,000 |
5,600
5,413
3,241 | ||||||
|
Elan Bar-Giora
Executive Vice President-Operations |
2002
2001
2000 |
140,000
140,000
140,000 |
44,000
30,000
-0- |
—
—
— |
10,000
10,000
10,000 |
-0-
2,210
1,702 | ||||||
|
Arthur S.
Goldberg
Vice President of Finance and Chief Financial
Officer |
2002
2001
2000 |
138,000
132,000
125,000 |
15,000
-0-
-0- |
—
—
— |
7,500
7,500
7,500 |
—
—
— | ||||||
22
|
(1) |
|
The named executive
officers received various perquisites, the cost of which did not exceed
the lesser of $50,000 or 10% of annual salary plus bonus.
|
|
(2) |
|
Adjusted to reflect
a 3-for-2 stock split declared on November 1, 1993.
|
|
(3) |
|
Represents the
dollar value of the premium paid by the Company during the fiscal years
ended April 30, 2002, 2001 and 2000 with respect to term life insurance
for the benefit of the named executive officer.
|
Stock Options
The following table contains information concerning the grant of stock
options under the Company’s Amended and Restated Stock Option Plan (“Plan”) to
the named executive officers of the Company during Fiscal Year 2002.
II. OPTION GRANTS IN LAST FISCAL YEAR
|
Individual Grants
|
||||||||||||
|
Number of
Securities
Underlying
Options Granted(#)(1)
|
%
of Total
Options Granted to
Employees
in
Fiscal Year
|
Exercise
Price
($/Sh)
|
Expiration
Date
|
Potential Realizable Value at Assumed Annual Rates of Stock
Price Appreciation for Option Term
| ||||||||
|
Name
|
||||||||||||
|
5%($)
|
10%($)
| |||||||||||
|
Bernard
Seltzer |
-0- |
-0- |
-0- |
-0- |
-0- |
-0- | ||||||
|
David S.
Seltzer |
50,000 |
28.3 |
9.50 |
11/14/2006 |
252,000 |
427,000 | ||||||
|
Elan Bar-Giora |
10,000 |
5.7 |
8.64 |
11/14/2011 |
99,000 |
204,000 | ||||||
|
Arthur S.
Goldberg |
7,500 |
4.3 |
8.64 |
11/14/2011 |
74,000 |
153,000 | ||||||
|
(1) |
|
Options granted are
scheduled to vest and become exercisable in yearly increments of 25% with
full vesting occurring in four years. Options expire ten years after grant
under the terms of the Company’s Plan. |
Option Exercises And
Holdings
The following table sets forth information with respect to the named
executives concerning the exercise of options during Fiscal Year 2002 and
unexercised options held as of the end of Fiscal Year 2002.
23
III. AGGREGATED OPTION EXERCISES IN LAST FISCAL
YEAR AND FISCAL YEAR-END OPTION VALUES
|
Shares
Acquired on Exercise(#)
|
Number of
Securities
Underlying
Unexercised
Options at Fiscal
Year-End(#)(1)
|
Value of
Unexercised
In- the-Money
Options at Fiscal
Year-End($)(2)
| ||||||
|
Name
|
Value
Realized ($)
|
Exercisable/
Unexercisable
|
Exercisable/
Unexercisable
| |||||
|
Bernard
Seltzer |
-0- |
-0- |
0/0 |
0/0 | ||||
|
David S.
Seltzer |
25,000 |
306,000 |
275,000/100,000 |
1,775,000/489,000 | ||||
|
Elan Bar-Giora |
30,000 |
405,000 |
52,500/20,000 |
333,000/106,000 | ||||
|
Arthur S.
Goldberg |
20,000 |
226,000 |
43,000/15,000 |
264,000/80,000 |
|
(1) |
|
Adjusted to reflect
a 3-for-2 stock split declared on November 1, 1993.
|
|
(2) |
|
Amounts reflect the
market value of the underlying shares of Common Stock on April 30, 2002
less the exercise price. |
Employment Contracts
and Termination of Employment
Bernard Seltzer and David S. Seltzer serve as Chairman of the Board and
as President and Chief Executive Officer, Chief Operating Officer, Secretary and
Treasurer, respectively, of the Company. Mr. Bernard Seltzer’s employment
agreement, as amended, effective as of May 1, 2001 expires on April 30, 2004.
Bernard Seltzer resigned as President and Chief Executive Officer effective as
of May 1, 1998. David Seltzer was elected to serve as President and Chief
Executive Officer effective May 1, 1998. Such employment agreements provide that
the annual base salary for each of Bernard Seltzer and David Seltzer would be
$241,500 and $347,300, respectively, for the fiscal year commencing May 1, 2001
through April 30, 2002. The increase in annual base salary for each fiscal year
thereafter for David S. Seltzer is determined by multiplying his annual base
salary for the prior fiscal year by the greater of 5% or the increase in the
Consumer Price Index as of May 1 of each such year over the index as of May 1 of
the prior year. The Board of Directors in its discretion will determine the
annual bonus, if any, to be received by David S. Seltzer. Mr. Bernard Seltzer
may receive a bonus during each year of employment equal to 1% of the increase
in net sales of the Company. Mr. David Seltzer receives a guaranteed bonus
during each year of employment in the amount equal to 3% of the Company’s
pre-tax net income for such year in the event the Company’s pre-tax net income
exceeds $2 million. The employment agreements also contain standard
24
confidentiality
provisions and a non-compete provision for a term of one year after the
termination of their employment.
Under the employment agreements for each of Bernard Seltzer and David S.
Seltzer, the Company will pay to each person’s estate upon his death, his base
salary for a period of twelve (12) months after the end of the month in which
death occurred. In the event of total disability, each will continue to receive
his base salary for the remaining term of his employment agreement. In addition
to base salary, Bernard Seltzer and David S. Seltzer each will be paid an amount
equal to a percentage of the bonus, if any, based on the portion of such year in
which death, total disability or termination of employment occurred. If
termination is for cause, total disability or because he wrongfully leaves his
employment, then, upon such occurrence, the employment agreement shall be deemed
terminated and the Company shall be released from all obligations.
Arthur S. Goldberg serves as Vice President-Finance and Chief Financial
Officer of the Company pursuant to a two year employment agreement ending on
July 31, 2002. Mr. Goldberg’s annual base salary is approximately $140,000 for
such period. The Board of Directors in its discretion will determine the annual
bonus, if any, to be received by Mr. Goldberg. Such employment agreement
contains standard confidentiality provisions.
Director Compensation
For their service on the Board, the Company pays each director a fee of
$500 per meeting. Each member of the Board is reimbursed for expenses incurred
in connection with each Board or Committee meeting attended.
REPORT OF
THE HI-TECH PHARMACAL CO., INC.
BOARD OF
DIRECTORS COMPENSATION COMMITTEE
The Compensation Committee (the “Committee”) of the Board of Directors of
the Company determines the Company’s executive compensation policies. The
Committee is comprised of three recently appointed non-employee Directors. After
evaluating the performance of the Company and its executive officers, the
Committee recommends compensation programs and salary levels to the entire Board
of Directors for approval. Set forth below is the first report submitted by the
Committee addressing the Company’s compensation policies for the fiscal year
ended April 30, 2002 as they affected the executive officers of the Company.
Employment Agreements for the Company’s Chief Executive Officer and President
and Chairman of the Board, effective on May 1, 1998 and expiring on April 30,
2004, were approved prior to the appointment of the Compensation Committee. The
Compensation Committee has reviewed the compensation of these individuals and
will make recommendations at the time of renewal of the employment agreements to
the Board of Directors of the Company with respect to their compensation.
25
Compensation
Philosophy
The goal of the Company is to be a significant provider of quality
services in the markets it serves. To support this and other strategic
objectives as approved by the Board of Directors and to provide adequate returns
to stockholders, the Company must compete for, attract, develop, motivate and
retain top quality executive management.
In designing and administering the executive compensation program, the
Committee strives to balance short and long-term incentive objectives and use
prudent judgment in establishing performance criteria, evaluating performance
and determining actual incentive awards. The Committee believes that stock
ownership by executive officers is beneficial in aligning the common interests
of management and stockholders to enhance stockholder value.
Compensation of Chief
Executive Officer
In addition to the factors mentioned above, the Committee’s general
approach in setting Mr. David Seltzer’s annual compensation is to seek to be
competitive with other companies in the Company’s industry and to reward Mr.
David Seltzer’s strategic management abilities in directing the Company’s
expansion efforts and its development exploitation of new markets and new
business opportunities.
Compensation Committee
Martin M. Goldwyn
Yashar Hirshaut
Robert M. Holster
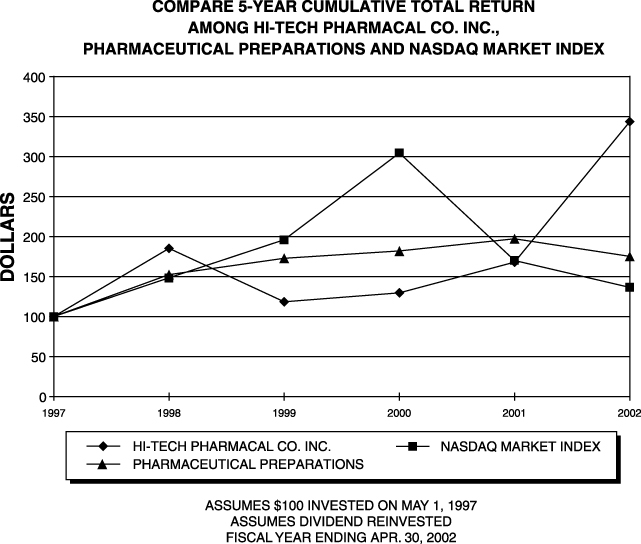
26
Stock Option Plans
The Amended and
Restated Stock Option Plan (the “Plan”)
The Company’s Amended and Restated Stock Option Plan provides for a total
of 1,175,000 shares of Common Stock authorized to be granted under such Plan.
During Fiscal 2002, the Company granted options to purchase 17,645 shares of
Common Stock at $8.64 and $9.50 per share. During Fiscal 2002, 21,550 options
were cancelled or expired, and 78,175 shares are available for future grant
under such Plan. The Company’s Plan provides for the grant of options to its key
employees and directors in order to give such employees a greater personal
interest in the success of the Company and an added incentive to continue and
advance in their employment. The Company’s Plan provides for a fifteen year
expiration period for non-statutory options and ten years for incentive stock
options granted thereunder and allows for the exercise of options by delivery by
the optionee of previously owned Common Stock of the Company having a fair
market value equal to the option price, or by a combination of cash and Common
Stock.
As of July 28, 2002, the Company has granted options to purchase 400,000
shares to David S. Seltzer, 162,500 shares to Elan Bar-Giora, 144,500 shares to
Reuben Seltzer and 76,000 shares to Arthur S. Goldberg at an average exercise
price of $5.52, $5.09, $5.51 and $5.28, per share, respectively.
The Plan is administered by the Stock Option Committee of the Board of
Directors. The Committee has broad discretion in determining the recipients of
options and numerous other terms and conditions of the options.
The exercise price for shares purchased upon the exercise of
non-statutory options granted under the Plan is determined by the Stock Option
Committee as of the date of the grant.
The exercise price of an incentive stock option must be at least equal to
the fair market value of the Common Stock on the date such option is granted
(110% of the fair market value for shareholders who, at the time the option is
granted, own more than 10% of the total combined classes of stock of the Company
or any subsidiary). No employees may be granted incentive stock options in any
year for shares having a fair market value, determined as of the date of grant,
in excess of $100,000.
No incentive option may have a term of more than ten years (in the case
of incentive stock options, five years for shareholders holding 10% or more of
the Common Stock of the Company). Options generally may be exercised only if the
option holder remains continuously associated with the Company or a subsidiary
from the date of grant to the date of exercise. However, options may be
exercised upon termination of employment or upon the death or disability of any
employee within certain specified periods.
27
Directors Plan
The Company’s 1994 Directors Stock Option Plan (“Directors Plan”)
provides for a total of 100,000 shares of Common Stock authorized to be granted
under the Directors Plan. Through July 30, 2002, the Company has granted
non-statutory options to purchase 27,000 shares to one director, 10,000 shares
to one director, and 30,500 shares to one director at an average exercise price
of $6.07 per share.
The Directors Plan provides for the automatic annual grant of options to
non-employee directors and is administered by the Board of Directors. Each
non-employee director will be automatically granted 5,000 shares of Common Stock
on the date of each annual meeting of the Company’s shareholders. A non-employee
director who chairs the audit or other committees of the Board of Directors will
be automatically granted annually an option to purchase an additional 500 shares
of Common Stock.
To remain eligible, a non-employee director must continue to be a member
of the Board of Directors. Each option granted is exercisable in increments of
25% per year commencing on the first anniversary date of the date of grant. The
exercise price for all options may not be less than the fair market value of the
Common Stock on the date of grant. Options under the Directors Plan have a term
of 10 years and may be exercised for limited periods after a person ceases to
serve as a director.
Item
12. Security Ownership of Certain Beneficial
Owners and Management.
The following table identifies each person known to the Company to be the
beneficial owner of more than five percent of the Company’s Common Stock, each
director of the Company, and all directors and officers of the Company as a
group, and sets forth the number of shares of the outstanding Common Stock
beneficially owned by each such person and such group and the percentage of the
shares of the outstanding Common Stock owned by each such person and such group.
Except as noted below, the named person has sole voting power and sole
investment power over the securities.
28
|
Name and Address
of Beneficial Owner
|
Amount and Nature of Beneficial
Ownership(1)
|
Percent of Common Stock
|
||||
|
Bernard Seltzer
c/o Hi-Tech Pharmacal Co., Inc.
369 Bayview Avenue
Amityville, New York 11701 |
357,318 |
(2) |
7.5 |
% | ||
|
David Seltzer
c/o Hi-Tech Pharmacal Co., Inc.
369 Bayview Avenue
Amityville, New York 11701 |
988,052 |
(3) |
19.6 |
% | ||
|
Reuben Seltzer
c/o Hi-Tech Pharmacal Co., Inc.
369 Bayview Avenue
Amityville, New York 11701 |
613,399 |
(4) |
12.6 |
% | ||
|
Arthur S.
Goldberg
c/o Hi-Tech Pharmacal Co., Inc.
369 Bayview Avenue
Amityville, New York 11701 |
44,875 |
(5) |
* |
| ||
|
Elan Bar-Giora
c/o Hi-Tech Pharmacal Co., Inc.
369 Bayview Avenue
Amityville, New York 11701 |
85,000 |
(6) |
1.8 |
% | ||
|
Martin M. Goldwyn
c/o Tashlik, Kreutzer, Goldwyn & Crandell P.C.
40 Cuttermill Road
Great Neck, New York 11021 |
22,250 |
(7) |
* |
| ||
|
Yashar Hirshaut,
M.D.
c/o Hi-Tech Pharmacal Co., Inc.
369 Bayview Avenue
Amityville, New York 11701 |
21,000 |
(8) |
* |
| ||
|
Robert M. Holster
c/o Hi-Tech Pharmacal Co., Inc.
369 Bayview Avenue
Amityville, New York 11701 |
2,000 |
|
* |
| ||
|
All Directors and Executive
Officers as a group (8 persons) |
2,131,894 |
(9) |
40.3 |
% |
|
* |
|
Amount represents
less than one percent of Common Stock including shares issuable to such
beneficial owner under options which are presently exercisable or will
become exercisable within 60 days. |
29
|
(1) |
|
Unless otherwise
indicated, each person has sole voting and investment power with respect
to the shares shown as beneficially owned by such person.
|
|
(2) |
|
Amount does not
include 60,000 shares of Common Stock owned by Mr. Seltzer’s wife, as to
which Bernard Seltzer disclaims beneficial ownership.
|
|
(3) |
|
Amount includes
options to purchase 287,500 shares of Common Stock exercisable within 60
days of July 30, 2002 and 196,401 shares of Common Stock owned by Mr.
Seltzer’s wife and children. |
|
(4) |
|
Amount includes
options to purchase 111,000 shares of Common Stock exercisable within 60
days of July 30, 2002 and 188,378 shares of Common Stock owned by Mr.
Seltzer’s wife and children. |
|
(5) |
|
Amount includes
options to purchase 44,875 shares of Common Stock exercisable within 60
days of July 30, 2002. |
|
(6) |
|
Amount represents
options to purchase 55,000 shares of Common Stock exercisable within 60
days of July 30, 2002. |
|
(7) |
|
Amount represents
options to purchase 22,250 shares of Common Stock exercisable within 60
days of July 30, 2002. |
|
(8) |
|
Amount includes
options to purchase 21,000 shares of Common Stock exercisable within 60
days of July 30, 2002. |
|
(9) |
|
Amount includes
options to purchase 541,625 shares of Common Stock exercisable within 60
days of July 30, 2002. |
Item
13. Certain Relationships and Related
Transactions.
For the fiscal year ended April 30, 2002, Mr. Reuben Seltzer was engaged
by the Company to provide new business development and legal services. For such
services, Mr. Reuben Seltzer received $125,000 and 25,000 stock options of the
Company at an exercise price of $9.50. Mr. Reuben Seltzer is a director of the
Company and the son of Mr. Bernard Seltzer, the Company’s Chairman of the Board.
The Company and Reuben Seltzer each has a 21.25% interest in Marco
Hi-Tech JV Ltd., a New York corporation (“Marco Hi-Tech”), which markets raw
materials for nutraceutical products and has licensed the patent rights to
Huperzine and analogues from the Mayo Clinic. Marco Hi-Tech manufactures and
distributes Huperzine as a dietary supplement under the Dietary Supplement
Health and Education Act of 1994 and is developing analogues and derivatives to
Huperzine. It is currently developing other products for the nutraceutical
market.
The Company believes that material affiliated transactions between the
Company and its directors, officers, principal stockholders or any affiliates
thereof have been, and will be in the future, on terms no less favorable than
could be obtained from unaffiliated third parties.
30
Item
14. Exhibits and Financial Statement Schedules
and Reports on Form 8-K.
(a) Exhibit
|
Exhibit
Number
|
Description of Document
|
Page Number
Footnotes
|
|||
|
3.1 |
Restated Certificate of
Incorporation and By-Laws |
(1 |
) | ||
|
4.3 |
Copy of Hi-Tech Pharmacal Co.,
Inc. Stock Option Plan |
(2 |
) | ||
|
4.4 |
Copy of Hi-Tech Pharmacal Co.,
Inc. Stock Option Agreement |
(3 |
) | ||
|
4.5 |
Copy of 1994 Directors Stock
Option Plan |
(4 |
) | ||
|
10.1 |
Amended and Restated Executive
Employment Agreement with Bernard Seltzer |
(5 |
) | ||
|
10.2 |
Amended and Restated
Employment Agreement with David S. Seltzer |
(6 |
) | ||
|
10.3 |
Amendment No. 1 to Amended and
Restated Executive Employment Agreement of David Seltzer |
(7 |
) | ||
|
10.4 |
Amended and Restated
Employment Agreement with Arthur S. Goldberg |
(8 |
) | ||
|
10.5 |
Agreement, dated June 2, 1993,
by and between Bernard Seltzer and the Company |
(9 |
) | ||
|
10.6 |
Agreement, dated June 2, 1993,
by and between David S. Seltzer and the Company |
(10 |
) | ||
|
10.7 |
Revolving Credit Agreement
with Fleet Bank, N.A., dated as of February 2, 2000 in the amount of
$6,000,000 |
(11 |
) | ||
|
10.8 |
$449,973 Term Loan Facility
with Fleet Bank, N.A., dated as of February 2, 2000 |
(12 |
) | ||
|
10.9 |
Mortgage between National
Westminster Bank USA and the Company dated September 1,
1992 |
(13 |
) | ||
|
10.10 |
Mortgage Note and Supplemental
Mortgage and Mortgage Spreader Consolidating Modification and
Extension |
(14 |
) | ||
|
10.11 |
Agreement between the Company
and National Westminster Bank dated July 29, 1993 |
(15 |
) | ||
|
10.12 |
Lease Agreement by and between
Hi-Tech Pharmacal Co., Inc. and Chigi Realty Corp. dated July 18,
1996 |
(16 |
) | ||
|
*23 |
Consent of Richard A. Eisner
& Company LLP |
|
(1) |
|
Filed as Exhibit
3.0 to Hi-Tech Pharmacal Co., Inc. Quarterly Report on Form 10-Q for the
quarterly period ended October 31, 1994 and incorporated herein by
reference. |
|
(2) |
|
Filed as Exhibit
10.1 to Hi-Tech Pharmacal Co., Inc. Registration Statement on Form S-1
(No. 33-47860) and incorporated herein by reference.
|
|
(3) |
|
Filed as Exhibit
10.2 to Hi-Tech Pharmacal Co., Inc. Registration Statement on Form S-1
(No. 33-47860) and incorporated herein by reference.
|
|
(4) |
|
Filed as Exhibit
10.1 to Hi-Tech Pharmacal Co., Inc. Quarterly Report on Form 10-Q for the
quarterly period ended October 31, 1994 and incorporated herein by
reference. |
|
(5) |
|
Filed as Exhibit
10.2 to Hi-Tech Pharmacal Co., Inc. Annual Report on Form 10-KSB for
fiscal year ended April 30, 2001 and incorporated herein by reference.
|
31
|
(6) |
|
Filed as Exhibit
10.2 to Hi-Tech Pharmacal Co., Inc. Annual Report on Form 10-KSB for
fiscal year ended April 30, 2000 and incorporated herein by reference.
|
|
(7) |
|
Filed as Exhibit
10.3 to Hi-Tech Pharmacal Co., Inc. Annual Report on Form 10-KSB for
fiscal year ended April 30, 2001 and incorporated herein by reference.
|
|
(8) |
|
Filed as Exhibit
10.4 to Hi-Tech Pharmacal Co., Inc. Annual Report on Form 10-KSB for
fiscal year ended April 30, 2001 and incorporated herein by reference.
|
|
(9) |
|
Filed as Exhibit
10.4 to Hi-Tech Pharmacal Co., Inc. Annual Report on Form 10-KSB for
fiscal year ended April 30, 1993 and incorporated herein by reference.
|
|
(10) |
|
Filed as Exhibit
10.5 to Hi-Tech Pharmacal Co., Inc. Annual Report on Form 10-KSB for
fiscal year ended April 30, 1993 and incorporated herein by reference.
|
|
(11) |
|
Filed as Exhibit
10.6 to Hi-Tech Pharmacal Co., Inc. Annual Report on Form 10-KSB for
fiscal year ended April 30, 2000 and incorporated herein by reference.
|
|
(12) |
|
Filed as Exhibit
10.7 to Hi-Tech Pharmacal Co., Inc. Annual Report on Form 10-KSB for
fiscal year ended April 30, 2000 and incorporated herein by reference.
|
|
(13) |
|
Filed as Exhibit to
Hi-Tech Pharmacal Co., Inc. Quarterly Report on Form 10-QSB for the
quarterly period ended January 31, 1993 and incorporated herein by
reference. |
|
(14) |
|
Filed as Exhibit to
Hi-Tech Pharmacal Co., Inc. Quarterly Report on Form 10-Q for the
quarterly period ended July 31, 1992 and incorporated herein by reference.
|
|
(15) |
|
Filed as Exhibit to
Hi-Tech Pharmacal Co., Inc. Quarterly Report on Form 10-QSB for the
quarterly period ended July 31, 1993 and incorporated herein by reference.
|
|
(b) |
|
No reports on Form
8-K have been filed during the last quarter of the period covered by this
report. |
32
SIGNATURES
Pursuant to the requirements of Section 13 or 15(d) of the Securities
Exchange Act of 1934, the Registrant caused this report to be signed on its
behalf by the undersigned, thereunto duly authorized.
|
HI-TECH PHARMACAL
CO., INC. | ||
|
By: |
/s/ DAVID
SELTZER
| |
|
David Seltzer,
Chief Executive Officer,
President, Secretary &
Treasurer | ||
|
By: |
/s/ ARTHUR S.
GOLDBERG
| |
|
Arthur S. Goldberg
Chief Financial
Officer |
Dated: August 7, 2002
Pursuant to the requirements of the Securities Exchange Act of 1934,
this Report has been signed below by the following persons on behalf of the
Registrant and in the capacities and on the dates indicated.
|
Signature
|
Title
|
Date
| ||
|
/s/ BERNARD
SELTZER
Bernard Seltzer |
Chairman of the
Board |
August
7, 2002 | ||
|
/s/ DAVID S.
SELTZER
David S. Seltzer |
Director, Chief Executive
Officer, President, Treasurer, Secretary |
August
7, 2002 | ||
|
/s/ REUBEN
SELTZER
Reuben Seltzer |
Director |
August
7, 2002 | ||
|
/s/ MARTIN M.
GOLDWYN
Martin M. Goldwyn |
Director |
August
7, 2002 | ||
|
/s/ YASHAR
HIRSHAUT,
M.D.
Yashar Hirshaut, M.D. |
Director |
August
7, 2002 | ||
|
/s/ ROBERT M.
HOLSTER
Robert M. Holster |
Director |
August
7, 2002 |