Financial Highlights
Please review the Important Notes below for information regarding adjustments to certain figures shown above and on the Business Highlights page, as well as for source information.
Opinions expressed throughout this annual report are those of BlackRock, Inc. as of March 2012 and are subject to change.
On December 1, 2009, BlackRock acquired from Barclays Bank PLC all of the outstanding equity interests of subsidiaries of Barclays conducting the business of Barclays Global Investors ("BGI") (the "BGI Transaction").
Diluted earnings per share, operating income, operating margin, operating cash flow and net income are presented on an "as adjusted" basis. See pages 28-30 of the PDF for Explanation of Use of Non-GAAP Financial Measures.
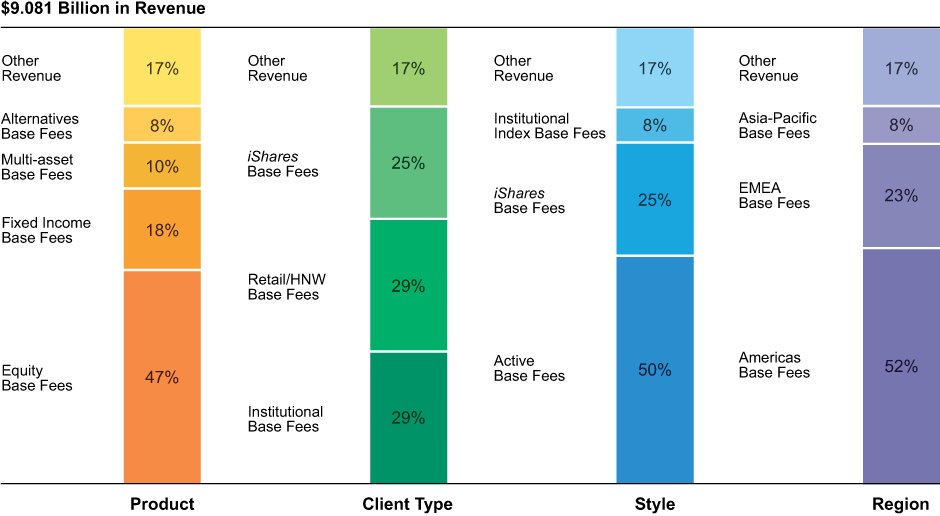
On the Financial Highlights page Other Revenue includes BlackRock Solutions and advisory, Cash management base fees, Investment advisory performance fees, Distribution fees and Other revenue.
Source: SNL, as of December 31, 2011; Market-cap weighted peer average includes: BEN, IVZ, TROW, LM, AMG, FII, EV, WDR, JNS, CLMS, CNS, GBL and PZN.
Past performance is not indicative of future results. The performance information shown is based on preliminarily available data. The performance information for actively managed accounts reflects U.S. open-end and closed-end mutual funds and similar EMEA-based products with respect to peer median comparisons, and actively managed institutional and high net worth separate accounts and funds located globally with respect to benchmark comparisons, as determined using objectively based internal parameters, using the most current verified information available as of December 31, 2011.
Accounts terminated prior to December 31, 2011 are not included. In addition, accounts that have not been verified as of January 30, 2012 have not been included. If such terminated and other accounts had been included, the performance information may have differed substantially from that shown. The performance information does not include funds or accounts that are not measured against a benchmark, any benchmark-based alternatives product, private equity products, CDOs, or liquidation accounts managed by BlackRock's FMA group.
Comparisons are based on gross-of-fee performance for U.S. retail, institutional and high net worth separate accounts and EMEA institutional separate accounts and net-of-fee performance for EMEA based retail products. The performance tracking information for institutional index accounts is based on gross-of-fee performance as of December 31, 2011, and includes all institutional accounts and all iShares funds globally using an index strategy. AUM information is based on AUM for each account or fund in the asset class shown without adjustment for overlapping management of the same account or fund as of December 31, 2011. The information reported may differ slightly from that reported previously due to the increased number of accounts that have been verified since the last performance disclosure. BlackRock does not consider these differences to be material.
The source of performance information and peer medians is BlackRock and is based in part on data from Lipper Inc. for U.S. funds and Morningstar, Inc. for non-U.S. funds. Fund performance reflects the reinvestment of dividends and distributions, but does not reflect sales charges. S&P 500® Index is a widely recognized, unmanaged index of common stock prices of industrial, utility, transportation and financial companies in U.S. markets.
Barclays Capital U.S. Aggregate Index is an unmanaged index considered representative of the U.S. investment-grade, fixed rate bond market.
Unless stated otherwise, 2011 net new business and net inflows figures are before giving effect to a total of $28.3 billion in BGI merger-related outflows. These outflows reflect manager concentration considerations prior to third quarter 2011 and outflows from scientific active equity performance prior to second quarter 2011. BGI merger-related outflows totaled $121.0 billion in 2010 and $2.9 billion in 2009. Total merger-related outflows since the December 2009 BGI transaction represent less than 9% of acquired assets under management.
Source: SimFund, as of December 31, 2011; Data is for U.S. long-term open-end mutual funds and excludes ETFs and funds of funds.
Debt ratings, AUM, ETPs offered, number of countries and employee data as of December 31, 2011. All other data reflect full-year 2011 results unless otherwise noted. BLK Total Return Performance vs. Peers - Source: SNL. Reflects full year 2011 results and assumes reinvestment of all dividends. Market-cap weighted peer average includes: BEN, IVZ, TROW, LM, AMG, FII, EV, WDR, JNS, CL MS, CN S, GBL and PZN.