 |
|
|
|
|
| |
|
|
|
Percent |
| 2004 |
|
2003 |
Change |
|
|
|
|
|
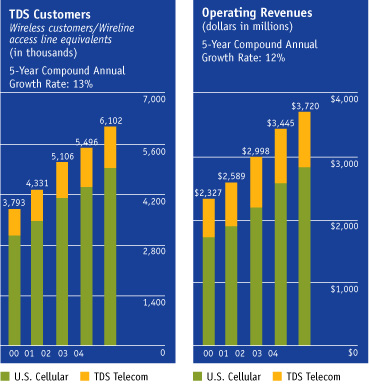
| Operating revenues |
|
|
|
|
| U.S. Cellular |
$2,837,619 |
|
$2,582,783 |
10% |
| TDS Telecom |
882,770 |
|
862,433 |
2% |
|
|
|
|
|
| |
$3,720,389 |
|
$3,445,216 |
8% |
|
|
|
|
|
| |
|
|
|
|
| Operating income |
220,751 |
|
267,888 |
(18)% |
| Depreciation, amortization and accretion |
667,956 |
|
595,732 |
12% |
| Operating income before depreciation, amortization
and accretion* |
888,707 |
|
863,620 |
3% |
| Loss on impairment of intangible assets |
29,440 |
|
49,595 |
n/m |
| Loss on impairment of long-lived assets |
87,910 |
|
4,914 |
n/m |
| (Gain) loss on assets held for sale |
(10,806 |
) |
45,908 |
n/m |
|
|
|
|
|
| Operating cash flow* |
$995,251 |
|
$964,037 |
3% |
|
|
|
|
|
| |
|
|
|
|
| Income from continuing operations |
$42,642 |
|
$60,006 |
(29)% |
| Basic weighted average common shares (000s) |
57,296 |
|
57,721 |
(1)% |
| Basic earnings per share (EPS) |
$0.85 |
|
$0.80 |
6% |
| Diluted earnings per share (EPS) |
0.84 |
|
0.79 |
6% |
| Dividends per share |
0.66 |
|
0.62 |
6% |
| Common stockholders’ equity |
$3,190,748 |
|
$3,078,872 |
4% |
| Return on average equity |
1.4% |
|
2.0% |
n/m |
| Capital expenditures |
$798,252 |
|
$776,967 |
3% |
| Total assets |
$10,993,841 |
|
$10,193,338 |
8% |
| Wireless customers |
4,945,000 |
|
4,409,000 |
12% |
| Telephone access line equivalent |
|
|
|
|
| Incumbent Local Exchange
Carrier (ILEC) |
730,400 |
|
722,200 |
1% |
| Competitive Local Exchange
Carrier (CLEC) |
426,800 |
|
364,800 |
17% |
| Common share record owners |
2,067 |
|
2,183 |
(5)% |
| Total employees |
11,500 |
|
10,900 |
6% |
|
|
|
|
|
|
|
|
|
|
|
|
|
|
|
|
 |
|

