|
Results of Operations |
 |
Field Services
|
|
|
|
Years Ended December 31, |
(Dollars in millions) |
|
1998 |
|
|
1997 |
|
|
1996 |
|
 |
| Operating Revenues |
$ |
2,639 |
|
$ |
3,055 |
|
$ |
2,637 |
|
| Operating Expenses |
|
2,598 |
|
|
2,898 |
|
|
2,487 |
|
|
 |
| Operating Income |
|
41 |
|
|
157 |
|
|
150 |
|
| Other Income, Net of Expenses |
|
35 |
|
|
-- |
|
|
2 |
|
|
 |
| EBIT |
$ |
76 |
|
$ |
157 |
|
$ |
152 |
|
 |
| Volumes |
|
|
|
|
|
|
|
|
|
| Natural Gas Gathered and |
|
|
|
|
|
|
|
|
|
| Processed/Transported, TBtu/da |
|
3.6 |
|
|
3.4 |
|
|
2.9 |
|
| Natural Gas Marketed, TBtu/d |
|
0.4 |
|
|
0.4 |
|
|
0.5 |
|
| NGL Production, MBbl/db |
|
110.2 |
|
|
108.2 |
|
|
78.5 |
|
 |
a Trillion British thermal units per day
b Thousand barrels per day |
| |
|
|
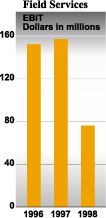
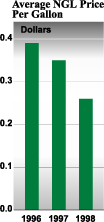
 In 1998, earnings before interest and taxes for Field Services decreased $81 million compared to 1997, primarily due to a decrease in average NGL prices of approximately $0.09 per gallon, or 25.7%. The decrease in earnings before interest and taxes was partially offset by $34 million of gains on sales of assets which are included in other income. In 1998, earnings before interest and taxes for Field Services decreased $81 million compared to 1997, primarily due to a decrease in average NGL prices of approximately $0.09 per gallon, or 25.7%. The decrease in earnings before interest and taxes was partially offset by $34 million of gains on sales of assets which are included in other income.
Earnings before interest and taxes for Field Services increased 3.3% in 1997 over 1996, primarily due to higher volumes as a result of acquisitions in 1996. Natural gas gathered and processed volumes increased 17.2%, and NGL production increased 37.8% in 1997 compared to 1996. Partially offsetting these increases were lower NGL prices of approximately $0.04 per gallon, or 8%, and higher natural gas prices.

|
|