Table of Contents

Table of Contents
Table of Contents
Table of Contents
Table of Contents
Table of Contents

Table of Contents

Table of Contents

Table of Contents

Table of Contents

Table of Contents
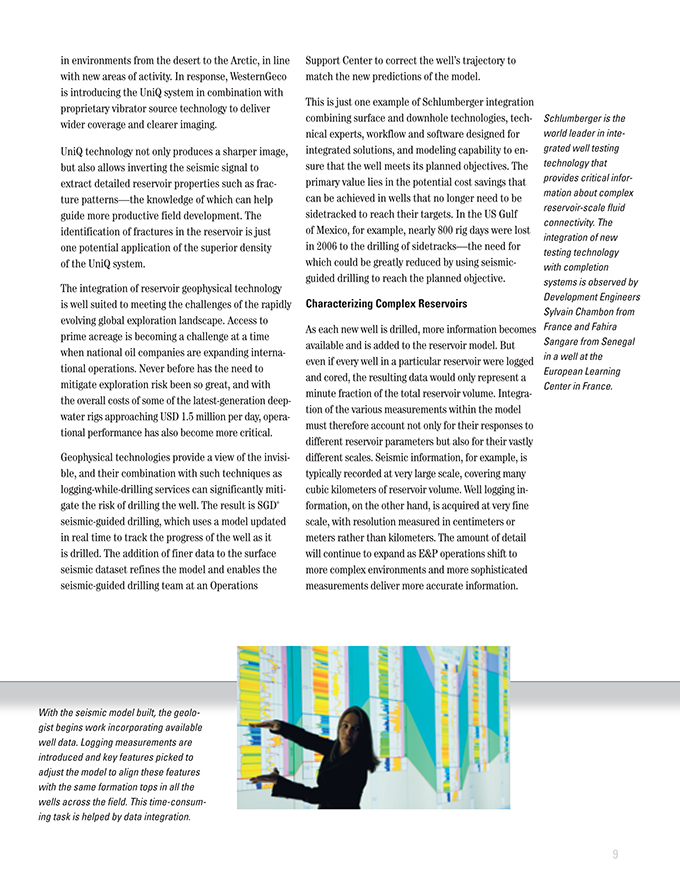
Table of Contents

Table of Contents

Table of Contents
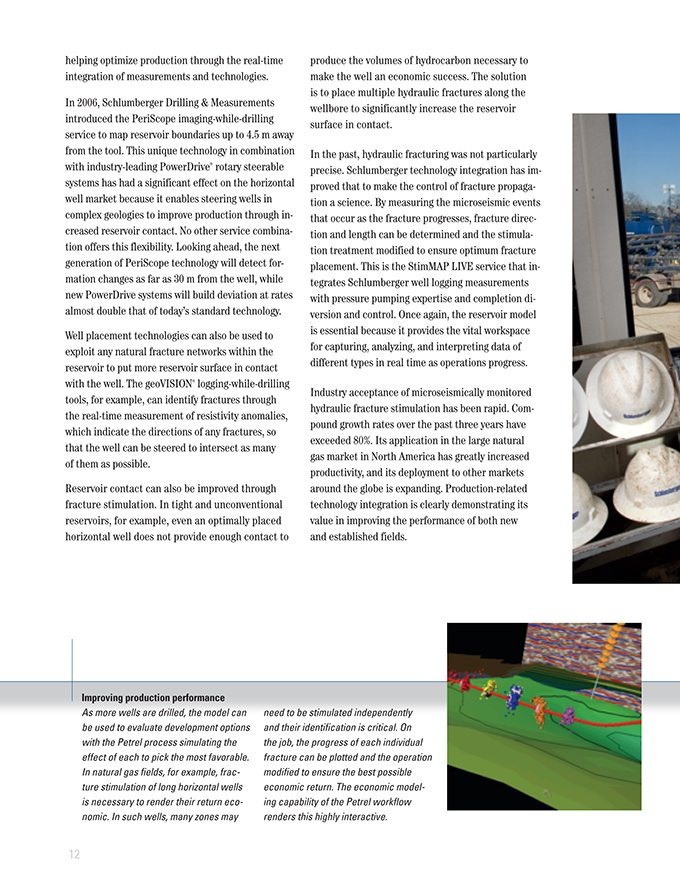
Table of Contents
Table of Contents

Table of Contents
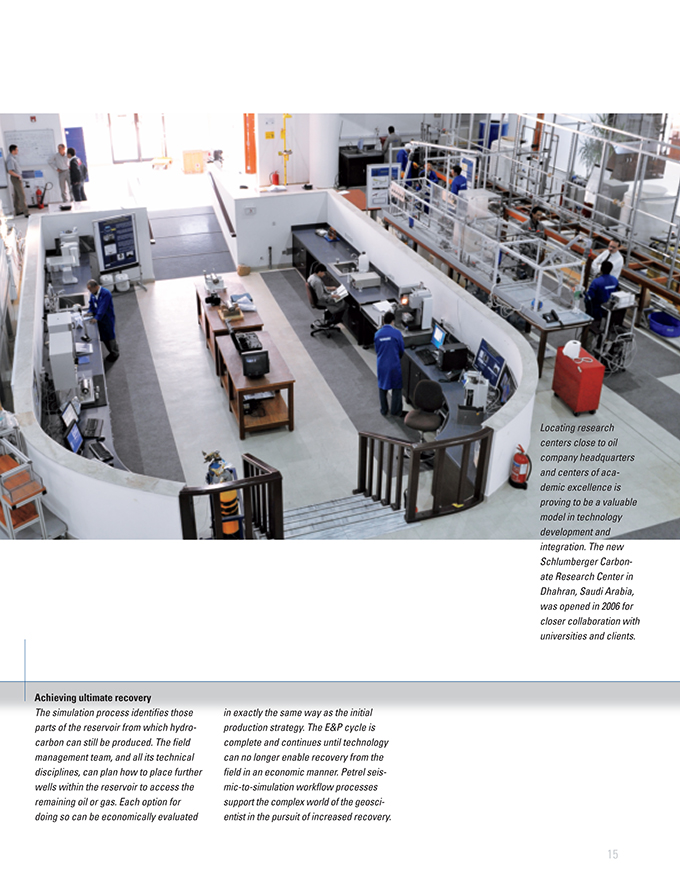
Table of Contents

Table of Contents
UNITED STATES SECURITIES AND EXCHANGE COMMISSION
Washington, D.C. 20549
Form 10-K
(Mark One)
| x | ANNUAL REPORT PURSUANT TO SECTION 13 OR 15(d) OF THE SECURITIES EXCHANGE ACT OF 1934 |
For the fiscal year ended December 31, 2008
OR
| ¨ |
TRANSITION REPORT PURSUANT TO SECTION 13 OR 15(d) OF THE SECURITIES EXCHANGE ACT OF 1934 |
For the transition period from to
Commission File Number 1-4601
Schlumberger N.V. (Schlumberger Limited)
(Exact name of registrant as specified in its charter)
| Netherlands Antilles | 52-0684746 | |
| (State or other jurisdiction of incorporation or organization) |
(IRS Employer Identification No.) | |
| 42, rue Saint-Dominique Paris, France |
75007 | |
| 5599 San Felipe, 17th Floor Houston, Texas, United States of America |
77056 | |
| Parkstraat 83, The Hague, The Netherlands |
2514 JG | |
| (Addresses of principal executive offices) | (Zip Codes) | |
Registrant’s telephone number in the United States, including area code, is:
(713) 513-2000
Securities registered pursuant to Section 12(b) of the Act:
| Title of each class |
Name of each exchange on which registered | |
| Common Stock, par value $0.01 per share | New York Stock Exchange Euronext Paris The London Stock Exchange SIX Swiss Exchange Ltd. |
Securities registered pursuant to Section 12(g) of the Act:
None
Indicate by check mark if the registrant is a well-known seasoned issuer, as defined in Rule 405 of the Securities Act. YES x NO ¨
Indicate by check mark if the registrant is not required to file reports pursuant to Section 13 or Section 15(d) of the Act. YES ¨ NO x
Indicate by check mark whether the registrant (1) has filed all reports required to be filed by Section 13 or 15(d) of the Securities Exchange Act of 1934 during the preceding 12 months (or for such shorter period that the registrant was required to file such reports), and (2) has been subject to such filing requirements for the past 90 days. YES x NO ¨
Indicate by check mark if disclosure of delinquent filers pursuant to Item 405 of Regulation S-K is not contained herein, and will not be contained, to the best of the registrant’s knowledge, in definitive proxy or information statements incorporated by reference in Part III of this Form 10-K or any amendment to this Form 10-K. ¨
Indicate by check mark whether the registrant is a large accelerated filer, an accelerated filer, a non-accelerated filer, or a smaller reporting company. See the definitions of “large accelerated filer”, “accelerated filer” and “smaller reporting company” in Rule 12b-2 of the Exchange Act.
Large accelerated filer x Accelerated filer ¨ Non-accelerated filer ¨ Smaller reporting company ¨
Indicate by check mark whether the registrant is a shell company (as defined in Rule 12b-2 of the Act). YES ¨ NO x
As of June 30, 2008, the aggregate market value of the common stock of the registrant held by non-affiliates of the registrant was approximately $125.2 billion.
As of January 31, 2009, the number of shares of common stock outstanding was 1,195,989,819.
DOCUMENTS INCORPORATED BY REFERENCE
Portions of the following document have been incorporated herein by reference into Part III of this Form 10-K to the extent described therein: Definitive Proxy Statement relating to Schlumberger’s 2009 Annual General Meeting of Stockholders (“Proxy Statement”).
Table of Contents
Table of Contents
Form 10-K
Table of Contents
Part 1, Item 1
All references in this report to “Registrant”, “Company”, “Schlumberger”, “we” or “our” are to Schlumberger Limited and its consolidated subsidiaries.
Founded in 1926, Schlumberger is the world’s leading supplier of technology, integrated project management and information solutions to customers working in the oil and gas industry worldwide. As of December 31, 2008, the Company employed approximately 87,000 people of over 140 nationalities operating in approximately 80 countries. Schlumberger has principal executive offices in Paris, Houston, and The Hague and consists of two business segments – Schlumberger Oilfield Services and WesternGeco. Schlumberger Oilfield Services provides the industry’s widest range of products and services from exploration to production, while WesternGeco is the world’s most technologically advanced surface seismic company.
Schlumberger Oilfield Services is the world’s leading provider of technology, integrated project management and information solutions to the international oil and gas exploration and production industry. Schlumberger Oilfield Services manages its business through GeoMarket* regions, which are grouped into four geographic areas: North America, Latin America, Europe/CIS/Africa and Middle East & Asia. The GeoMarket structure offers customers a single point of contact at the local level for field operations and brings together geographically focused teams to meet local needs and deliver customized solutions.
Schlumberger invented wireline logging as a technique for obtaining downhole data in oil and gas wells. Today, Schlumberger Oilfield Services operates in each of the major oilfield service markets, providing services that cover the entire life cycle of the reservoir. These services, in which Schlumberger holds a number of market leading positions, are organized into a number of technology-based product and service lines, or Technologies, to capitalize on technical synergies and introduce innovative solutions within the GeoMarket regions. The Technologies are also responsible for overseeing operational processes, resource allocation, personnel and quality, health, safety and environmental matters in the GeoMarket.
The Technologies are:
| · | Wireline – provides the information necessary to evaluate the subsurface formation rocks and fluids to plan and monitor well construction, and to monitor and evaluate well production. Wireline offers both open-hole and cased-hole services. |
| · | Drilling & Measurements – supplies directional-drilling, measurement-while-drilling and logging-while-drilling services for all well profiles. |
| · | Well Testing – provides exploration and production pressure and flow-rate measurement services both at the surface and downhole. The Technology also provides tubing-conveyed perforating services. |
| · | Well Services – provides services used during oil and gas well drilling and completion as well as those used to maintain optimal production throughout the life of a well. The services include pressure pumping, well cementing and stimulation operations as well as intervention activities. The Technology also develops coiled-tubing equipment and services. |
| · | Completions – supplies well completion services and equipment that include gas-lift and safety valves as well as a range of intelligent well completions technology and equipment. |
| · | Artificial Lift – provides production optimization services using electrical submersible pumps and associated equipment. |
3
Table of Contents
Part 1, Item 1
| · | Data & Consulting Services – supplies interpretation and integration of all exploration and production data types, as well as expert consulting services for reservoir characterization, production enhancement, field development planning and multi-disciplinary reservoir and production solutions. |
| · | Schlumberger Information Solutions (SIS) – provides consulting, software, information management and IT infrastructure products and services that support core oil and gas industry operational processes. |
Supporting the Technologies are 20 research and engineering centers. Through this organization, Schlumberger is committed to advanced technology programs that enhance oilfield efficiency, lower finding and producing costs, improve productivity, maximize reserve recovery and increase asset value while accomplishing these goals in a safe and environmentally sound manner.
Schlumberger Oilfield Services also offers customers its services through a business model known as Integrated Project Management (IPM). IPM combines the required products and services of the Schlumberger Technologies with drilling rig management expertise and project management skills to provide a complete solution to well construction and production improvement. IPM projects are typically of multi-year duration and include start-up costs and significant third-party components that cover services that Schlumberger does not provide directly. Some projects may be fixed price in nature and may contain penalties for non-performance.
Schlumberger Oilfield Services uses its own personnel to market its products and services. The customer base, business risks and opportunities for growth are essentially uniform across all services. There is a sharing of manufacturing and engineering facilities as well as research centers, and the labor force is interchangeable. Technological innovation, quality of service, and price differentiation are the principal methods of competition, which varies geographically with respect to the different services offered. While there are numerous competitors, both large and small, Schlumberger believes that it is an industry leader in providing wireline logging, well testing, measurement-while-drilling, logging-while-drilling and directional-drilling services, as well as fully computerized logging and geoscience software and computing services. A large proportion of Schlumberger offerings are non-rig related; consequently, revenue does not necessarily correlate to rig count fluctuations.
Schlumberger is a 40% owner in M-I SWACO – a joint venture with Smith International – which offers the drilling and completion fluids used to stabilize subsurface rock strata during the drilling process and minimize formation damage during completion and workover operations.
WesternGeco, the world’s most technologically advanced seismic company, provides comprehensive reservoir imaging, monitoring and development services with the most extensive seismic crews and data processing centers in the industry as well as a leading multiclient seismic library. Services range from 3D and time-lapse (4D) seismic surveys to multi-component surveys for delineating prospects and reservoir management. WesternGeco benefits from full access to the Schlumberger research, development and technology organization and shares similar business risks, opportunities for growth, principal methods of competition and means of marketing as Schlumberger Oilfield Services. Seismic solutions include proprietary Q* technology for enhanced reservoir description, characterization and monitoring throughout the life of the field—from exploration through enhanced recovery. Other WesternGeco solutions include development of controlled-source electromagnetic and magneto-telluric surveys and their integration with seismic data.
Positioned for meeting a full range of customer needs in land, marine and shallow-water transition-zone services, WesternGeco offers a wide scope of technologies and services:
| · | Land Seismic – provides comprehensive resources for seismic data acquisition on land and across shallow-water transition zones. |
4
Table of Contents
Part 1, Item 1
| · | Marine Seismic – provides industry-standard marine seismic acquisition and processing systems as well as a unique industry-leading, fully calibrated single-sensor marine seismic system that delivers the seismic technology needed for new-generation reservoir management. |
| · | Multiclient Services – supplies high-quality seismic data from the multiclient library, including industry-leading Q technology data. |
| · | Reservoir Services – provides people, tools and technology to help customers capture the benefits of a completely integrated approach to locating, defining and monitoring the reservoir. |
| · | Data Processing – offers extensive seismic data processing centers for complex data processing projects. |
| · | Electromagnetics – provides controlled-source electromagnetic and magneto-telluric data acquisition and processing. |
Acquisitions
Information about acquisitions made by Schlumberger appears in Note 4 of the Consolidated Financial Statements.
GENERAL
Research Centers
Research to support the engineering and development efforts of Schlumberger activities is principally conducted at Cambridge, Massachusetts, United States; Cambridge, England; Stavanger, Norway; Moscow, Russia; and Dhahran, Saudi Arabia.
Patents
While Schlumberger seeks and holds numerous patents covering various products and processes, no particular patent or group of patents is considered material to Schlumberger’s business.
Seasonality
Although weather and natural phenomena can temporarily affect delivery of oilfield services, the widespread geographic location of such services precludes the overall business from being characterized as seasonal.
Customers and Backlog of Orders
No single customer exceeded 10% of consolidated revenue. Oilfield Services has no significant backlog due to the nature of its business. The WesternGeco backlog at December 31, 2008 was $1.8 billion (2007: $1.2 billion), of which an estimated $1.3 billion is expected to be realized in 2009.
Government Contracts
No material portion of Schlumberger’s business is subject to renegotiation of profits or termination of contracts by the United States or other governments.
Employees
As of December 31, 2008, Schlumberger had approximately 87,000 employees.
5
Table of Contents
Part 1, Item 1, 1A
Financial Information
Financial information by business segment for the years ended December 31, 2008, 2007 and 2006 is provided in Note 18 of the Consolidated Financial Statements.
Available Information
The Schlumberger Internet website can be found at www.slb.com. Schlumberger makes available free of charge on or through its Internet website at www.slb.com/ir access to its Annual Report on Form 10-K, Quarterly Reports on Form 10-Q, Current Reports on Form 8-K, its proxy statement and Forms 3, 4 and 5 filed on behalf of directors and executive officers, and amendments to each of those reports as soon as reasonably practicable after such material is filed with or furnished to the Securities and Exchange Commission (“SEC”). Alternatively, you may access these reports at the SEC’s Internet website at www.sec.gov.
Schlumberger’s corporate governance materials, including Board Committee Charters, Corporate Governance Guidelines and Code of Ethics, may also be found at www.slb.com/ir. From time to time, corporate governance materials on our website may be updated to comply with rules issued by the SEC and the New York Stock Exchange (“NYSE”) or as desirable to promote the effective governance of Schlumberger. In addition, amendments to the Code of Ethics and any grant of a waiver from a provision of the Code of Ethics requiring disclosure under applicable SEC or NYSE rules will be disclosed on our website.
Any stockholder wishing to receive, without charge, a copy of any of the SEC filings or corporate governance materials should write to the Secretary, Schlumberger Limited, 5599 San Felipe, 17th Floor, Houston, Texas 77056, USA.
Schlumberger has filed the required certifications under Section 302 of the Sarbanes-Oxley Act of 2002 as Exhibits 31.1 and 31.2 to this Report. In 2008, Schlumberger submitted to the NYSE the CEO certification required by Section 303A.12(a) of the NYSE’s Listed Company Manual.
The information on our website or any other website is not incorporated by reference in this Report and should not be considered part of this Report or any other filing Schlumberger makes with the SEC.
The following discussion of risk factors contains “forward-looking statements,” as discussed immediately following Item 7A. of this Report. These risk factors may be important to understanding any statement in this Report or elsewhere. The following information should be read in conjunction with Management’s Discussion and Analysis, and the consolidated financial statements and related notes included in this Report.
We urge you to carefully consider the risks described below, as well as in other reports and materials that we file with the SEC and the other information included or incorporated by reference in this Report. If any of the risks described below or elsewhere in this Report were to materialize, our business, financial condition, results of operations, cash flows or prospects could be materially adversely affected. In such case, the trading price of our common stock could decline and you could lose all or part of your investment. Additional risks and uncertainties not currently known to us or that we currently deem immaterial may also adversely affect our business and operations.
Demand for the majority of our services is substantially dependent on the levels of expenditures by the oil and gas industry. Current global economic conditions have resulted in a significant decline in oil and gas prices. If current global economic conditions and the availability of credit worsen or continue for an extended period, this could reduce our customers’ levels of expenditures and have a significant adverse effect on our revenue and operating results.
6
Table of Contents
Part 1, Item 1A
The current global credit and economic environment has reduced worldwide demand for energy and resulted in significantly lower crude oil and natural gas prices. A substantial or extended decline in oil and natural gas prices can reduce our customers’ activities and their spending on our services and products. Demand for the majority of our services substantially depends on the level of expenditures by the oil and gas industry for the exploration, development and production of crude oil and natural gas reserves. These expenditures are sensitive to oil and natural gas prices and generally dependent on the industry’s view of future oil and gas prices. As the worldwide deterioration in the financial and credit markets has deepened in recent months, demand for oil and gas has reduced dramatically and oil and gas prices have fallen sharply, causing some of our customers to start to reduce or delay their oil and gas exploration and production spending. This has started to reduce the demand for our services and has begun to exert downward pressure on the prices that we charge. If economic conditions continue to deteriorate or do not improve, it could result in further reductions of exploration and production expenditures by our customers, causing further declines in the demand for our services and products. This could result in a significant adverse effect on our operating results. Furthermore, it is difficult to predict how long the economic downturn will continue, to what extent it will worsen, and to what extent this will continue to affect us.
The reduction in cash flows being experienced by our customers resulting from declines in commodity prices, together with the reduced availability of credit and increased costs of borrowing due to the tightening of the credit markets, could have significant adverse effects on the financial condition of some of our customers. This could result in project modifications, delays or cancellations, general business disruptions, and delay in, or nonpayment of, amounts that are owed to us, which could have a significant adverse effect on our results of operations and cash flows. Additionally, our suppliers could be negatively impacted by current global economic conditions. If certain of our suppliers were to experience significant cash flow issues or become insolvent as a result of such conditions, it could result in a reduction or interruption in supplies or a significant increase in the price of supplies, and adversely impact our results of operations and cash flows.
The prices for oil and natural gas are subject to a variety of additional factors, including:
| · | demand for energy, which is affected by worldwide population growth, economic development and general economic and business conditions; |
| · | the ability of the Organization of Petroleum Exporting Countries(“OPEC”) to set and maintain production levels for oil; |
| · | oil and gas production by non-OPEC countries; |
| · | political and economic uncertainty and socio-political unrest; |
| · | the level of worldwide oil exploration and production activity; |
| · | the cost of exploring for, producing and delivering oil and gas; |
| · | technological advances affecting energy consumption; and |
| · | weather conditions. |
A significant portion of our revenue is derived from our non-United States operations, which exposes us to risks inherent in doing business in each of the approximately 80 countries in which we operate.
Our non-United States operations accounted for approximately 78% of our consolidated revenue in 2008, 76% in 2007 and 73% in 2006. Operations in countries other than the United States are subject to various risks, including:
| · | unsettled political and economic conditions in certain areas; |
7
Table of Contents
Part 1, Item 1A
| · | exposure to possible expropriation or other governmental actions; |
| · | social unrest, acts of terrorism, war or other armed conflict; |
| · | confiscatory taxation or other adverse tax policies; |
| · | deprivation of contract rights; |
| · | trade restrictions or embargoes imposed by the United States or other countries; |
| · | restrictions on the repatriation of income or capital; |
| · | exchange controls; |
| · | inflation; and |
| · | currency fluctuations and devaluations. |
In addition, we are subject to risks associated with our operations in countries, including Iran, Syria, Sudan and Cuba, which are subject to trade and economic sanctions or other restrictions imposed by the United States or other governments or organizations.
If any of the risks described above materialize, it could reduce our earnings and our cash available for operations.
We are also subject to risks related to investment in our common stock in connection with certain US state divestment or investment limitation legislation applicable to companies with operations in these countries, and similar actions by some private investors, which could adversely affect the market for our common stock.
Environmental compliance costs and liabilities could reduce our earnings and cash available for operations.
We are subject to increasingly stringent laws and regulations relating to importation and use of hazardous materials, radioactive materials and explosives, environmental protection, including laws and regulations governing air emissions, water discharges and waste management. We incur, and expect to continue to incur, capital and operating costs to comply with environmental laws and regulations. The technical requirements of these laws and regulations are becoming increasingly expensive, complex and stringent. These laws may provide for “strict liability” for damages to natural resources or threats to public health and safety. Strict liability can render a party liable for damages without regard to negligence or fault on the part of the party. Some environmental laws provide for joint and several strict liability for remediation of spills and releases of hazardous substances.
We use and generate hazardous substances and wastes in our operations. In addition, many of our current and former properties are or have been used for industrial purposes. Accordingly, we could become subject to potentially material liabilities relating to the investigation and cleanup of contaminated properties, and to claims alleging personal injury or property damage as the result of exposures to, or releases of, hazardous substances. In addition, stricter enforcement of existing laws and regulations, new laws and regulations, the discovery of previously unknown contamination or the imposition of new or increased requirements could require us to incur costs or become the basis of new or increased liabilities that could reduce our earnings and our cash available for operations. We believe we are currently in substantial compliance with environmental laws and regulations.
We could be subject to substantial liability claims, which would adversely affect our results and financial condition.
Certain equipment used in the delivery of oilfield services, such as directional drilling equipment, perforating systems, subsea completion equipment, radioactive materials and explosives and well completion
8
Table of Contents
Part 1, Item 1A
systems, are used in hostile environments, such as exploration, development and production applications. An accident or a failure of a product could cause personal injury, loss of life, damage to property, equipment or the environment, and suspension of operations. Our insurance may not adequately protect us against liability for some kinds of events, including events involving pollution, or against losses resulting from business interruption. Moreover, in the future we may not be able to maintain insurance at levels of risk coverage or policy limits that we deem adequate. Substantial claims made under our policies could cause our premiums to increase. Any future damages caused by our products that are not covered by insurance, or are in excess of policy limits or are subject to substantial deductibles, could reduce our earnings and our cash available for operations.
If we are unable to maintain technology leadership in the form of services and products, this could affect any competitive advantage we hold.
If we are unable to develop and produce competitive technology or deliver them to our clients in the form of services and products in a timely and cost-competitive manner in the various markets we serve, it could materially reduce our operating revenue and net income.
Limitations on our ability to protect our intellectual property rights, including our trade secrets, could cause a loss in revenue and any competitive advantage we hold.
Some of our products or services, and the processes we use to produce or provide them, have been granted United States patent protection, have patent applications pending or are trade secrets. Our business may be adversely affected if our patents are unenforceable, the claims allowed under our patents are not sufficient to protect our technology, our patent applications are denied, or our trade secrets are not adequately protected. Our competitors may be able to develop technology independently that is similar to ours without infringing on our patents or gaining access to our trade secrets.
We may be subject to litigation if another party claims that we have infringed upon its intellectual property rights.
The tools, techniques, methodologies, programs and components we use to provide our services may infringe upon the intellectual property rights of others. Infringement claims generally result in significant legal and other costs and may distract management from running our core business. Royalty payments under licenses from third parties, if available, would increase our costs. If a license were not available we might not be able to continue providing a particular product or service, which would reduce our operating revenue. Additionally, developing non-infringing technologies would increase our costs.
Failure to obtain and retain skilled technical personnel could impede our operations.
We require highly skilled personnel to operate and provide technical services and support for our business. Competition for the personnel required for our businesses intensifies as activity increases. In periods of high utilization it may become more difficult to find and retain qualified individuals. This could increase our costs or have other adverse effects on our operations.
Severe weather conditions may affect our operations.
Our business may be materially affected by severe weather conditions in areas where we operate. This may entail the evacuation of personnel and stoppage of services. In addition, if particularly severe weather affects platforms or structures, this may result in a suspension of activities until the platforms or structures have been repaired. Any of these events may have a material adverse effect on our operating revenue.
9
Table of Contents
Part 1, Item 1B, 2, 3, 4
Item 1B. Unresolved Staff Comments.
None.
Schlumberger owns or leases manufacturing facilities, administrative offices, service centers, research centers, data processing centers, sales offices and warehouses throughout the world. No significant lease is scheduled to terminate in the near future, and Schlumberger believes comparable space is readily obtainable should any lease expire without renewal. Schlumberger believes its properties are generally well maintained and adequate for their intended use.
Outside the United States the principal owned or leased facilities of Oilfield Services are located in Beijing, China; Clamart and Abbeville, France; Fuchinobe, Japan; Oslo, Norway; Singapore; Abingdon, Cambridge and Stonehouse, United Kingdom; and Novosibirsk, Russia.
Within the United States, the principal owned or leased facilities of Oilfield Services are located in Boston, Massachusetts; Houston, Rosharon, and Sugar Land, Texas; and Lawrence, Kansas.
The principal owned or leased facilities of WesternGeco are located in Bergen and Oslo, Norway; Gatwick, United Kingdom; Houston, Texas, United States; and Mumbai, India.
The information with respect to Item 3 is set forth in Note 17 of the Consolidated Financial Statements.
Item 4. Submission of Matters to a Vote of Security Holders.
No matters were submitted to a vote of Schlumberger’s security holders during the fourth quarter of the fiscal year covered by this Report.
10
Table of Contents
Part 1, Item 4
Executive Officers of Schlumberger
Information with respect to the executive officers of Schlumberger and their ages as of February 11, 2009 is set forth below. The positions for each executive officer have been held for at least five years, except where stated.
| Name | Age | Present Position and Five-Year Business Experience | ||
| Andrew Gould |
62 | Chairman and Chief Executive Officer, since February 2003. | ||
| Simon Ayat |
54 | Executive Vice President and Chief Financial Officer, since March 2007; Vice President Treasurer, February 2005 to March 2007; and Vice President, Controller and Business Processes, December 2002 to February 2005. | ||
| Chakib Sbiti |
54 | Executive Vice President, since February 2003. | ||
| Dalton Boutte |
54 | Executive Vice President, since February 2004; and President WesternGeco, since January 2003. | ||
| Ellen Summer |
62 | Secretary and General Counsel, since March 2002. | ||
| Ashok Belani |
50 | Vice President and Chief Technology Officer, since April 2006; Senior Advisor, Technology, January 2006 to April 2006; Director, President and Chief Executive Officer NPTest, May 2002 to December 2005. | ||
| Mark Danton |
52 | Vice President - Director of Taxes, since January 1999. | ||
| Howard Guild |
37 | Chief Accounting Officer, since July 2005; Director of Financial Reporting, October 2004 to July 2005; and Senior Manager, PricewaterhouseCoopers LLP, July 2001 to October 2004. | ||
| Paal Kibsgaard |
41 | Vice President Engineering, Manufacturing and Sustaining, since November 2007; Vice President Personnel, April 2006 to November 2007; and President, Drilling and Measurements, January 2003 to April 2006. | ||
| Catherine MacGregor |
36 | Vice President Personnel, since November 2007; Director of Personnel, Oilfield Services, January 2007 to November 2007; Operations Manager, Drilling & Measurements, Brunei/Malaysia/Philippines GeoMarket August 2005 to January 2007; Management Development Champion, Oilfield Services, September 2004 to August 2005; and DVD Product Champion, Drilling & Measurements, July 2002 to March 2004. | ||
| Rodney Nelson |
50 | Vice President Communications, since October 2007; VP Innovation and Collaboration, July 2006 to October 2007; VP Strategic Marketing, July 2004 to July 2006; and VP Marketing Oilfield Services, February 2003 to July 2004. | ||
| H. Sola Oyinlola |
53 | Vice President Treasurer, since March 2007; Deputy Treasurer, July 2006 to March 2007; and Oilfield Services GeoMarket General Manager, Nigeria, April 2001 to July 2006. | ||
| Satish Pai |
47 | Vice President, Operations, Oilfield Services, since May 2008, President Europe Africa & Caspian, March 2006 to May 2008; and Vice President Oilfield Technologies, March 2002 to March 2006. | ||
| Malcolm Theobald |
47 | Vice President Investor Relations, since June 2007; and Global Account Director, September 2001 to June 2007. | ||
| Sophie Zurquiyah-Rousset |
42 | Chief Information Officer, since December 2006; Director of Personnel, Oilfield Services, April 2005 to December 2006; and Oilfield Services GeoMarket Manager, Latin America South, February 2003 to April 2005. | ||
11
Table of Contents
Part II, Item 5
| Item 5. | Market for Schlumberger’s Common Stock, Related Stockholder Matters and Issuer Purchases of Equity Securities. |
As of January 31, 2009, there were 1,195,989,819 shares of common stock of Schlumberger outstanding, exclusive of 138,222,345 shares held in treasury, and approximately 19,483 stockholders of record. The principal United States market for Schlumberger’s common stock is the NYSE, where it is traded under the symbol “SLB”.
Schlumberger’s common stock is also traded on the Euronext Paris, Euronext Amsterdam, London and SIX Swiss stock exchanges.
Common Stock, Market Prices and Dividends Declared per Share
Quarterly high and low prices for Schlumberger common stock as reported by the NYSE (composite transactions), together with dividends declared per share in each quarter of 2008 and 2007, were:
| Price Range |
Dividends | ||||||||
| High | Low | ||||||||
| 2008 |
|||||||||
| QUARTERS | |||||||||
| First |
$ | 102.71 | $ | 72.30 | $ | 0.210 | |||
| Second |
110.11 | 88.02 | 0.210 | ||||||
| Third |
111.95 | 73.53 | 0.210 | ||||||
| Fourth |
78.00 | 37.24 | 0.210 | ||||||
| 2007 |
|||||||||
| QUARTERS | |||||||||
| First |
$ | 71.17 | $ | 55.68 | $ | 0.175 | |||
| Second |
89.20 | 68.25 | 0.175 | ||||||
| Third |
108.75 | 81.26 | 0.175 | ||||||
| Fourth |
114.84 | 87.42 | 0.175 | ||||||
There are no legal restrictions on the payment of dividends or ownership or voting of such shares, except as to shares held as treasury stock. Under current legislation, stockholders are not subject to any Netherlands Antilles withholding or other Netherlands Antilles taxes attributable to the ownership of such shares.
The following graph compares the yearly percentage change in the cumulative total stockholder return on Schlumberger common stock, assuming reinvestment of dividends on the last day of the month of payment into common stock of Schlumberger, with the cumulative total return on the Standard & Poor’s 500 Stock Index and the cumulative total return on Value Line’s Oilfield Services Industry Group over the preceding five-year period ending on December 31, 2008. The stockholder return set forth below is not necessarily indicative of future performance. The following graph and related information shall not be deemed “soliciting material” or to be “filed” with the SEC, nor shall such information be incorporated by reference into any future filing under the Securities Act of 1933 or the Securities Exchange Act of 1934, except to the extent that Schlumberger specifically incorporates it by reference into such filing.
12
Table of Contents
Part II, Item 5
COMPARISON OF FIVE-YEAR CUMULATIVE TOTAL RETURN
AMONG SCHLUMBERGER LIMITED, S&P 500 INDEX
AND VALUE LINE’S OILFIELD SERVICES INDUSTRY INDEX
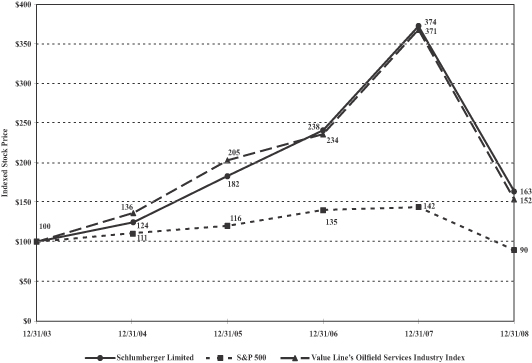
Assumes $100 invested on December 31, 2003 in Schlumberger Limited stock, in the S&P 500 Index, and in Value Line’s Oilfield Services Industry Index. Reflects reinvestment of dividends on the last day of the month of payment and annual reweighting of the Industry Peer Index portfolio.
13
Table of Contents
Part II, Item 5
Share Repurchases
On April 17, 2008, the Board of Directors of Schlumberger approved an $8 billion share repurchase program for shares of Schlumberger common stock to be acquired in the open market before December 31, 2011.
The following table sets forth information on Schlumberger’s common stock repurchase program activity for the three months ended December 31, 2008.
| (Stated in thousands, except per share amounts) | ||||||||||
| Total number purchased |
Average price share |
Total number of publicly |
Maximum value of shares that may yet be purchased under the program | |||||||
| October 1 through October 31, 2008 |
1,450.0 | $ | 64.79 | 1,450.0 | $ | 7,125,799 | ||||
| November 1 through November 30, 2008 |
950.0 | $ | 48.96 | 950.0 | $ | 7,079,286 | ||||
| December 1 through December 31, 2008 |
300.0 | $ | 45.24 | 300.0 | $ | 7,065,715 | ||||
| 2,700.0 | $ | 57.05 | 2,700.0 | |||||||
In connection with the exercise of stock options under Schlumberger’s incentive compensation plans, Schlumberger routinely receives shares of its common stock from optionholders in consideration of the exercise price of the stock options. Schlumberger does not view these transactions as implicating the disclosure required under this Item. The number of shares of Schlumberger common stock received from optionholders is immaterial.
Unregistered Sales of Equity Securities
During the quarter ended December 31, 2008, Schlumberger issued 286,400 shares of its common stock upon conversion by holders of $11 million aggregate principal amount of its 2.125% Series B Convertible Debentures due June 1, 2023. Such shares were issued in transactions exempt from registration under Section 3(a)(9) of the Securities Act of 1933, as amended.
14
Table of Contents
Part II, Item 6
Item 6. Selected Financial Data.
The following selected consolidated financial data should be read in conjunction with “Item 7. Management’s Discussion and Analysis of Financial Condition and Results of Operations” and “Item 8. Financial Statements and Supplementary Data,” both contained in this Report:
| (Stated in millions except per share and employee data) | ||||||||||||||||||||
| Year Ended December 31, | 2008 | 2007 | 2006 | 2005 | 2004 | |||||||||||||||
| SUMMARY OF OPERATIONS |
||||||||||||||||||||
| Revenue: |
||||||||||||||||||||
| Oilfield Services |
$ | 24,282 | $ | 20,306 | $ | 16,762 | $ | 12,647 | $ | 10,236 | ||||||||||
| WesternGeco |
2,838 | 2,963 | 2,476 | 1,663 | 1,241 | |||||||||||||||
| Eliminations and other |
43 | 8 | (8 | ) | (1 | ) | 3 | |||||||||||||
| Total revenue |
$ | 27,163 | $ | 23,277 | $ | 19,230 | $ | 14,309 | $ | 11,480 | ||||||||||
| % increase over prior year |
17 | % | 21 | % | 34 | % | 25 | % | 15 | % | ||||||||||
| Pretax Segment income: |
||||||||||||||||||||
| Oilfield Services |
$ | 6,505 | $ | 5,959 | $ | 4,644 | $ | 2,827 | $ | 1,802 | ||||||||||
| WesternGeco |
836 | 1,060 | 812 | 295 | 123 | |||||||||||||||
| Eliminations and other |
(268 | ) | (312 | ) | (346 | ) | (233 | ) | (208 | ) | ||||||||||
| Pretax Segment income |
$ | 7,073 | $ | 6,707 | $ | 5,110 | $ | 2,889 | $ | 1,717 | ||||||||||
| % increase over prior year |
5 | % | 31 | % | 77 | % | 68 | % | 25 | % | ||||||||||
| Interest income1 |
112 | 160 | 113 | 98 | 54 | |||||||||||||||
| Interest expense1 |
217 | 268 | 229 | 187 | 201 | |||||||||||||||
| Charges (credits), net2 |
116 | (25 | ) | 46 | (172 | ) | 243 | |||||||||||||
| Taxes on income2 |
1,430 | 1,448 | 1,190 | 682 | 277 | |||||||||||||||
| Minority interest2 |
(25 | ) | – | (49 | ) | (91 | ) | (36 | ) | |||||||||||
| Income from Continuing Operations3 |
$ | 5,397 | $ | 5,177 | $ | 3,710 | $ | 2,199 | $ | 1,014 | ||||||||||
| Income from Discontinued Operations |
38 | – | – | 8 | 210 | |||||||||||||||
| Net Income |
$ | 5,435 | $ | 5,177 | $ | 3,710 | $ | 2,207 | $ | 1,224 | ||||||||||
| Basic earnings per share |
||||||||||||||||||||
| Income from Continuing Operations |
$ | 4.51 | $ | 4.36 | $ | 3.14 | $ | 1.87 | $ | 0.86 | ||||||||||
| Income from Discontinued operations |
0.03 | – | – | 0.01 | 0.18 | |||||||||||||||
| Net Income per share3 |
$ | 4.54 | $ | 4.36 | $ | 3.14 | $ | 1.87 | $ | 1.04 | ||||||||||
| Diluted earnings per share |
||||||||||||||||||||
| Income from Continuing Operations |
$ | 4.42 | $ | 4.20 | $ | 3.01 | $ | 1.81 | $ | 0.85 | ||||||||||
| Income from Discontinued Operations |
0.03 | – | – | 0.01 | 0.17 | |||||||||||||||
| Net Income per share |
$ | 4.45 | $ | 4.20 | $ | 3.01 | $ | 1.82 | $ | 1.02 | ||||||||||
| Cash dividends declared per share |
$ | 0.840 | $ | 0.700 | $ | 0.500 | $ | 0.420 | $ | 0.375 | ||||||||||
15
Table of Contents
Part II, Item 6
| (Stated in millions except number of employees) | |||||||||||||||
| Year Ended December 31, | 2008 | 2007 | 2006 | 2005 | 2004 | ||||||||||
| SUMMARY OF FINANCIAL DATA |
|||||||||||||||
| Capital expenditures |
$ | 3,723 | $ | 2,931 | $ | 2,457 | $ | 1,593 | $ | 1,216 | |||||
| Depreciation expense |
$ | 1,904 | $ | 1,526 | $ | 1,232 | $ | 1,092 | $ | 1,007 | |||||
| Avg. number of shares outstanding: |
|||||||||||||||
| Basic |
1,196 | 1,188 | 1,182 | 1,179 | 1,178 | ||||||||||
| Assuming dilution |
1,224 | 1,239 | 1,242 | 1,230 | 1,226 | ||||||||||
| AT DECEMBER 31 |
|||||||||||||||
| Net Debt4 |
$ | 1,129 | $ | 1,857 | $ | 2,834 | $ | 532 | $ | 1,459 | |||||
| Working capital |
$ | 4,769 | $ | 3,551 | $ | 2,731 | $ | 3,121 | $ | 2,359 | |||||
| Total assets |
$ | 31,991 | $ | 27,853 | $ | 22,832 | $ | 18,077 | $ | 16,001 | |||||
| Long-term debt |
$ | 3,694 | $ | 3,794 | $ | 4,664 | $ | 3,591 | $ | 3,944 | |||||
| Stockholders’ equity |
$ | 16,862 | $ | 14,876 | $ | 10,420 | $ | 7,592 | $ | 6,117 | |||||
| Number of employees continuing operations |
87,000 | 80,000 | 70,000 | 60,000 | 52,500 | ||||||||||
| 1. | Excludes amounts which are either included in the segments or Charges and Credits. |
| 2. | For details of Charges and Credits and the related income taxes and minority interest, see Note 3 of the Consolidated Financial Statements. |
| 3. | Amounts may not add due to rounding. |
| 4. | “Net Debt” represents gross debt less cash, short-term investments and fixed income investments, held to maturity. Management believes that Net Debt provides useful information regarding the level of Schlumberger’s indebtedness by reflecting cash and investments that could be used to repay debt. |
16
Table of Contents
Part II, Item 7
Item 7. Management’s Discussion and Analysis of Financial Condition and Results of Operations.
The following discussion and analysis contains forward-looking statements including, without limitation, statements relating to our plans, strategies, objectives, expectations, intentions and resources. Such forward-looking statements should be read in conjunction with our disclosures under “Item 1A. Risk Factors” of this Report.
Executive Overview
As 2008 progressed, early optimism of continuing growth in oil and natural gas exploration and production activity was dampened by growing evidence of weakening economic conditions that began to significantly weigh upon the energy markets in early October. While such weakening did not prevent oil prices from ramping up steeply to $147-per-barrel in July, the velocity of the subsequent reversal to under $40-per-barrel by the end of the year was supported by economic reports and forecasts that confirmed the majority of the OECD (Organization for Economic Co-operation and Development) countries to be in recession by the end of the third quarter. Consequently, global oil demand forecasts for 2008 dropped from quarter to quarter and it became apparent that moderating oil demand growth in the non-OECD economies would no longer be sufficient to offset a continuing three-year demand decline within the OECD countries. As a result, 2008 saw the first global oil demand decrease in 25 years. In the fourth quarter OPEC elected to cut production by a total of 3.7 million barrels per day to remove supply and support prices, however, the time taken for these cuts to be felt in the market, and for the resultant increased spare capacity to be reabsorbed by future growth, was large enough for E&P customers to cut investment. This translated to lower demand and weaker prices for oilfield services in an increasing number of areas late in the fourth quarter.
The natural gas markets presented a similar picture. While activity was initially maintained in the first part of the year, the developing recession in the latter part of 2008 led to lower industrial demand in the developed economies although commercial and residential demand was maintained. In North America, supply increased by 6% in 2008 largely as a result of industry deployment of advanced drilling, production and completion technologies leading to higher gas production and consequently greater storage levels in spite of lower Canadian imports and decreased LNG (Liquified Natural Gas) supplies. Consequently, more LNG has become available for other international importers and, as a result, the majority of the developed economies are well supplied for their needs. Within the United States, the world’s largest natural gas market, this translated to reduced gas exploration and production investment with lower demand for oilfield services and consequent pressure on service pricing in a number of areas by the fourth quarter as the market price of natural gas fell. In international markets however, increasing demand for natural gas in the developing economies led to sustained drilling activity with drilling rigs previously deployed on oil exploration and development moving to natural gas activity in some regions.
Within this volatile market, Schlumberger Oilfield Services revenue in 2008 grew by 20% versus 2007, with demand strongest in international markets. Year-on-year growth rates reached 28% in Latin America, 24% in Europe/CIS/Africa, 18% in Middle East & Asia and 11% in North America. All Technologies experienced double-digit growth, most notably in Well Services, Drilling & Measurements and Wireline. These results mask, however, a rapid reversal that occurred late in the year in response to the worsening economic climate, and, after three quarters of overall growth, revenues in the fourth quarter declined sequentially through weakening local currencies and reduced customer spending, in addition to seasonal factors.
A variety of new Schlumberger products and services contributed to growth in 2008. These included further penetration of Scanner Family* advanced wireline logging services and Scope* imaging-while-drilling technologies into new markets as customers sought to increase their understanding of complex reservoirs. Growth through measurement integration also extended into the production domain with offerings such as the StimMAP* LIVE real-time fracture monitoring service that combines the measurement capability of Wireline with the pressure pumping expertise of Well Services to track the progress of fracture stimulation in real time
17
Table of Contents
Part II, Item 7
to be able to control the operation for maximum effect. Other new production-related services included ACTive* coiled-tubing services that combine a downhole sensor package with a fiber-optic communications system to monitor coiled-tubing-enabled operations in real time.
Acquisitions in 2008 also served to increase Schlumberger capabilities or added specific new technologies to the portfolio. In Canada, Schlumberger and First Reserve Corporation acquired Saxon Energy Services Inc., a land drilling contractor with major activity in North and South America. Schlumberger had already enjoyed a long association with Saxon, including operation of joint ventures in Mexico and Colombia for the supply of drilling services that support integrated project management activities. Also in Canada, Schlumberger acquired the business of Extreme Engineering Limited, a leading supplier of unmanned measurement-while-drilling systems to land markets in the United States and Canada. Other technology acquisitions included Integrated Exploration Systems, a Germany-based technology leader in petroleum systems modeling, and Staag Imaging, a Houston-based provider of leading-edge depth imaging technologies for seismic data processing.
The performance of WesternGeco, where full-year 2008 revenue fell by 4% versus 2007, was limited by a combination of lower Multiclient sales, reduced Land activity, and cost inflation that affected Marine operations. Among these factors, Multiclient sales were particularly weak with the sharp decrease reported in the first quarter not being reversed later in the year as a clear indication of customers restricting discretionary spending for seismic data. Contract awards remained strong, however, and WesternGeco reported a record backlog of $1.8 billion at the end of the year, up $700 million from the end of the third quarter.
In spite of this weaker-than-expected performance, WesternGeco made significant progress in the introduction of new technology during the year. These included a new proprietary full-azimuth marine acquisition technique, known as coil shooting, that leverages the signal fidelity and streamer-steering capability of Q* technology to provide resolution in sub-salt applications where wide-azimuth techniques mobilize too many resources. Coil shooting provides the same quality survey but uses only one vessel to do so. In other new technology developments, the UniQ* latest-generation land acquisition system was unveiled. This substantially increases the number of acquisition channels available and in combination with proprietary vibrator source technology delivers a sharper image and wider coverage.
The sharp drop in oil and gas prices in the latter part of 2008 that resulted in lower activity, higher inventories, and the belief that demand will erode further in 2009 as a result of the economic slowdown, has led to rapid and substantial reductions in exploration and production expenditure. At current prices most of the new categories of hydrocarbon resources such as heavy oil, tar sands, coal-to-liquids, or gas-to-liquids are not economic to develop. In addition, it will take time for inflation to be removed from the E&P supply chain to bring finding and development costs more in line with lower oil and gas prices.
Schlumberger therefore expects 2009 activity to weaken across the board, with the most significant declines occurring in North American gas drilling, Russian oil production enhancement, and in mature offshore basins. Exploration offshore will also be somewhat curtailed but commitments already planned are likely to be honored. Seismic expenditures, particularly for multiclient data, are likely to decrease from the levels of 2008. Furthermore, pricing erosion will compound these effects on revenue. In this market we are taking the necessary actions early in 2009 to adjust our operating cost base while preserving our long-term commitments to technology development, key skill sets and service and product quality.
The most important indicator of a future recovery in oilfield services activity will be a stabilization and recovery in the demand for oil. The recent years of increased exploration and production spending, however, have not been sufficient to substantially improve the supply situation. The age of the production base, accelerating decline rates and the smaller size of recently developed fields will mean that any prolonged reduction in investment will lead to a strong rebound in activity in the future.
18
Table of Contents
Part II, Item 7
The following discussion and analysis of results of operations should be read in conjunction with the Consolidated Financial Statements.
| (Stated in millions) | ||||||||||||||||||
| Total Year 2008 |
Total Year 2007(1) |
% Change | Total Year 2007(1) |
Total Year 2006(1) |
% Change | |||||||||||||
| OILFIELD SERVICES |
||||||||||||||||||
| Revenue |
$ | 24,282 | $ | 20,306 | 20 | % | $ | 20,306 | $ | 16,762 | 21 | % | ||||||
| Pretax Operating Income |
$ | 6,505 | $ | 5,959 | 9 | % | $ | 5,959 | $ | 4,644 | 28 | % | ||||||
| WESTERNGECO |
||||||||||||||||||
| Revenue |
$ | 2,838 | $ | 2,963 | (4 | )% | $ | 2,963 | $ | 2,476 | 20 | % | ||||||
| Pretax Operating Income |
$ | 836 | $ | 1,060 | (21 | )% | $ | 1,060 | $ | 812 | 31 | % | ||||||
| Fourth Qtr. 2008 |
Third Qtr. 2008 |
% change | |||||||||||||
| OILFIELD SERVICES |
|||||||||||||||
| Revenue |
$ | 6,256 | $ | 6,356 | (2 | )% | |||||||||
| Pretax Operating Income |
$ | 1,599 | $ | 1,699 | (6 | )% | |||||||||
| WESTERNGECO |
|||||||||||||||
| Revenue |
$ | 599 | $ | 892 | (33 | )% | |||||||||
| Pretax Operating Income |
$ | 88 | $ | 355 | (75 | )% | |||||||||
| 1. | Effective January 1, 2008, a component of the Middle East & Asia Area was reallocated to the Europe/CIS/Africa Area. Prior period data has been reclassified to conform to the current organizational structure. |
Pretax operating income represents the business segments’ income before taxes and minority interest. Pretax operating income excludes corporate expenses, interest income, interest expense, amortization of certain intangibles, interest, stock-based compensation costs and the Charges and Credits described in detail in Note 3 to the Consolidated Financial Statements, as these items are not allocated to the segments.
Oilfield Services
Fourth Quarter 2008 Results
Fourth-quarter revenue of $6.26 billion was 2% lower sequentially but was 15% higher year-on-year. Sequentially, Europe/CIS/Africa revenue declined primarily due to a weakening of the local currencies against the US dollar and from lower activity in Russia as the result of reduced customer spending and seasonal slowdowns. In Latin America, revenue fell due to weaker local currencies and lower activity in the Venezuela/Trinidad & Tobago and Mexico/Central America GeoMarkets. Middle East & Asia declined on lower activity in the Australia/Papua New Guinea/New Zealand and Qatar GeoMarkets. These decreases, however, were partially offset by an increase in North America as the result of strong activity in the US Gulf of Mexico and US land West GeoMarkets. Local currency changes reduced Oilfield Services fourth-quarter revenue by approximately 3%.
Fourth-quarter pretax operating income of $1.60 billion was 6% lower sequentially but 4% higher year-on-year. Sequentially, pretax operating margin decreased from 26.7% to 25.6% primarily as a result of reduced activity levels in the Europe/CIS/Africa, Latin America and Middle East & Asia Areas, partially offset by the improvement in overall activity and a more favorable revenue mix in North America.
North America
Revenue of $1.56 billion increased 4% sequentially and 17% year-on-year. Pretax operating income of $346 million increased 9% sequentially and 2% year-on-year.
19
Table of Contents
Part II, Item 7
Sequentially, the US Gulf of Mexico GeoMarket activity recovered from the slowdown experienced during the hurricane season of the third quarter and realized further growth on a higher ultra deep-water rig count that led to strong demand for Wireline, Well Testing and Well Services technologies. The US land West GeoMarket revenue increased on strong demand for Well Services and Drilling & Measurements services and Artificial Lift products while the Alaska GeoMarket experienced a seasonal increase in activity that resulted in robust demand for Well Services and Drilling & Measurements technologies. SIS experienced growth from strong year-end software and hardware sales. These increases were partially offset by decreased revenue in the US land Central and North GeoMarkets on reducing rig count that accelerated at quarter end. Canada GeoMarket revenue was also lower primarily as the result of the weakening of the Canadian dollar.
Pretax operating margin improved sequentially from 21.1% to 22.3% mainly as a result of stronger activity levels and increased high-margin services in the US Gulf of Mexico, US land West and Alaska GeoMarkets. These increases were partially offset by pricing pressure in the US land Central and North GeoMarkets.
Latin America
Revenue of $1.11 billion was 3% lower sequentially but increased 18% year-on-year. Pretax operating income of $200 million decreased 13% sequentially and 4% year-on-year.
Sequentially, revenue in the Venezuela/Trinidad & Tobago GeoMarket declined as a result of lower demand for Wireline and Well Services technologies and Completions products, while the Mexico/Central America GeoMarket experienced lower activity in Integrated Project Management (IPM) projects. These decreases were partially offset by higher offshore exploration-related activity in the Brazil GeoMarket that led to robust demand for Wireline, Well Testing and Drilling & Measurements services, while activity in the Peru/Colombia/Ecuador GeoMarket increased due to strong demand for Artificial Lift and SIS products. Area revenue was also reduced by approximately 4% due to the weakening of local currencies against the US dollar.
Pretax operating margin declined sequentially from 20.1% to 18.0% from lower activity and a less favorable revenue mix in the Venezuela/Trinidad & Tobago GeoMarket, reduced gain share from IPM projects in the Peru/Colombia/Ecuador GeoMarket, and cost inflation and a less favorable revenue mix in the Mexico/Central America GeoMarket.
Europe/CIS/Africa
Revenue of $2.05 billion decreased 5% sequentially but increased 16% year-on-year. Pretax operating income of $533 million decreased 15% sequentially but was 8% higher year-on-year.
Sequentially, Area revenue was 5% lower due to the weakening of local currencies against the US dollar particularly in the North Sea, Continental Europe and Russia. Additionally, Russia experienced significant reductions in activity from lower customer spending and the seasonal slowdown in Sakhalin. Lower Framo revenue also contributed to the decline. These decreases were partially offset by significantly increased activity in the Libya GeoMarket from strong demand for Artificial Lift products and for Drilling & Measurements, Well Testing and Wireline services, as well as in the Continental Europe GeoMarket from higher demand for Wireline and Drilling & Measurements technologies.
Pretax operating margin decreased sequentially from 29.0% to 26.1% primarily due to lower activity and a less favorable revenue mix in the North Sea and Nigeria & Gulf of Guinea GeoMarkets and Russia. The decrease in Framo revenue also contributed to this result.
Middle East & Asia
Revenue of $1.47 billion was 2% lower sequentially but 9% higher year-on-year. Pretax operating income of $491 million decreased 7% sequentially but increased 4% year-on-year.
Sequentially, Area revenue declined mainly as a result of weather-related effects in the Australia/Papua New Guinea/New Zealand and China/Japan/Korea GeoMarkets, lower activity in Qatar, a less favorable activity
20
Table of Contents
Part II, Item 7
mix in Brunei/Malaysia/Philippines and reduced customer spending in the China/Japan/Korea and Arabian GeoMarkets. These declines primarily affected demand for Wireline, Drilling & Measurements and Well Services technologies, but were partially offset by the positive impact of retroactive price adjustments for a Wireline contract in addition to growth in the Gulf GeoMarket for Artificial Lift products and Well Services and Drilling & Measurements technologies.
Pretax operating margin declined sequentially from 35.5% to 33.5% primarily due to the overall lower level of activity in the Area as well as a less favorable revenue mix in the Arabian and India GeoMarkets.
Total Year 2008 Results
Full-year 2008 revenue of $24.28 billion increased 20% versus 2007 driven by Area growth of 28% in Latin America, 24% in Europe/CIS/Africa, 18% in Middle East & Asia and 11% in North America.
All Technologies experienced double-digit growth most notably in Well Services, Drilling & Measurements and Wireline.
Pretax operating income of $6.50 billion in 2008 was 9% higher than 2007. However, pretax operating margin declined 256 basis points (bps) to 26.8% primarily due to reduced pricing for well stimulation services in the US land GeoMarkets, a higher mix of low-margin third-party managed services in the Mexico/Central America GeoMarket and cost inflation across all Areas.
North America
Revenue of $5.91 billion grew 11% versus 2007. Growth was led by the US land West GeoMarket mostly due to increased gas shale activity that resulted in robust demand for Well Services and Drilling & Measurements technologies and by the US land Central GeoMarket on higher rig activity and strong Artificial Lift product sales. The Canada GeoMarket revenue was higher from demand for Well Services and Drilling & Measurements technologies while the US Gulf of Mexico GeoMarket grew on increased deepwater activity the resulted in strong demand for Drilling & Measurements and Wireline services in addition to Completion Systems products.
Pretax operating margin decreased 557 bps to 23.2% primarily as the result of lower pricing for well stimulation services in the US land GeoMarkets and cost inflation across the Area.
Latin America
Revenue of $4.23 billion was 28% higher than 2007 on double-digit growth across all GeoMarkets. The Mexico/Central America GeoMarket increased on significantly higher IPM activity while the Peru/Colombia/Ecuador GeoMarket also experienced increased IPM activity in addition to robust demand for Wireline services and for Artificial Lift and SIS products. The Brazil GeoMarket grew on higher offshore activity that resulted in stronger demand for Well Testing, Wireline and Well Services technologies. The Venezuela/Trinidad and Tobago GeoMarket experienced increased demand for Wireline, Drilling & Measurements and Well Services activities.
Pretax operating margin of 20.3% declined 262 bps versus 2007 as a result of an increased mix of low-margin third-party managed services in the Mexico/Central America GeoMarket and cost inflation across the Area.
Europe/CIS/Africa
Revenue of $8.18 billion increased 24% versus the same period last year. Growth was led by Russia which experienced strong demand for Wireline, Well Services and Drilling & Measurements technologies. The West & South Africa, North Sea and Caspian GeoMarkets grew on increased exploration-related services as well as strong demand for Well Services technologies. The Continental Europe GeoMarket was higher due to strong drilling-related activities and demand for SIS products. The consolidation of Framo also contributed to the increase.
21
Table of Contents
Part II, Item 7
Pretax operating margin decreased 112 bps to 27.4% primarily as a result of reduced pricing in the Libya GeoMarket and a less favorable revenue mix in the Nigeria & Gulf of Guinea GeoMarket and Russia. The consolidation of Framo also reduced total Area margin.
Middle East & Asia
Revenue of $5.72 billion was 18% higher than the prior year. All GeoMarkets experienced growth, most notably in the Arabian, Australia/Papua New Guinea/New Zealand, Gulf, and East Mediterranean GeoMarkets. Among the Technologies, growth was strongest in Wireline, Drilling & Measurements, Well Services and Well Testing.
Pretax operating margin was nearly flat at 35.0% as the positive impact of the higher overall activity level was offset by cost inflation.
Total Year 2007 Results
Full-year 2007 revenue of $20.31 billion increased 21% versus 2006, led by Area growths of 31% in both the Middle East & Asia, and in Europe/CIS/Africa and 29% in Latin America, while North America remained essentially flat. Pretax operating income of $5.96 billion in 2007 was 28% higher than 2006.
Pretax operating margins of 29.3% improved 164 bps in 2007 versus 2006. Higher activity and expansion of higher-margin new technology deployment across Europe/CIS/Africa, Middle East & Asia and Latin America Areas were the principal contributors to this performance. In North America, pricing erosion in pressure-pumping well-stimulation activities moderated year-on-year margin growth within the Area.
Among the GeoMarkets, the greatest increases in revenue were recorded in the North Sea, followed by Mexico/Central America, Arabian, West & South Africa, and Venezuela/Trinidad & Tobago.
Significant demand was seen for all Technologies led by Drilling & Measurements, Wireline, Well Testing, and Completions Systems as customers continued to improve exploration and production performance in the search for new hydrocarbon reserves and in the need to increase production and boost recovery from existing fields.
North America
Revenue of $5.34 billion increased marginally over 2006 primarily due to higher demand for Drilling & Measurements, Well Testing and Wireline activities in the US Land Central, US Land North and the US Gulf Coast GeoMarkets. However, this performance was offset by pricing erosion in well stimulation activities across the Area.
Activity across US Land continued to grow driven by the increase in rig count and higher service intensity in unconventional natural gas reservoirs. However, weakness in natural gas prices and excess well stimulation related pressure pumping capacity led to a year-on-year decline in pricing in stimulation related activities. The US Gulf Coast GeoMarket continued to grow driven by demand for exploration related activities.
In Canada year-on-year revenue declined sharply due to operator slowdown driven by weakness in natural gas prices and uncertainty over the fiscal regime.
Pretax operating margin declined by 167 bps to 28.8% primarily due to lower pricing in well stimulation related activities across the Area together with lower activity in Canada.
Latin America
Revenue of $3.30 billion in 2007 increased 29% over 2006, led by a surge in IPM-related activity in Mexico following the budget-related slowdowns in the previous year, followed by the growth in exploration-related activities in the Peru/Columbia/Ecuador and Latin America South GeoMarkets. The Venezuela/Trinidad & Tobago GeoMarket also grew with higher rig count-driven activity in addition to finalization of the contracts related to drilling barges.
22
Table of Contents
Part II, Item 7
The Mexico/Central America GeoMarket recorded robust growth with the start of several integrated projects. Peru/Columbia/Ecuador and Latin America South witnessed strong growth in exploration-related activities. Demand was strong for all Technologies led by IPM, followed by Drilling & Measurements, Wireline and Well Testing services.
Pretax operating margin increased strongly by 358 bps to reach 22.9%. This increase resulted mainly from a favorable activity mix and improved pricing.
Europe/CIS/Africa
Revenue of $6.60 billion in 2007 increased 31% over 2006 with the highest growth recorded in the North Sea, West & South Africa and North Africa GeoMarkets.
Strong revenue increases were recorded in the North Sea, West & South Africa and North Africa driven by the expansion of exploration-related activities. GeoMarkets in Russia continued to grow strongly due to a combination of organic growth and the completion of the acquisition of Tyumenpromgeofizika during the second quarter of the year.
Pretax operating margins increased by 301 bps to reach 28.6%. This performance was due to a combination of increased activity, improved pricing and accelerated new technology deployment across most GeoMarkets partially offset by a pricing decline in well stimulation activities in the East Russia and subdued activity in Nigeria.
Middle East & Asia
Revenue of $4.87 billion in 2007 increased 31% over 2006 with the largest increases recorded in the Arabian GeoMarket, followed by East Mediterranean, Australia/Papua New Guinea, Qatar, Gulf and India.
The Australia/Papua New Guinea GeoMarket recorded the highest growth rate in the Area driven by higher exploration related activity. Growth in East Mediterranean, Qatar, Gulf and India resulted from higher exploration and development activity while the Arabian GeoMarket continued to grow, albeit at a lower rate than the previous year, as new rig additions slowed down in Saudi Arabia.
Pretax operating margin increased by 296 bps to an impressive 35.1%. This performance was driven by continued increase in activity and pricing increases together with deployment of higher-margin Wireline and Drilling & Measurements new technologies.
WesternGeco
Fourth Quarter 2008 Results
Fourth-quarter revenue of $599 million decreased 33% sequentially and 25% year-on-year. Pretax operating income of $88 million was 75% lower sequentially and 68% lower year-on-year.
Sequentially, Marine revenue decreased significantly due to seasonal vessel transits, dry docks and project startups. Multiclient revenue was also down markedly as customers reduced discretionary spending. Land revenue, however, increased due to higher utilization and the start of new projects in Latin America and Africa while Data Processing recorded modest growth.
Pretax operating margin decreased sequentially from 39.8% to 14.7% due to lower Marine vessel utilization, higher transits and the slowdown in Multiclient sales, the effects of which were only partially offset by the higher Land crew utilization.
Total Year 2008 Results
Full-year 2008 revenue of $2.84 billion was 4% lower than 2007. Multiclient revenue was down 18%, primarily as the result of significantly lower client discretionary spending in the fourth quarter of 2008, while Land
23
Table of Contents
Part II, Item 7
decreased 15% on lower crew utilization. These decreases were partially offset by a 4% revenue increase in Marine, as a result of additional vessel capacity and higher pricing, and a 19% increase in Data Processing, which experienced a growth in activity in all geographic areas.
Pretax operating margin of 29.5% decreased 634 basis points due to significantly lower Multiclient sales, reduced Land activity and cost inflation that affected Marine operations.
Revenue backlog was $1.8 billion at the end of 2008, compared to $1.2 billion at the end of 2007, of which an estimated $1.3 billion is expected to be realized in 2009.
Total Year 2007 Results
Full-year 2007 revenue of $2.96 billion increased 20% versus 2006. Pretax operating income of $1.06 billion in 2007 was 31% higher than 2006. Pretax operating margin reached 35.8% – an increase of 299 bps in 2007 versus 2006 – demonstrating continued high vessel utilization, pricing increases in Marine and accelerating demand for exploration-driven seismic services. Q-Technology revenue reached $1.14 billion, representing 38% of 2007 full-year revenue.
Marine revenue grew 17% due mainly to strong activity in Asia, Middle East, India, Europe and North America as operators continued to focus on new exploration horizons. High vessel utilization, continued adoption of Q-Technology and improved pricing contributed to this performance. Multiclient revenue increased 30% driven by higher sales in North America as the demand for E-Dog and E-Cat surveys remained strong during the first half of the year augmented by strong demand for E-Octopus surveys during the second half. Data Processing revenue increased 26%, reflecting higher acquisition volumes, higher levels of Q processing, and higher activity in India, Asia, North Africa, Europe and the Caspian. Land revenue increased 6% with the continued adoption of Q-Land* technology in Africa and in the Middle East.
During the second quarter of 2007, the seventh Q-Technology equipped vessel – the Western Spirit – was launched.
Revenue backlog was $1.2 billion at the end of 2007 compared to $1.1 billion at the end of 2006.
Interest and Other Income
Interest and other income consisted of the following:
| (Stated in millions) | |||||||||||
| 2008 | 2007 | 2006 | |||||||||
| Interest income |
$ | 119 | $ | 162 | $ | 117 | |||||
| Equity in net earnings of affiliated companies |
293 | 244 | 179 | ||||||||
| Other 1 |
(10 | ) | 25 | (9 | ) | ||||||
| $ | 402 | $ | 431 | $ | 287 | ||||||
| 1. | Refer to Note 3 to the Consolidated Financial Statements for details. |
Interest Income
The average return on investments decreased to 3.5% in 2008 from 5.2% in 2007 and the weighted average investment balance of $3.4 billion in 2008 increased $286 million compared to 2007.
The average return on investments increased to 5.2% in 2007 from 4.5% in 2006 and the weighted average investment balance of $3.1 billion in 2007 increased $531 million compared to 2006.
Equity in Net Earnings of Affiliated Companies
The equity in net earnings of affiliated companies primarily represents Schlumberger’s share of the results of its 40% interest in the M-I SWACO drilling fluids joint venture with Smith International Inc.
24
Table of Contents
Part II, Item 7
Interest Expense
Interest expense of $247 million in 2008 decreased by $27 million compared to 2007 due to a decline in the weighted average borrowing rates, from 5.0% to 4.5%. The weighted average debt balance of $5.5 billion in 2008 was essentially flat compared to 2007.
Interest expense of $275 million in 2007 increased by $40 million compared to 2006. The weighted average borrowing rates of 5.0% in 2007 increased from 4.6% in 2006. The weighted average debt balance of $5.5 billion in 2007 increased by $420 million compared to 2006, primarily due to the funding, in the second quarter of 2006, of the WesternGeco transaction described in Note 4 to the Consolidated Financial Statements.
Other
Gross margin was 30.2%, 33.5% and 31.4% in 2008, 2007 and 2006, respectively.
The decline in gross margin percentage in 2008, compared to 2007, was primarily attributable to the following factors: reduced pricing for well stimulation services in the US Land GeoMarkets, a higher mix of low-margin third-party managed services in the Mexico/Central America GeoMarket, significantly lower Multiclient sales in WesternGeco and the impact of cost inflation across all Areas within Oilfield Services as well as the Marine operations of WesternGeco.
The increase in gross margin percentage in 2007, compared to 2006, was primarily due to increased pricing, stronger demand for higher-margin technologies, and operating efficiency improvements.
As a percentage of Revenue, Research & engineering, Marketing and General & administrative expenses were as follows:
| 2008 | 2007 | 2006 | |||||||
| Research & engineering |
3.0 | % | 3.1 | % | 3.2 | %* | |||
| Marketing |
0.4 | % | 0.4 | % | 0.4 | % | |||
| General & administrative |
2.2 | % | 2.2 | % | 2.4 | % |
| * | Research & engineering in 2006 included $27 million of in-process research and development charges associated with acquisitions. See discussion of the Charges and Credits in Note 3 to the Consolidated Financial Statements. |
Research & engineering expenditures, by segment, were as follows:
| (Stated in millions) | |||||||||
| 2008 | 2007 | 2006 | |||||||
| Oilfield Services |
$ | 686 | $ | 595 | $ | 496 | |||
| WesternGeco |
118 | 120 | 73 | ||||||
| In-process R&D charges 1 |
– | – | 27 | ||||||
| Other 2 |
15 | 13 | 23 | ||||||
| $ | 819 | $ | 728 | $ | 619 | ||||
| 1. | See discussion of Charges and Credits in Note 3 to the Consolidated Financial Statements. |
| 2. | Includes $16 million of cost in 2006 associated with Schlumberger’s relocation of its United States research center from Ridgefield to Boston. |
Income Taxes
The effective tax rate was 20.9% in 2008, 21.9% in 2007 and 24.0% in 2006.
The Schlumberger effective tax rate is sensitive to the geographic mix of earnings. When the percentage of pretax earnings generated outside of North America increases, the Schlumberger effective tax rate will generally decrease. Conversely, when the percentage of pretax earnings generated outside of North America decreases, the Schlumberger effective tax rate will generally increase.
25
Table of Contents
Part II, Item 7
The decrease in the effective tax rate in 2008, as compared to 2007, was primarily attributable to the geographic mix of earnings. Oilfield Services had a lower proportion of pretax earnings in North America. Also, outside North America, various GeoMarkets with lower tax rates contributed a greater percentage to pretax earnings.
The decrease in the effective tax rate in 2007, as compared to 2006, was primarily attributable to the geographic mix of earnings. Both Oilfield Services and WesternGeco had a lower proportion of pretax earnings in North America. Outside North America, various GeoMarkets with lower tax rates contributed a greater percentage to pretax earnings.
Charges and Credits
Schlumberger recorded significant charges and credits during 2008, 2007 and 2006. These charges and credits, which are summarized below, are more fully described in Note 3 to the Consolidated Financial Statements.
The following is a summary of the 2008 Charges and Credits:
| (Stated in millions) | ||||||||||||||||
| Pretax | Tax | Minority Interest |
Net | Income Statement Classification | ||||||||||||
| Charges and Credits |
||||||||||||||||
| –Workforce reduction |
$ | 74.4 | $ | (9.1 | ) | $ | – | $ | 65.3 | Cost of goods sold and services | ||||||
| –Provision for doubtful accounts |
31.8 | (7.8 | ) | (6.1 | ) | 17.9 | Cost of goods sold and services | |||||||||
| –Other |
9.8 | – | – | 9.8 | Interest and other income | |||||||||||
| Net Charges |
$ | 116.0 | $ | (16.9 | ) | $ | (6.1 | ) | $ | 93.0 | ||||||
The following is a summary of the 2007 Charges and Credits:
| (Stated in millions) | ||||||||||||||||
| Pretax | Tax | Minority Interest |
Net | Income Statement Classification | ||||||||||||
| Charges and Credits |
||||||||||||||||
| - Gain on sale of workover rigs |
$ | (24.5 | ) | $ | 7.1 | $ | – | $ | (17.4 | ) | Interest and other income | |||||
The following is a summary of the 2006 Charges and Credits:
| (Stated in millions) | |||||||||||||||
| Pretax | Tax | Minority Interest |
Net | Income Statement Classification | |||||||||||
| Charges and Credits |
|||||||||||||||
| –WesternGeco in-process R&D charge |
$ | 21.0 | $ | – | $ | – | $ | 21.0 | Research & engineering | ||||||
| –Loss on liquidation of investments to fund WesternGeco transaction |
9.4 | – | – | 9.4 | Interest and other income | ||||||||||
| –WesternGeco visa settlement |
9.7 | 0.3 | (3.2 | ) | 6.8 | Cost of goods sold and services | |||||||||
| –Other in-process R&D charges |
5.6 | – | – | 5.6 | Research & engineering | ||||||||||
| Net Charges |
$ | 45.7 | $ | 0.3 | $ | (3.2 | ) | $ | 42.8 | ||||||
Cash Flow
Net Debt represents gross debt less cash, short-term investments and fixed income investments, held to maturity. Management believes that Net Debt provides useful information regarding the level of Schlumberger’s indebtedness by reflecting cash and investments that could be used to repay debt.
26
Table of Contents
Part II, Item 7
Details of Net Debt follow:
| (Stated in millions) | ||||||||||||
| 2008 | 2007 | 2006 | ||||||||||
| Net Debt, beginning of year |
$ | (1,857 | ) | $ | (2,834 | ) | $ | (532 | ) | |||
| Net income |
5,435 | 5,177 | 3,710 | |||||||||
| Excess of equity income over dividends received |
(235 | ) | (189 | ) | (181 | ) | ||||||
| Depreciation and amortization 1 |
2,269 | 1,954 | 1,561 | |||||||||
| Increase in working capital |
(591 | ) | (541 | ) | (341 | ) | ||||||
| Pension plan contributions |
(290 | ) | (250 | ) | (251 | ) | ||||||
| Capital expenditures |
(3,723 | ) | (2,931 | ) | (2,457 | ) | ||||||
| Multiclient seismic data capitalized |
(345 | ) | (260 | ) | (180 | ) | ||||||
| Proceeds from employee stock plans |
351 | 622 | 442 | |||||||||
| Stock repurchase program |
(1,819 | ) | (1,355 | ) | (1,068 | ) | ||||||
| Dividends paid |
(964 | ) | (771 | ) | (568 | ) | ||||||
| Eastern Echo acquisition |
– | (699 | ) | – | ||||||||
| Acquisition of minority interest in WesternGeco |
– | – | (2,406 | ) | ||||||||
| Other business acquisitions |
(345 | ) | (286 | ) | (577 | ) | ||||||
| Conversion of debentures |
448 | 656 | – | |||||||||
| Distribution to joint venture partner |
– | – | (60 | ) | ||||||||
| Translation effect on net debt |
166 | (128 | ) | (66 | ) | |||||||
| Other |
371 | (22 | ) | 140 | ||||||||
| Net Debt, end of year |
$ | (1,129 | ) | $ | (1,857 | ) | $ | (2,834 | ) | |||
| 1. | Includes Multiclient seismic data costs. |
| (Stated in millions) | ||||||||||||
| Dec. 31 | Dec. 31 | Dec. 31 | ||||||||||
| Components of Net Debt | 2008 | 2007 | 2006 | |||||||||
| Cash |
$ | 189 | $ | 197 | $ | 166 | ||||||
| Short-term investments |
3,503 | 2,972 | 2,833 | |||||||||
| Fixed income investments, held to maturity |
470 | 440 | 153 | |||||||||
| Bank loans and current portion of long-term debt |
(1,598 | ) | (1,318 | ) | (1,322 | ) | ||||||
| Convertible debentures |
(321 | ) | (769 | ) | (1,425 | ) | ||||||
| Other long-term debt |
(3,372 | ) | (3,379 | ) | (3,239 | ) | ||||||
| $ | (1,129 | ) | $ | (1,857 | ) | $ | (2,834 | ) | ||||
Key liquidity events during 2008, 2007 and 2006 included:
| · | In September 2008, Schlumberger Finance B.V. issued €500 million 5.25% Guaranteed Notes due 2013. Schlumberger entered into agreements to swap these Euro notes for US dollars on the date of issue until maturity, effectively making this a US dollar denominated debt on which Schlumberger Finance B.V. will pay interest in US dollars at a rate of 4.74%. The proceeds from these notes were used to repay commercial paper borrowings. |
| · | On July 22, 2004, the Board of Directors of Schlumberger approved a share repurchase program of up to 30 million shares of common stock to be acquired in the open market before December 2006, subject to market conditions. This program was completed during the first quarter of 2006. |
On April 20, 2006, the Board of Directors of Schlumberger approved a share repurchase program of up to 40 million shares of common stock to be acquired in the open market before April 2010, subject to market conditions. This program was completed during the second quarter of 2008.
On April 17, 2008, the Board of Directors of Schlumberger approved an $8 billion share repurchase program for shares of Schlumberger common stock to be acquired in the open market before December 31, 2011, of which $934 million has been repurchased as of December 31, 2008.
27
Table of Contents
Part II, Item 7
The following table summarizes the activity under these share repurchase programs during 2008, 2007 and 2006:
| (Stated in thousands except per share amounts and prices) | ||||||||
| Total cost of shares purchased |
Total number of shares purchased |
Average price paid per share | ||||||
| 2008 |
$ | 1,818,841 | 21,064.7 | $ | 86.35 | |||
| 2007 |
$ | 1,355,000 | 16,336.1 | $ | 82.95 | |||
| 2006 |
$ | 1,067,842 | 17,992.7 | $ | 59.35 | |||
Given the current credit and economic environment, Schlumberger anticipates that the total dollar amount of stock repurchases in 2009 may be significantly less than the $1.8 billion spent during 2008. This anticipated reduction will serve to increase Schlumberger’s financial flexibility during these uncertain times. Stock buy-back activity during 2009 will continue to be targeted to offset any dilution caused by the Schlumberger stock-based compensation programs.
| · | Cash flow provided by operations was $6.9 billion in 2008, $6.3 billion in 2007 and $4.7 billion in 2006. These improvements were driven by the revenue and net income increases experienced in 2008 and 2007 offset by required investments in working capital. |
| · | During 2008, 2007 and 2006, Schlumberger announced that its Board of Directors had approved increases in the quarterly dividend of 20%, 40% and 19%, respectively. Total dividends paid during 2008, 2007 and 2006 were $964 million, $771 million and $568 million, respectively. |
| · | Capital expenditures were $3.7 billion in 2008, $2.9 billion in 2007 and $2.5 billion in 2006. These increases were a result of the increased activity levels experienced in recent years. Capital expenditures are expected to approach $3.0 billion in 2009, including $385 million relating to the construction of seismic vessels. |
| · | During 2008, 2007 and 2006 Schlumberger made $290 million, $250 million and $251 million, respectively, of contributions to its defined benefit pension plans. The US qualified pension plan was 71% funded at December 31, 2008 based on the projected benefit obligation. This compares to 109% funded at December 31, 2007. |
Outside of the US, Schlumberger’s International Staff Pension Plan, which was converted to a defined benefit pension plan during the fourth quarter of 2008 (and therefore accounts for approximately half of the increase in the Postretirement Benefits liability on the Consolidated Balance Sheet at December 31, 2008), and UK pension plan are a combined 69% funded at December 31, 2008 based on the projected benefit obligation. The UK pension plan was 92% funded at December 31, 2007.
Schlumberger currently anticipates contributing approximately $400 million to $500 million to its defined benefit pension plans in 2009, subject to market and business conditions.
| · | During 2008 and 2007, certain holders of Schlumberger Limited 1.5% Series A Convertible Debentures due June 1, 2023 and 2.125% Series B Convertible Debentures due June 1, 2023 converted their debentures into Schlumberger common stock. The following table summarizes these conversions: |
| (Stated in millions) | ||||||||||
| 2008 |
2007 | |||||||||
| Conversions |
Shares issued |
Conversions |
Shares issued | |||||||
| 1.5% Series A debentures |
$ | 353 | 9.76 | $ | 622 | 17.19 | ||||
| 2.125% Series B debentures |
95 | 2.36 | 34 | 0.85 | ||||||
| $ | 448 | 12.12 | $ | 656 | 18.04 | |||||
28
Table of Contents
Part II, Item 7
At December 31, 2008, there were no outstanding Series A debentures and there were $321 million outstanding Series B debentures.
| · | On December 10, 2007, Schlumberger completed the acquisition of Eastern Echo for $838 million in cash. Net assets acquired included $320 million of cash and investments and $182 million of long-term debt. |
| · | On April 28, 2006, Schlumberger acquired the remaining 30% minority interest in WesternGeco from Baker Hughes Incorporated for $2.4 billion in cash. Approximately 50% of the purchase price was funded from Schlumberger’s cash and investments. The remaining 50% was financed through existing Schlumberger credit facilities. |
| · | In September 2006, Schlumberger Finance B.V. issued €400 million Guaranteed Floating Rate Notes due 2009. Interest is payable quarterly at the rate of 10 basis points over 3-month Euribor. Schlumberger entered into an agreement to swap these Euro notes for US dollars on the date of issue until maturity, effectively making this US dollar denominated debt on which Schlumberger Finance B.V. will pay interest in US dollars at the rate of 3-month LIBOR plus 0.0875%. The proceeds from these notes were used to repay commercial paper borrowings. |
As of December 31, 2008, Schlumberger had approximately $3.7 billion of cash and short-term investments on hand. Wholly-owned subsidiaries of Schlumberger had separate committed debt facility agreements aggregating $3.9 billion with commercial banks, of which $1.8 billion was available and unused as of December 31, 2008. Schlumberger believes that these amounts are sufficient to meet future business requirements for at least the next twelve months.
The current portion of long-term debt at December 31, 2008 has increased by $0.5 billion to $1.1 billion, as compared to December 31, 2007. This increase is primarily attributable to the outstanding €400 million Guaranteed Floating Rate Notes due 2009 being reclassified from long-term debt at December 21, 2008 to current at December 31, 2008 due to their maturity in the next twelve months.
Schlumberger’s total outstanding debt at December 31, 2008 was $5.3 billion and included approximately $1.1 billion of commercial paper borrowings. The total outstanding debt decreased approximately $0.2 billion compared to December 31, 2007.
Summary of Major Contractual Obligations
| (Stated in millions) | |||||||||||||||
| Payment Period | |||||||||||||||
| Contractual Obligations | Total | 2009 | 2010 - 2011 | 2012 - 2013 | After 2013 | ||||||||||
| Debt 1 |
$ | 5,291 | $ | 1,597 | $ | 1,546 | $ | 2,148 | $ | – | |||||
| Operating Leases |
$ | 1,025 | $ | 293 | $ | 318 | $ | 156 | $ | 258 | |||||
| Purchase Obligations 2 |
$ | 1,588 | $ | 1,461 | $ | 127 | $ | – | $ | – | |||||
| $ | 7,904 | $ | 3,351 | $ | 1,991 | $ | 2,304 | $ | 258 | ||||||
| 1. | Excludes future payments for interest. Includes amounts relating to the $321 million of Convertible Debentures which are described in Note 11 of the Consolidated Financial Statements. |
| 2. | Represents an estimate of contractual obligations in the ordinary course of business. Although these contractual obligations are considered enforceable and legally binding, the terms generally allow Schlumberger the option to reschedule and adjust their requirements based on business needs prior to the delivery of goods. |
Refer to Note 19 of the Consolidated Financial Statements for details regarding Schlumberger’s pension and other postretirement benefit obligations.
29
Table of Contents
Part II, Item 7
As discussed in Note 15 of the Consolidated Financial Statements, included in the Schlumberger Consolidated Balance Sheet at December 31, 2008 is approximately $877 million of liabilities associated with uncertain tax positions in the over 100 jurisdictions in which Schlumberger conducts business. Due to the uncertain and complex application of tax regulations, combined with the difficulty in predicting when tax audits throughout the world may be concluded, Schlumberger cannot make reliable estimates of the timing of cash outflows relating to these liabilities.
Schlumberger has outstanding letters of credit/guarantees which relate to business performance bonds, custom/excise tax commitments, facility lease/rental obligations, etc. These were entered into in the ordinary course of business and are customary practices in the various countries where Schlumberger operates.
Critical Accounting Policies and Estimates
The preparation of financial statements and related disclosures in conformity with accounting principles generally accepted in the United States requires Schlumberger to make estimates and assumptions that affect the reported amounts of assets and liabilities, the disclosure of contingent assets and liabilities and the reported amounts of revenue and expenses. The following accounting policies involve “critical accounting estimates” because they are particularly dependent on estimates and assumptions made by Schlumberger about matters that are inherently uncertain. A summary of all of Schlumberger’s significant accounting policies is included in Note 2 to the Consolidated Financial Statements.
Schlumberger bases its estimates on historical experience and on various assumptions that are believed to be reasonable under the circumstances, the results of which form the basis for making judgments about the carrying values of assets and liabilities that are not readily apparent from other sources. Actual results may differ from these estimates under different assumptions or conditions.
Multiclient Seismic Data
The WesternGeco segment capitalizes the costs associated with obtaining multiclient seismic data. The carrying value of the multiclient seismic data library at December 31, 2008 and 2007 was $287 million and $182 million, respectively. Such costs are charged to Cost of goods sold and services based on the percentage of the total costs to the estimated total revenue that Schlumberger expects to receive from the sales of such data. However, under no circumstances will an individual survey carry a net book value greater than a 4-year straight-line amortized value.
The carrying value of surveys is reviewed for impairment annually as well as when an event or change in circumstance indicates an impairment may have occurred. Adjustments to the carrying value are recorded when it is determined that estimated future revenues, which involve significant judgment on the part of Schlumberger, would not be sufficient to recover the carrying value of the surveys. Significant adverse changes in Schlumberger’s estimated future cash flows could result in impairment charges in a future period. For purposes of performing the annual impairment test of the multiclient library, future cash flows are analyzed primarily based on two pools of surveys: United States and non-United States. The United States and non-United States pools were determined to be the most appropriate level at which to perform the impairment review based upon a number of factors including (i) various macroeconomic factors that influence the ability to successfully market surveys and (ii) the focus of the sales force and related costs. Certain larger surveys are analyzed for impairment on a survey by survey basis. These surveys are typically significantly prefunded by customers and accordingly, management has determined that it is not appropriate to include them within the United States and non-United States pools for impairment review purposes.
30
Table of Contents
Part II, Item 7
Allowance for Doubtful Accounts
Schlumberger maintains an allowance for doubtful accounts in order to record accounts receivable at their net realizable value. A significant amount of judgment is involved in recording and making adjustments to this reserve. Allowances have been recorded for receivables believed to be uncollectible, including amounts for the resolution of potential credit and other collection issues such as disputed invoices. Depending on how such potential issues are resolved, or if the financial condition of Schlumberger customers were to deteriorate resulting in an impairment of their ability to make payments, adjustments to the allowance may be required.
Goodwill, Intangible Assets and Long-Lived Assets
Schlumberger records as goodwill the excess of purchase price over the fair value of the tangible and identifiable intangible assets acquired. Statement of Financial Accounting Standards No. 142, “Goodwill and Other Intangible Assets” (SFAS 142), requires goodwill to be tested for impairment annually as well as when an event or change in circumstance indicates an impairment may have occurred. Goodwill is tested for impairment by comparing the fair value of Schlumberger’s individual reporting units to their carrying amount to determine if there is a potential goodwill impairment. If the fair value of the reporting unit is less than its carrying value, an impairment loss is recorded to the extent that the implied fair value of the goodwill of the reporting unit is less than its carrying value.
For purposes of performing the impairment test for goodwill as required by SFAS 142, Schlumberger’s reporting units are primarily the geographic areas comprising the Oilfield Services segment in addition to the WesternGeco segment. Schlumberger estimates the fair value of these reporting units using a discounted cash flow analysis and/or applying various market multiples. Determining the fair value of a reporting unit is a matter of judgment and often involves the use of significant estimates and assumptions. Schlumberger’s estimates of the fair value of each of its reporting units were significantly in excess of their respective carrying values at the time of the annual goodwill impairment tests for 2008, 2007 and 2006.
Long-lived assets, including fixed assets and intangible assets, are reviewed for impairment whenever events or changes in circumstances indicate that the carrying value may not be recoverable. In reviewing for impairment, the carrying value of such assets is compared to the estimated undiscounted future cash flows expected from the use of the assets and their eventual disposition. If such cash flows are not sufficient to support the asset’s recorded value, an impairment charge is recognized to reduce the carrying value of the long-lived asset to its estimated fair value. The determination of future cash flows as well as the estimated fair value of long-lived assets involves significant estimates on the part of management. If there is a material change in economic conditions or other circumstances influencing the estimate of future cash flows or fair value, Schlumberger could be required to recognize impairment charges in the future. Schlumberger evaluates the remaining useful life of its intangible assets on a periodic basis to determine whether events and circumstances warrant a revision to the remaining estimated amortization period.
Income Taxes
Schlumberger’s tax filings are subject to regular audit by the tax authorities in most of the over 100 jurisdictions in which it conducts business. These audits may result in assessments for additional taxes which are resolved with the authorities or, potentially, through the courts. Tax liabilities are recorded based on estimates of additional taxes which will be due upon the conclusion of these audits. Estimates of these tax liabilities are made based upon prior experience and are updated in light of changes in facts and circumstances. However, due to the uncertain and complex application of tax regulations, it is possible that the ultimate resolution of audits may result in liabilities which could be materially different from these estimates. In such an event, Schlumberger will record additional tax expense or tax benefit in the period in which such resolution occurs.
31
Table of Contents
Part II, Item 7
Pension and Postretirement Benefits
Schlumberger’s pension and postretirement benefit obligations are described in detail in Note 19 to the Consolidated Financial Statements. The obligations and related costs are calculated using actuarial concepts, which include critical assumptions related to the discount rate, expected return on plan assets and medical cost trend rates. These assumptions are important elements of expense and/or liability measurement and are updated on an annual basis, or upon the occurrence of significant events.
The discount rate Schlumberger uses reflects the prevailing market rate of a portfolio of high-quality debt instruments with maturities matching the expected timing of the payment of the benefit obligations. The following summarizes the discount rates utilized by Schlumberger for its various pension and postretirement benefit plans:
| · | The discount rate utilized to determine the liability for Schlumberger’s United States pension plans and postretirement medical plans was 6.50% at both December 31, 2008 and December 31, 2007. |
| · | The weighted-average discount rate utilized to determine the liability for Schlumberger’s international pension plans was 6.48% at December 31, 2008 and 5.80% at December 31, 2007. |
| · | The discount rate utilized to determine expense for Schlumberger’s United States pension plans and postretirement medical plans was increased from 6.00% in 2007 to 6.50% in 2008. |
| · | The weighted-average discount rate utilized to determine expense for Schlumberger’s international pension plans was increased from 5.20% in 2007 to 5.80% in 2008. |
A higher discount rate decreases the present value of benefit obligations and decreases expense.
The expected rate of return for our retirement benefit plans represents the average rate of return expected to be earned on plan assets over the period that benefits included in the benefit obligation, are expected to be paid. The expected rate of return for Schlumberger’s United States pension plans has been determined based upon expectations regarding future rates of return for the investment portfolio, with consideration given to the distribution of investments by asset class and historical rates of return for each individual asset class. The expected rate of return on plan assets for the United States pension plans was 8.50% in 2008 and 2007. The expected rate of return on plan assets for the international plans was 8.00% in 2008 and 2007. A lower expected rate of return would increase pension expense.
Schlumberger’s medical cost trend rate assumptions are developed based on historical cost data, the near-term outlook and an assessment of likely long-term trends. The overall medical cost trend rate assumption utilized in both 2008 and 2007 was 9% graded to 6% over the next four years and 5% thereafter.
The following illustrates the sensitivity to changes in certain assumptions, holding all other assumptions constant, for the United States and international pension plans:
| (Stated in millions) | ||||
| Change in Assumption | Effect on 2008 Pretax Pension Expense |
Effect on Dec. 31, 2008 Liability | ||
| 25 basis point decrease in discount rate |
+$15 | +$181 | ||
| 25 basis point increase in discount rate |
- $14 | - $172 | ||
| 25 basis point decrease in expected return on plan assets |
+$ 7 | – | ||
| 25 basis point increase in expected return on plan assets |
- $ 7 | – | ||
32
Table of Contents
Part II, Item 7, 7A
The following illustrates the sensitivity to changes in certain assumptions, holding all other assumptions constant, for Schlumberger’s United States postretirement medical plans:
| (Stated in millions) | ||||
| Change in Assumption | Effect on 2008 Pretax Postretirement Medical Expense |
Effect on Dec. 31, 2008 Liability | ||
| 25 basis point decrease in discount rate |
+$ 3 | +$ 30 | ||
| 25 basis point increase in discount rate |
- $ 3 | - $ 32 | ||
| 100 basis point decrease per annum in medical cost trend rate |
- $19 | - $109 | ||
| 100 basis point increase per annum in medical cost trend rate |
+$23 | +$127 | ||
Item 7A. Quantitative and Qualitative Disclosures About Market Risk.
Schlumberger is subject to market risks primarily associated with changes in foreign currency exchange rates, commodity prices and interest rates.
As a multinational company, Schlumberger conducts business in approximately 80 countries. Schlumberger’s functional currency is primarily the US dollar, which is consistent with the oil and gas industry. Approximately 80% of Schlumberger’s revenue in 2008 was denominated in US dollars. However, outside the United States, a significant portion of Schlumberger’s expenses is incurred in foreign currencies. Therefore, when the US dollar weakens in relation to the foreign currencies of the countries in which Schlumberger conducts business, the US dollar-reported expenses will increase.
A 5% change in the average exchange rates of all the foreign currencies in 2008 would have changed revenue by approximately 1%. If the 2008 average exchange rates of the US dollar against all foreign currencies had strengthened by 5%, Schlumberger’s income from continuing operations would have increased by approximately 2%. Conversely, a 5% weakening of the US dollar average exchange rates would have decreased income from continuing operations by approximately 3%.
Schlumberger maintains a foreign-currency risk management strategy that uses derivative instruments to protect its interests from unanticipated fluctuations in earnings and cash flows caused by volatility in currency exchange rates. Foreign currency forward contracts and foreign currency options to provide a hedge against currency fluctuations either on monetary assets/liabilities denominated in other than a functional currency or on expenses.
At December 31, 2008, contracts were outstanding for the US dollar equivalent of $2.9 billion in various foreign currencies. These contracts mature on various dates in 2009.
Schlumberger is subject to interest rate risk on its debt and its investment portfolio. Schlumberger maintains an interest rate risk management strategy that generally does not involve derivatives and instead primarily uses a mix of variable and fixed rate debt combined with its investment portfolio to mitigate the exposure to changes in interest rates. At December 31, 2008, Schlumberger had fixed rate debt aggregating approximately $2.2 billion and variable rate debt aggregating approximately $3.1 billion.
Schlumberger’s exposure to interest rate risk associated with its debt is also partially mitigated by its investment portfolio. Both Short-term investments and Fixed income investments, held to maturity, which totaled approximately $4.0 billion at December 31, 2008, are comprised primarily of money market funds, eurodollar time deposits, certificates of deposit, commercial paper, euro notes and Eurobonds and are substantially all denominated in US dollars. The average return on investment was 3.5% in 2008.
33
Table of Contents
Part II, Item 7A
The following table represents principal amounts of Schlumberger’s debt at December 31, 2008 by year of maturity:
| (Stated in millions) | ||||||||||||||||||
| Expected Maturity Dates | ||||||||||||||||||
| 2009 | 2010 | 2011 | 2012 | 2013 | Total | |||||||||||||
| Fixed rate debt |
||||||||||||||||||
| 5.25% Guaranteed Bonds (Euro denominated) |
$ | 714 | $ | 714 | ||||||||||||||
| 2.125% Series B Convertible Debentures |
$ | 321 | 321 | |||||||||||||||
| 5.14% Guaranteed Notes (Canadian dollar denominated) |
203 | 203 | ||||||||||||||||
| 5.875% Guaranteed Bonds (Euro denominated) |
$ | 355 | 355 | |||||||||||||||
| 6.5% Notes |
$ | 647 | 647 | |||||||||||||||
| Total fixed rate debt |
$ | – | $ | 524 | $ | 355 | $ | 647 | $ | 714 | $ | 2,240 | ||||||
| Variable rate debt |
$ | 1,597 | $ | 245 | $ | 422 | $ | 771 | $ | 16 | $ | 3,051 | ||||||
| Total |
$ | 1,597 | $ | 769 | $ | 777 | $ | 1,418 | $ | 730 | $ | 5,291 | ||||||
The fair market value of the outstanding fixed rate debt was approximately $2.4 billion as of December 31, 2008. The weighted average interest rate on the variable rate debt as of December 31, 2008 was approximately 4.5%.
Schlumberger does not enter into foreign currency or interest rate derivatives for speculative purposes.
Forward-looking Statements
This Report and other statements we make contain “forward-looking statements” within the meaning of the federal securities laws, which include any statements that are not historical facts, such as our forecasts or expectations regarding business outlook; growth for Schlumberger as a whole and for each of Oilfield Services and WesternGeco (and for specified products or geographic areas within each segment); oil and natural gas demand and production growth; operating margins; operating and capital expenditures as well as research & development spending, by Schlumberger and the oil and gas industry; the business strategies of Schlumberger’s customers; the Schlumberger effective tax rate; Schlumberger’s stock repurchase program; expected pension and post-retirement funding; expected stock compensation costs; exploitation and integration of technology; and future results of operations. These statements are subject to risks and uncertainties, including, but not limited to, the current global economic downturn; changes in exploration and production spending by Schlumberger’s customers and changes in the level of oil and natural gas exploration and development; general economic and business conditions in key regions of the world; the financial condition of our suppliers and customers in light of current global economic conditions; operational and project modifications, delays or cancellations; political and economic uncertainty and socio-political unrest; and other risks and uncertainties described elsewhere in this Report, including under “Item 1A. Risk Factors”. If one or more of these risks or uncertainties materialize (or the consequences of such a development changes), or should underlying assumptions prove incorrect, actual outcomes may vary materially from those forecasted or expected. Schlumberger disclaims any intention or obligation to update publicly or revise such statements, whether as a result of new information, future events or otherwise.
34
Table of Contents
Part II, Item 8
Item 8. Financial Statements and Supplementary Data.
SCHLUMBERGER LIMITED AND SUBSIDIARIES
CONSOLIDATED STATEMENT OF INCOME
| (Stated in thousands, except per share amounts) | |||||||||||
| Year Ended December 31, | 2008 | 2007 | 2006 | ||||||||
| Revenue |
$ | 27,162,933 | $ | 23,276,542 | $ | 19,230,478 | |||||
| Interest and other income, net |
401,834 | 431,495 | 286,716 | ||||||||
| Expenses |
|||||||||||
| Cost of goods sold and services |
18,967,031 | 15,481,746 | 13,182,753 | ||||||||
| Research & engineering |
818,791 | 728,491 | 619,316 | ||||||||
| Marketing |
95,120 | 81,545 | 75,704 | ||||||||
| General & administrative |
584,118 | 517,248 | 456,347 | ||||||||
| Interest |
247,252 | 274,558 | 234,916 | ||||||||
| Income from Continuing Operations before taxes and minority interest |
6,852,455 | 6,624,449 | 4,948,158 | ||||||||
| Taxes on income |
1,430,124 | 1,447,933 | 1,189,568 | ||||||||
| Income from Continuing Operations before minority interest |
5,422,331 | 5,176,516 | 3,758,590 | ||||||||
| Minority interest |
(25,380 | ) | – | (48,739 | ) | ||||||
| Income from Continuing Operations |
5,396,951 | 5,176,516 | 3,709,851 | ||||||||
| Income from Discontinued Operations |
37,850 | – | – | ||||||||
| Net Income |
$ | 5,434,801 | $ | 5,176,516 | $ | 3,709,851 | |||||
| Basic earnings per share: |
|||||||||||
| Income from Continuing Operations |
$ | 4.51 | $ | 4.36 | $ | 3.14 | |||||
| Income from Discontinued Operations |
0.03 | – | – | ||||||||
| Net Income |
$ | 4.54 | $ | 4.36 | $ | 3.14 | |||||
| Diluted earnings per share: |
|||||||||||
| Income from Continuing Operations |
$ | 4.42 | $ | 4.20 | $ | 3.01 | |||||
| Income from Discontinued Operations |
0.03 | – | – | ||||||||
| Net Income |
$ | 4.45 | $ | 4.20 | $ | 3.01 | |||||
| Average shares outstanding |
1,196,237 | 1,187,944 | 1,181,683 | ||||||||
| Average shares outstanding, assuming dilution |
1,223,894 | 1,238,675 | 1,242,196 | ||||||||
See the Notes to Consolidated Financial Statements
35
Table of Contents
Part II, Item 8
SCHLUMBERGER LIMITED AND SUBSIDIARIES
CONSOLIDATED BALANCE SHEET
| (Stated in thousands) | ||||||||
| December 31, | 2008 | 2007 | ||||||
| ASSETS |
||||||||
| Current Assets | ||||||||
| Cash |
$ | 188,928 | $ | 197,233 | ||||
| Short-term investments |
3,502,742 | 2,971,800 | ||||||
| Receivables less allowance for doubtful accounts |
6,257,861 | 5,361,114 | ||||||
| Inventories |
1,918,503 | 1,638,192 | ||||||
| Deferred taxes |
184,063 | 182,562 | ||||||
| Other current assets |
841,580 | 704,482 | ||||||
| 12,893,677 | 11,055,383 | |||||||
| Fixed Income Investments, held to maturity |
469,937 | 440,127 | ||||||
| Investments in Affiliated Companies |
1,869,820 | 1,412,189 | ||||||
| Fixed Assets less accumulated depreciation |
9,690,340 | 8,007,991 | ||||||
| Multiclient Seismic Data |
287,238 | 182,282 | ||||||
| Goodwill |
5,188,996 | 5,142,083 | ||||||
| Intangible Assets |
819,986 | 902,700 | ||||||
| Deferred Taxes |
564,648 | 214,745 | ||||||
| Other Assets |
206,083 | 495,872 | ||||||
| $ | 31,990,725 | $ | 27,853,372 | |||||
| LIABILITIES AND STOCKHOLDERS’ EQUITY |
||||||||
| Current Liabilities |
||||||||
| Accounts payable and accrued liabilities |
$ | 5,268,019 | $ | 4,550,728 | ||||
| Estimated liability for taxes on income |
1,006,816 | 1,071,889 | ||||||
| Dividend payable |
252,444 | 210,599 | ||||||
| Long-term debt–current portion |
1,137,937 | 638,633 | ||||||
| Bank & short-term loans |
459,434 | 679,594 | ||||||
| Convertible debentures |
– | 353,408 | ||||||
| 8,124,650 | 7,504,851 | |||||||
| Convertible Debentures |
321,334 | 415,897 | ||||||
| Other Long-term Debt |
3,372,183 | 3,378,569 | ||||||
| Postretirement Benefits |
2,369,448 | 840,311 | ||||||
| Other Liabilities |
868,818 | 775,975 | ||||||
| 15,056,433 | 12,915,603 | |||||||
| Minority Interest |
71,923 | 61,881 | ||||||
| Stockholders’ Equity |
||||||||
| Common stock |
4,667,999 | 4,136,363 | ||||||
| Income retained for use in the business |
19,890,842 | 15,461,767 | ||||||
| Treasury stock at cost |
(4,795,687 | ) | (3,549,243 | ) | ||||
| Accumulated other comprehensive loss |
(2,900,785 | ) | (1,172,999 | ) | ||||
| 16,862,369 | 14,875,888 | |||||||
| $ | 31,990,725 | $ | 27,853,372 | |||||
See the Notes to Consolidated Financial Statements
36
Table of Contents
Part II, Item 8
SCHLUMBERGER LIMITED AND SUBSIDIARIES
CONSOLIDATED STATEMENT OF CASH FLOWS
| (Stated in thousands) | ||||||||||||
| Year Ended December 31, | 2008 | 2007 | 2006 | |||||||||
| Cash flows from operating activities: |
||||||||||||
| Net Income |
$ | 5,434,801 | $ | 5,176,516 | $ | 3,709,851 | ||||||
| Less: Income from discontinued operations |
(37,850 | ) | – | – | ||||||||
| Adjustments to reconcile net income to net cash provided by operating activities: |
||||||||||||
| Depreciation and amortization1 |
2,268,508 | 1,953,987 | 1,561,410 | |||||||||
| Earnings of companies carried at equity, less dividends received |
(235,409 | ) | (189,127 | ) | (179,084 | ) | ||||||
| Deferred income taxes |
(5,698 | ) | 21,866 | 4,598 | ||||||||
| Stock-based compensation expense |
171,559 | 135,510 | 113,843 | |||||||||
| Provision for losses on accounts receivable |
64,730 | 8,596 | 24,392 | |||||||||
| Other non-cash items |
75,030 | 23,886 | 88,287 | |||||||||
| Change in operating assets and liabilities:2 |
||||||||||||
| Increase in receivables |
(944,294 | ) | (1,016,545 | ) | (860,564 | ) | ||||||
| Increase in inventories |
(299,142 | ) | (356,294 | ) | (222,142 | ) | ||||||
| Increase in other current assets |
(198,373 | ) | (92,442 | ) | (94,612 | ) | ||||||
| Increase in accounts payable and accrued liabilities |
683,202 | 502,417 | 417,941 | |||||||||
| (Decrease) increase in estimated liability for taxes on income |
(94,254 | ) | 328,448 | 162,893 | ||||||||
| (Decrease) increase in postretirement benefits |
(193,554 | ) | (135,763 | ) | 5,827 | |||||||
| Increase (decrease) in other liabilities |
97,407 | 16,321 | (4,544 | ) | ||||||||
| Other—net |
111,019 | (90,507 | ) | 17,358 | ||||||||
| NET CASH PROVIDED BY OPERATING ACTIVITIES |
6,897,682 | 6,286,869 | 4,745,454 | |||||||||
| Cash flows from investing activities: |
||||||||||||
| Capital expenditures |
(3,722,976 | ) | (2,931,366 | ) | (2,457,093 | ) | ||||||
| Multiclient seismic data capitalized |
(345,208 | ) | (259,675 | ) | (179,623 | ) | ||||||
| Capitalization of intangible assets |
– | – | (10,714 | ) | ||||||||
| Acquisition of Eastern Echo, net of cash acquired |
– | (837,684 | ) | – | ||||||||
| Acquisition of minority interest in WesternGeco |
– | – | (2,406,331 | ) | ||||||||
| Other business acquisitions, net of cash acquired |
(345,164 | ) | (281,006 | ) | (584,097 | ) | ||||||
| (Purchase) sale of investments, net |
(597,985 | ) | (88,815 | ) | 700,986 | |||||||
| Other |
(131,222 | ) | (229,681 | ) | (123,904 | ) | ||||||
| NET CASH USED IN INVESTING ACTIVITIES |
(5,142,555 | ) | (4,628,227 | ) | (5,060,776 | ) | ||||||
| Cash flows from financing activities: |
||||||||||||
| Dividends paid |
(964,140 | ) | (771,350 | ) | (567,673 | ) | ||||||
| Distribution to joint venture partner |
– | – | (59,647 | ) | ||||||||
| Proceeds from employee stock purchase plan |
177,189 | 148,457 | 111,679 | |||||||||
| Proceeds from exercise of stock options |
174,223 | 473,601 | 329,866 | |||||||||
| Stock options windfall tax benefit |
137,491 | 75,231 | 27,883 | |||||||||
| Stock repurchase program |
(1,818,841 | ) | (1,355,000 | ) | (1,067,842 | ) | ||||||
| Proceeds from issuance of long-term debt |
1,281,493 | 455,129 | 1,413,874 | |||||||||
| Repayment of long-term debt |
(601,094 | ) | (584,253 | ) | (91,811 | ) | ||||||
| Net (decrease) increase in short-term debt |
(210,729 | ) | (72,243 | ) | 194,177 | |||||||
| NET CASH (USED IN) PROVIDED BY FINANCING ACTIVITIES |
(1,824,408 | ) | (1,630,428 | ) | 290,506 | |||||||
| Cash flow from discontinued operations—operating activities |
63,382 | – | – | |||||||||
| Net (decrease) increase in cash before translation effect |
(5,899 | ) | 28,214 | (24,816 | ) | |||||||
| Translation effect on cash |
(2,406 | ) | 3,202 | (321 | ) | |||||||
| Cash, beginning of year |
197,233 | 165,817 | 190,954 | |||||||||
| Cash, end of year |
$ | 188,928 | $ | 197,233 | $ | 165,817 | ||||||
| 1. |
Includes multiclient seismic data costs |
| 2. |
Net of the effect of business acquisitions. |
See the Notes to Consolidated Financial Statements
37
Table of Contents
Part II, Item 8
SCHLUMBERGER LIMITED AND SUBSIDIARIES
CONSOLIDATED STATEMENT OF STOCKHOLDERS’ EQUITY
| (Stated in thousands) | ||||||||||||||||||||||||||||
| Common Stock |
Accumulated Other Comprehensive Income (Loss) |
|||||||||||||||||||||||||||
| Issued | In Treasury |
Retained Income |
Marked to Market |
Deferred Employee Benefits Liabilities |
Translation Adjustment |
Comprehensive Income (Loss) |
||||||||||||||||||||||
| Balance, January 1, 2006 |
$ | 2,750,570 | $ | (2,113,276 | ) | $ | 7,999,770 | $ | (17,042 | ) | $ | (291,486 | ) | $ | (736,951 | ) | $ | 2,102,481 | ||||||||||
| Translation adjustment |
$ | (50,862 | ) | $ | (50,862 | ) | ||||||||||||||||||||||
| Derivatives marked to market |
37,754 | 37,754 | ||||||||||||||||||||||||||
| Minimum pension liability |
286,152 | 286,152 | ||||||||||||||||||||||||||
| Tax benefit on minimum pension liability |
(105,860 | ) | (105,860 | ) | ||||||||||||||||||||||||
| Adjustment to initially apply FASB Statement No. 158 |
(489,579 | ) | ||||||||||||||||||||||||||
| Tax benefit on adjustment to initially apply FASB Statement No. 158 |
199,125 | |||||||||||||||||||||||||||
| Shares sold to optionees less shares exchanged |
165,286 | 164,581 | ||||||||||||||||||||||||||
| Shares granted to Directors |
1,852 | 502 | ||||||||||||||||||||||||||
| Proceeds from employee stock plans |
61,912 | 34,457 | ||||||||||||||||||||||||||
| Stock repurchase program |
(1,067,842 | ) | ||||||||||||||||||||||||||
| Acquisition of PetroAlliance |
260,600 | 69,782 | ||||||||||||||||||||||||||
| Stock-based compensation cost |
113,843 | |||||||||||||||||||||||||||
| Shares issued on conversions of debentures |
3 | |||||||||||||||||||||||||||
| Net income |
3,709,851 | 3,709,851 | ||||||||||||||||||||||||||
| Dividends declared ($0.50 per share) |
(591,142 | ) | ||||||||||||||||||||||||||
| Tax benefit on stock options |
27,883 | |||||||||||||||||||||||||||
| Balance, December 31, 2006 |
3,381,946 | (2,911,793 | ) | 11,118,479 | 20,712 | (401,648 | ) | (787,813 | ) | $ | 3,877,035 | |||||||||||||||||
| Translation adjustment |
(33,072 | ) | $ | (33,072 | ) | |||||||||||||||||||||||
| Derivatives marked to market |
10,915 | 10,915 | ||||||||||||||||||||||||||
| Amortization of prior service cost |
(20,327 | ) | (20,327 | ) | ||||||||||||||||||||||||
| Amortization of actuarial net loss |
55,930 | 55,930 | ||||||||||||||||||||||||||
| Unrecognized prior service cost arising in the year |
(32,128 | ) | (32,128 | ) | ||||||||||||||||||||||||
| Actuarial net gains arising in the year |
120,210 | 120,210 | ||||||||||||||||||||||||||
| Deferred taxes |
(105,778 | ) | (105,778 | ) | ||||||||||||||||||||||||
| Shares sold to optionees less shares exchanged |
194,877 | 278,724 | ||||||||||||||||||||||||||
| Shares granted to Directors |
1,021 | 403 | ||||||||||||||||||||||||||
| Proceeds from employee stock plans |
86,588 | 46,039 | ||||||||||||||||||||||||||
| Stock repurchase program |
(1,355,000 | ) | ||||||||||||||||||||||||||
| Stock-based compensation cost |
135,510 | |||||||||||||||||||||||||||
| Shares issued on conversions of debentures |
263,299 | 392,384 | ||||||||||||||||||||||||||
| Other |
(2,109 | ) | ||||||||||||||||||||||||||
| Net income |
5,176,516 | 5,176,516 | ||||||||||||||||||||||||||
| Dividends declared ($0.70 per share) |
(833,228 | ) | ||||||||||||||||||||||||||
| Tax benefit on stock options |
75,231 | |||||||||||||||||||||||||||
| Balance, December 31, 2007 |
4,136,363 | (3,549,243 | ) | 15,461,767 | 31,627 | (383,741 | ) | (820,885 | ) | $ | 5,172,266 | |||||||||||||||||
| Translation adjustment |
(82,180 | ) | $ | (82,180 | ) | |||||||||||||||||||||||
| Derivatives marked to market |
(135,310 | ) | (135,310 | ) | ||||||||||||||||||||||||
| Amortization of prior service cost |
(19,831 | ) | (19,831 | ) | ||||||||||||||||||||||||
| Amortization of actuarial net loss |
34 ,444 | 34 ,444 | ||||||||||||||||||||||||||
| Unrecognized prior service cost arising in the year |
(1,076,711 | ) | (1,076,711 | ) | ||||||||||||||||||||||||
| Actuarial net losses arising in the year |
(724,817 | ) | (724,817 | ) | ||||||||||||||||||||||||
| Deferred taxes |
276,619 | 276,619 | ||||||||||||||||||||||||||
| Shares sold to optionees less shares exchanged |
20,317 | 153,906 | ||||||||||||||||||||||||||
| Shares granted to Directors |
1,156 | 453 | ||||||||||||||||||||||||||
| Proceeds from employee stock plans |
115,393 | 56,776 | ||||||||||||||||||||||||||
| Stock repurchase program |
(1,818,841 | ) | ||||||||||||||||||||||||||
| Stock-based compensation cost |
171,559 | |||||||||||||||||||||||||||
| Shares issued on conversions of debentures |
86,257 | 361,262 | ||||||||||||||||||||||||||
| Other |
(537 | ) | ||||||||||||||||||||||||||
| Net income |
5,434,801 | 5,434,801 | ||||||||||||||||||||||||||
| Dividends declared ($0.84 per share) |
(1,005,726 | ) | ||||||||||||||||||||||||||
| Tax benefit on stock options |
137,491 | |||||||||||||||||||||||||||
| Balance, December 31, 2008 |
$ | 4,667,999 | $ | (4,795,687 | ) | $ | 19,890,842 | $ | (103,683 | ) | $ | (1,894,037 | ) | $ | (903,065 | ) | $ | 3,707,015 | ||||||||||
See the Notes to Consolidated Financial Statements
38
Table of Contents
Part II, Item 8
SCHLUMBERGER LIMITED AND SUBSIDIARIES
SHARES OF COMMON STOCK
| Issued | In Treasury | Shares Outstanding |
||||||
| Balance, January 1, 2006 |
1,334,212,164 | (156,607,946 | ) | 1,177,604,218 | ||||
| Shares sold to optionees less shares exchanged |
– | 11,169,313 | 11,169,313 | |||||
| Shares granted to Directors |
– | 34,000 | 34,000 | |||||
| Employee stock plan |
– | 2,347,586 | 2,347,586 | |||||
| Stock repurchase program |
– | (17,992,700 | ) | (17,992,700 | ) | |||
| Acquisition of PetroAlliance |
– | 4,730,960 | 4,730,960 | |||||
| Shares issued on conversions of debentures |
– | 82 | 82 | |||||
| Balance, December 31, 2006 |
1,334,212,164 | (156,318,705 | ) | 1,177,893,459 | ||||
| Shares sold to optionees less shares exchanged |
– | 13,693,493 | 13,693,493 | |||||
| Shares granted to Directors |
– | 20,000 | 20,000 | |||||
| Employee stock plan |
– | 2,305,594 | 2,305,594 | |||||
| Stock repurchase program |
– | (16,336,138 | ) | (16,336,138 | ) | |||
| Shares issued on conversions of debentures |
– | 18,039,916 | 18,039,916 | |||||
| Balance, December 31, 2007 |
1,334,212,164 | (138,595,840 | ) | 1,195,616,324 | ||||
| Shares sold to optionees less shares exchanged |
– | 5,395,390 | 5,395,390 | |||||
| Shares granted to Directors |
– | 16,000 | 16,000 | |||||
| Vesting of restricted stock |
– | 18,200 | 18,200 | |||||
| Employee stock plan |
– | 1,995,751 | 1,995,751 | |||||
| Stock repurchase program |
– | (21,064,662 | ) | (21,064,662 | ) | |||
| Shares issued on conversions of debentures |
– | 12,123,842 | 12,123,842 | |||||
| Balance, December 31, 2008 |
1,334,212,164 | (140,111,319 | ) | 1,194,100,845 | ||||
See the Notes to Consolidated Financial Statements
39
Table of Contents
Part II, Item 8
Notes to Consolidated Financial Statements
1. Business Description
Schlumberger Limited (Schlumberger N.V., incorporated in the Netherlands Antilles) and its subsidiaries form the world’s leading supplier of technology, integrated project management, and information solutions to customers in the oil and gas industry worldwide. Schlumberger consists of two business segments: Oilfield Services (“OFS”) and WesternGeco. The Oilfield Services segment provides the industry’s widest range of exploration and production services required during the life of an oil and gas reservoir. WesternGeco provides comprehensive worldwide reservoir imaging, monitoring, and development services, with extensive seismic crews and data processing centers as well as a large multiclient seismic library. Services range from 3D and time-lapse (4D) seismic surveys to multi-component surveys for delineating prospects and reservoir management.
2. Summary of Accounting Policies
The Consolidated Financial Statements of Schlumberger Limited (“Schlumberger”) have been prepared in accordance with accounting principles generally accepted in the United States of America.
Principles of Consolidation
The accompanying Consolidated Financial Statements include the accounts of Schlumberger, its wholly-owned subsidiaries, and subsidiaries over which it exercises a controlling financial interest. All significant intercompany transactions and balances have been eliminated. Investments in entities in which Schlumberger does not have a controlling financial interest, but over which it has significant influence are accounted for using the equity method. Schlumberger’s share of the after-tax earnings of equity method investees is included in Interest and other income. Investments in which Schlumberger does not have the ability to exercise significant influence are accounted for using the cost method. Both equity and cost method investments are classified in Investments in Affiliated Companies.
Reclassifications
Certain items from prior years have been reclassified to conform to the current year presentation.
Use of Estimates
The preparation of financial statements in conformity with generally accepted accounting principles requires management to make estimates and assumptions that affect the reported amounts of assets and liabilities, disclosure of contingent assets and liabilities at the date of the financial statements and the reported amounts of revenue and expenses during the reporting period. On an on-going basis, Schlumberger evaluates its estimates, including those related to collectibility of accounts receivable; valuation of inventories and investments; recoverability of goodwill, intangible assets and investments in affiliates; income taxes; multiclient seismic data; contingencies and actuarial assumptions for employee benefit plans. Schlumberger bases its estimates on historical experience and on various other assumptions that are believed to be reasonable under the circumstances, the results of which form the basis for making judgments about the carrying values of assets and liabilities that are not readily apparent from other sources. Actual results may differ from these estimates under different assumptions or conditions.
40
Table of Contents
Part II, Item 8
Revenue Recognition
Oilfield Services
Services and Products Revenue
Schlumberger recognizes revenue for services and products based upon purchase orders, contracts or other persuasive evidence of an arrangement with the customer that include fixed or determinable prices. Revenue is recognized for services when they are rendered and collectibility is reasonably assured. Revenue is recognized for products upon delivery, customer acceptance and when collectibility is reasonably assured.
Software Revenue
Revenue derived from the sale of licenses of Schlumberger software may include installation, maintenance, consulting and training services.
If services are not essential to the functionality of the software, the revenue for each element of the contract is recognized separately based on its respective vendor specific objective evidence of fair value when all of the following conditions are met: a signed contract is obtained, delivery has occurred, the fee is fixed or determinable and collectibility is probable.
If an ongoing vendor obligation exists under the license arrangement, or if any uncertainties with regard to customer acceptance are significant, revenue for the related element is deferred based on its vendor specific objective evidence of fair value. Vendor specific objective evidence of fair value is determined as being the price for the element when sold separately. If vendor specific objective evidence of fair value does not exist for all undelivered elements, all revenue is deferred until sufficient evidence exists or all elements have been delivered.
The percentage of completion method of accounting is applied to contracts whereby software is being customized to a customer’s specifications.
WesternGeco
Revenue from all services is recognized when persuasive evidence of an arrangement exists, the price is fixed or determinable and collectibility is reasonably assured. Revenue from contract services performed on a dayrate basis is recognized as the service is performed. Revenue from other contract services, including pre-funded multiclient surveys, is recognized as the seismic data is acquired and/or processed on a proportionate basis as work is performed. This method requires revenue to be recognized based upon quantifiable measures of progress, such as square kilometers acquired. Multiclient data surveys are licensed or sold to customers on a non-transferable basis. Revenue on completed multiclient data surveys is recognized upon obtaining a signed licensing agreement and providing customers with access to such data.
Multiple Deliverable Arrangements
Revenue in both segments may be generated from contractual arrangements that include multiple deliverables. Revenue from these arrangements is recognized as each item is delivered based on their relative fair value and when the delivered items have stand-alone value to the customer.
Other
Taxes assessed by governmental authorities that are imposed concurrently on specific revenue-producing transaction, such as sales and value added taxes, are excluded from revenue in the Consolidated Statement of Income.
41
Table of Contents
Part II, Item 8
Translation of Non-United States Currencies
The functional currency of Schlumberger is primarily the US dollar. All assets and liabilities recorded in functional currencies other than US dollars are translated at current exchange rates. The resulting adjustments are charged or credited directly to the Stockholders’ Equity section of the Consolidated Balance Sheet. Revenue and expenses are translated at the weighted-average exchange rates for the period. All realized and unrealized transaction gains and losses are included in income in the period in which they occur. Transaction gains, net of hedging activities, of $41 million were recognized in 2008. In 2007 and 2006, the transaction losses net of hedging activities were $17 million and $20 million, respectively.
Investments
The Consolidated Balance Sheet reflects the Schlumberger investment portfolio separated between current and long term, based on maturity. Under normal circumstances it is the intent of Schlumberger to hold the investments until maturity, with the exception of investments that are considered trading (December 31, 2008—$194 million; December 31, 2007—$201 million). Both Short-term investments and Fixed Income Investments, held to maturity are comprised primarily of money market funds, eurodollar time deposits, certificates of deposit, commercial paper, euro notes and Eurobonds, and are substantially denominated in US dollars. They are stated at cost plus accrued interest, which approximates market. Short-term investments that are designated as trading are stated at market. The unrealized gains/losses on investments designated as trading were not significant at both December 31, 2008 and 2007.
For purposes of the Consolidated Statement of Cash Flows, Schlumberger does not consider short-term investments to be cash equivalents as a significant portion of them have original maturities in excess of three months.
Long-term fixed income investments of $470 million mature as follows: $140 million in 2010, $202 million in 2011 and $128 million in 2012.
Inventories
Inventories are stated at average cost or at market, whichever is lower. Inventory consists of materials, supplies and finished goods. Costs included in inventories consist of materials, direct labor and manufacturing overhead.
Fixed Assets and Depreciation
Fixed assets are stated at cost less accumulated depreciation, which is provided for by charges to income over the estimated useful lives of the assets using the straight-line method. Fixed assets include the manufacturing cost of oilfield technical equipment manufactured or assembled by subsidiaries of Schlumberger. Expenditures for replacements and improvements are capitalized. Maintenance and repairs are charged to operating expenses as incurred. Upon sale or other disposition, the applicable amounts of asset cost and accumulated depreciation are removed from the accounts and the net amount, less proceeds from disposal, is charged or credited to income.
Multiclient Seismic Data
The multiclient library consists of completed and in-process seismic surveys that are licensed on a nonexclusive basis. This data may be acquired and/or processed by Schlumberger or subcontractors. Multiclient surveys are primarily generated utilizing Schlumberger resources. Schlumberger capitalizes costs directly incurred in acquiring and processing the multiclient seismic data. Such costs are charged to Cost of goods sold and services based on the percentage of the total costs to the estimated total revenue that
42
Table of Contents
Part II, Item 8
Schlumberger expects to receive from the sales of such data. However, under no circumstance will an individual survey carry a net book value greater than a 4- year straight-line amortized value.
The carrying value of the multiclient library is reviewed for impairment annually as well as when an event or change in circumstance indicating impairment may have occurred. Adjustments to the carrying value are recorded when it is determined that estimated future cash flows, which involves significant judgment on the part of Schlumberger, would not be sufficient to recover the carrying value of the surveys. Significant adverse changes in Schlumberger’s estimated future cash flows could result in impairment charges in a future period.
Goodwill, Other Intangibles and Long-lived Assets
Schlumberger records as goodwill the excess of purchase price over the fair value of the tangible and identifiable intangible assets acquired. Statement of Financial Accounting Standards 142, Goodwill and Other Intangible Assets (SFAS 142), requires goodwill to be tested for impairment annually as well as when an event or change in circumstance indicates an impairment may have occurred. Goodwill is tested for impairment by comparing the fair value of Schlumberger’s individual reporting units to their carrying amount to determine if there is a potential goodwill impairment. If the fair value of the reporting unit is less than its carrying value, an impairment loss is recorded to the extent that the implied fair value of the goodwill of the reporting unit is less than its carrying value.
For purposes of performing the impairment test for goodwill as required by SFAS 142, the Schlumberger reporting units are primarily the geographic areas comprising the Oilfield Services segment in addition to the WesternGeco segment. Schlumberger estimates the fair value of these reporting units using a discounted cash flow analysis and/or applying various market multiples. Determining the fair value of a reporting unit is a matter of judgment and involves the use of significant estimates and assumptions. Schlumberger’s estimates of the fair value of each of its reporting units were significantly in excess of their respective carrying values for 2008, 2007 and 2006. Schlumberger performs the annual goodwill impairment test of its WesternGeco reporting unit on October 1st of every year while the reporting units comprising the Oilfield Services segment are tested as of December 31st.
Long-lived assets, including fixed assets and intangible assets, are reviewed for impairment whenever events or changes in circumstances indicate that the carrying value may not be recoverable. In reviewing for impairment, the carrying value of such assets is compared to the estimated undiscounted future cash flows expected from the use of the assets and their eventual disposition. If such cash flows are not sufficient to support the asset’s recorded value, an impairment charge is recognized to reduce the carrying value of the long-lived asset to its estimated fair value. The determination of future cash flows as well as the estimated fair value of long-lived assets involve significant estimates on the part of management. If there is a material change in economic conditions or other circumstances influencing the estimate of future cash flows or fair value, Schlumberger could be required to recognize impairment charges in the future.
Schlumberger capitalizes certain costs of internally developed software. Capitalized costs include purchased materials and services, payroll and payroll related costs. The costs of internally developed software are amortized on a straight-line basis over the estimated useful life, which is principally 5 to 7 years. Other intangible assets consist primarily of technology and customer relationships acquired in business combinations. Acquired technology is generally amortized over periods ranging from 5 to 15 years and acquired customer relationships are generally amortized over periods ranging from 7 years to 20 years.
Taxes on Income
Schlumberger and its subsidiaries compute taxes on income in accordance with the tax rules and regulations of the many taxing authorities where the income is earned. The income tax rates imposed by these taxing authorities vary substantially. Taxable income may differ from pretax income for financial accounting purposes. To the extent that differences are due to revenue or expense items reported in one period for tax
43
Table of Contents
Part II, Item 8
purposes and in another period for financial accounting purposes, an appropriate provision for deferred income taxes is made. Any effect of changes in income tax rates or tax laws are included in the provision for income taxes in the period of enactment. When it is more likely than not that a portion or all of the deferred tax asset will not be realized in the future, Schlumberger provides a corresponding valuation allowance against deferred tax assets.
Schlumberger’s tax filings are subject to regular audit by the tax authorities in most of the jurisdictions in which it conducts business. These audits may result in assessments for additional taxes which are resolved with the authorities or, potentially, through the courts. Tax liabilities are recorded based on estimates of additional taxes which will be due upon the conclusion of these audits. Estimates of these tax liabilities are made based upon prior experience and are updated in light of changes in facts and circumstances. However, due to the uncertain and complex application of tax regulations, it is possible that the ultimate resolution of audits may result in liabilities which could be materially different from these estimates. In such an event, Schlumberger will record additional tax expense or tax benefit in the year in which such resolution occurs.
Approximately $16 billion of consolidated income retained for use in the business on December 31, 2008 represented undistributed earnings of consolidated subsidiaries and Schlumberger’s share of equity method investees. No provision is made for deferred income taxes on those earnings considered to be indefinitely reinvested or earnings that would not be taxed when remitted.
Postretirement Benefits
Effective December 31, 2006, Schlumberger adopted the provisions of SFAS 158, Employer’s Accounting for Defined Benefit Pension and Other Postretirement Plans, an amendment of FASB Statements No. 87, 88, 106 and 132(R) (“SFAS 158”). SFAS 158 required Schlumberger to recognize the funded status (i.e., the difference between the fair value of plan assets and the benefit obligation) of its postretirement benefit plans in its Consolidated Balance Sheet, with a corresponding adjustment to Accumulated Other Comprehensive Income (Loss), net of tax.
Concentration of Credit Risk
Schlumberger’s assets that are exposed to concentrations of credit risk consist primarily of cash, short-term investments, fixed income investments held to maturity, receivables from clients and derivative financial instruments. Schlumberger places its cash, short-term investments and fixed income investments held to maturity with financial institutions and corporations, and limits the amount of credit exposure with any one of them. Schlumberger regularly evaluates the creditworthiness of the issuers in which it invests. The receivables from clients are spread over many countries and customers. Schlumberger maintains an allowance for uncollectible accounts receivable based on expected collectibility and performs ongoing credit evaluations of its customers’ financial condition. By using derivative financial instruments to hedge exposure to changes in exchange rates and, commodity prices, Schlumberger exposes itself to credit risk. Schlumberger minimizes this credit risk by entering into transactions with high-quality counterparties, limiting the exposure to each counterparty and monitoring the financial condition of its counterparties.
Research & Engineering
All research and engineering expenditures are expensed as incurred, including costs relating to patents or rights that may result from such expenditures.
Earnings per Share
Basic earnings per share is calculated by dividing net income by the weighted average number of common shares outstanding during the year. Diluted earnings per share is calculated by first adding back to net income
44
Table of Contents
Part II, Item 8
the interest expense on the convertible debentures and then dividing this adjusted net income by the sum of (i) unvested restricted stock units; and (ii) the weighted average number of common shares outstanding assuming dilution. The weighted average number of common shares outstanding assuming dilution assumes (a) that all stock options which are in the money are exercised at the beginning of the period and that the proceeds are used by Schlumberger to purchase shares at the average market price for the period, and (b) the conversion of the convertible debentures.
The following is a reconciliation from basic earnings per share to diluted earnings per share from continuing operations for each of the last three years:
| (Stated in thousands except per share amounts) | ||||||||
| Income from Continuing Operations |
Weighted Average Shares Outstanding |
Earnings Per Share from Continuing Operations | ||||||
| 2008: |
||||||||
| Basic |
$ | 5,396,951 | 1,196,237 | $ | 4.51 | |||
| Assumed conversion of debentures |
11,517 | 12,979 | ||||||
| Assumed exercise of stock options |
– | 12,958 | ||||||
| Unvested restricted stock |
– | 1,720 | ||||||
| Diluted |
$ | 5,408,468 | 1,223,894 | $ | 4.42 | |||
| 2007: |
||||||||
| Basic |
$ | 5,176,516 | 1,187,944 | $ | 4.36 | |||
| Assumed conversion of debentures |
23,671 | 28,986 | ||||||
| Assumed exercise of stock options |
– | 20,868 | ||||||
| Unvested restricted stock |
– | 877 | ||||||
| Diluted |
$ | 5,200,187 | 1,238,675 | $ | 4.20 | |||
| 2006: |
||||||||
| Basic |
$ | 3,709,851 | 1,181,683 | $ | 3.14 | |||
| Assumed conversion of debentures |
28,788 | 38,210 | ||||||
| Assumed exercise of stock options |
– | 21,874 | ||||||
| Unvested restricted stock |
– | 429 | ||||||
| Diluted |
$ | 3,738,639 | 1,242,196 | $ | 3.01 | |||
Employee stock options to purchase approximately 5.8 million, 0.8 million and 0.6 million shares of common stock at December 31, 2008, 2007 and 2006, respectively, were outstanding but not included in the computation of diluted earnings per share because the option exercise price was greater than the average market price of the common stock, and therefore, the effect on diluted earnings per share would have been anti-dilutive.
Recently Issued Accounting Pronouncements
In December 2007, the Financial Accounting Standards Board (“FASB”) issued SFAS 141 (revised 2007), Business Combinations (“SFAS 141(R)”). SFAS 141(R) establishes principles and requirements for how an acquirer in a business combination recognizes and measures the assets acquired, liabilities assumed, and any noncontrolling interest (previously referred to as minority interest) in the acquiree. The provisions of SFAS 141(R) are effective for business combinations occurring on or after January 1, 2009.
In December 2007, the FASB issued SFAS 160, Noncontrolling Interests in Consolidated Financial Statements, an Amendment of ARB No. 51 (“SFAS 160”). This statement amends ARB 51 to establish accounting and reporting standards for the noncontrolling interest in a subsidiary and for the loss of control of
45
Table of Contents
Part II, Item 8
a subsidiary. Upon its adoption on January 1, 2009, noncontrolling interests will be classified as equity in the Schlumberger financial statements.
SFAS 160 also changes the way the consolidated income statement is presented by requiring net income to include the net income for both the parent and the noncontrolling interest, with disclosure of both amounts on the consolidated statement of income. The calculation of earnings per share will continue to be based on income amounts attributable to the parent. The provisions of this standard must be applied retrospectively upon adoption.
3. Charges and Credits
Schlumberger recorded the following Charges and Credits in 2008, 2007 and 2006:
2008
Fourth quarter 2008:
| · | Due to the continuing slowdown in oil and gas exploration and production spending and its effect on activity in the oilfield services sector, Schlumberger is taking actions to reduce its global workforce. As a result of these actions, Schlumberger recorded a pretax charge of $74 million ($65 million after-tax), which is classified in Cost of goods sold and services in the Consolidated Statement of Income. Depending on how the market situation evolves, further actions may be necessary, which could result in additional charges in future periods. |
| · | Schlumberger wrote off certain assets, primarily accounts receivable relating to one client with liquidity issues. Accordingly, Schlumberger recorded a pretax charge of $42 million ($28 million after-tax and minority interest). $32 million of the pretax charge is classified in Cost of goods sold and services in the Consolidated Statement of Income, with the remaining $10 million classified in Interest and other income, net. |
The following is a summary of 2008 Charges and Credits:
| (Stated in millions) | ||||||||||||||
| Pretax | Tax | Minority Interest |
Net | |||||||||||
| Charges and Credits |
||||||||||||||
| - Workforce reduction |
$ | 74.4 | $ | (9.1 | ) | $ | – | $ | 65.3 | |||||
| - Provision for doubtful accounts |
31.8 | (7.8 | ) | (6.1 | ) | 17.9 | ||||||||
| - Other |
9.8 | – | – | 9.8 | ||||||||||
| $ | 116.0 | $ | (16.9 | ) | $ | (6.1 | ) | $ | 93.0 | |||||
2007
Fourth quarter of 2007:
| · | Schlumberger sold certain workover rigs for $32 million, resulting in a pretax gain of $25 million ($17 million after-tax) which is classified in Interest and other income, net in the Consolidated Statement of Income. |
2006
Second quarter of 2006:
| · | As discussed in further detail in Note 4 Acquisitions, Schlumberger acquired the remaining 30% minority interest in WesternGeco held by Baker Hughes Incorporated for $2.4 billion in cash during |
46
Table of Contents
Part II, Item 8
| the second quarter of 2006. In connection with this transaction, a pretax and after-tax charge of $21 million was recorded, representing the portion of the purchase price that was allocated to in-process research and development. Schlumberger recorded an additional $6 million of in-process research and development charges, primarily related to a small acquisition which was also completed in the second quarter of 2006. These amounts were determined by identifying research and development projects that had not yet reached technological feasibility at the time of the acquisition. These charges are classified in Research & engineering in the Consolidated Statement of Income. |
| · | Schlumberger recorded a pretax and after-tax loss of $9 million relating to the liquidation of certain investments in connection with the funding of the previously mentioned WesternGeco transaction. These losses are classified in Interest and other income, net in the Consolidated Statement of Income. |
| · | In connection with the settlement of a visa matter, a pretax charge of $10 million ($7 million after-tax and minority interest) was recorded in the second quarter of 2006 and is classified in Cost of goods sold and services in the Consolidated Statement of Income. |
The following is a summary of 2006 Charges and Credits:
| (Stated in millions) | |||||||||||||
| Pretax | Tax | Minority Interest |
Net | ||||||||||
| Charges & Credits |
|||||||||||||
| - WesternGeco in-process R&D charge |
$ | 21.0 | $ | – | $ | – | $ | 21.0 | |||||
| - Loss on liquidation of investments to fund |
|||||||||||||
| WesternGeco transaction |
9.4 | – | – | 9.4 | |||||||||
| - WesternGeco visa settlement |
9.7 | 0.3 | (3.2 | ) | 6.8 | ||||||||
| - Other in-process R&D charges |
5.6 | – | – | 5.6 | |||||||||
| $ | 45.7 | $ | 0.3 | $ | (3.2 | ) | $ | 42.8 | |||||
4. Acquisitions
Acquisition of Eastern Echo Holding Plc
On December 10, 2007, Schlumberger completed the acquisition of Eastern Echo Holding Plc (“Eastern Echo”) for $838 million in cash. Eastern Echo was a Dubai-based marine seismic company that did not have any operations at the time of acquisition, but had signed contracts for the construction of six seismic vessels.
The purchase price has been allocated to the net assets acquired based upon their estimated fair values as follows:
| (Stated in millions) | ||||
| Cash and short-term investments |
$ | 266 | ||
| Other current assets |
23 | |||
| Fixed income investments, held to maturity |
54 | |||
| Vessels under construction |
694 | |||
| Accounts payable and accrued liabilities |
(17 | ) | ||
| Long-term debt |
(182 | ) | ||
| Total purchase price |
$ | 838 | ||
47
Table of Contents
Part II, Item 8
Acquisition of WesternGeco Minority Interest
On April 28, 2006, Schlumberger acquired the remaining 30% minority interest in WesternGeco from Baker Hughes Incorporated for $2.4 billion in cash. Schlumberger also incurred direct acquisition costs of $6 million in connection with this transaction. As a result of this transaction, Schlumberger owns 100% of WesternGeco.
The purchase price has been allocated to the proportionate share of net assets acquired based upon their estimated fair values as follows:
| (Stated in millions) | ||||
| Book value of minority interest acquired |
$ | 460 | ||
| Fair value adjustments: | ||||
| Technology |
293 | |||
| Customer relationships |
153 | |||
| Vessels |
84 | |||
| Other fixed assets |
10 | |||
| Multiclient seismic data |
41 | |||
| Other identifiable intangible assets |
49 | |||
| In-process research and development |
21 | |||
| Deferred income taxes |
(43 | ) | ||
| Goodwill |
1,338 | |||
| Total purchase price |
$ | 2,406 | ||
The amount allocated to goodwill represents the excess of the purchase price over the fair value of the net assets acquired. Approximately $0.8 billion of the $1.3 billion of goodwill is tax deductible. In addition, approximately $650 million of the goodwill created as a result of this transaction has been allocated to the Oilfield Services business segment in recognition of the estimated present value of future synergies paid for in this transaction that will directly benefit that segment.
Acquisition of PetroAlliance Minority Interest
On December 9, 2003, Schlumberger announced that it had signed an agreement to acquire PetroAlliance Services Company Limited (“PetroAlliance Services”) over a 3-year period based on a formula determined at that time. During the second quarter of 2006, Schlumberger acquired the remaining 49% of PetroAlliance Services that it did not own for $165 million in cash and 4,730,960 shares of Schlumberger common stock valued at approximately $330 million. This brought the aggregate purchase price paid for PetroAlliance Services over the 3-year period to $650 million.
The $495 million purchase price paid in the second quarter of 2006 has been allocated to the proportionate share of net assets acquired based upon their estimated fair values as follows:
| (Stated in millions) | ||||
| Book value of minority interest acquired |
$ | 33 | ||
| Fair value adjustments: |
||||
| Customer relationships (life of 12 years) |
69 | |||
| Other identifiable intangible assets (life of 5 years) |
7 | |||
| Deferred income taxes |
(18 | ) | ||
| Goodwill |
404 | |||
| Total purchase price |
$ | 495 | ||
The amount allocated to goodwill represents the excess of the purchase price over the fair value of the net assets acquired. The goodwill is not tax deductible.
48
Table of Contents
Part II, Item 8
Other Acquisitions
Schlumberger has made other acquisitions and minority interest investments, none of which were significant on an individual basis, for cash payments of $345 million during 2008, $306 million during 2007, and $356 million during 2006.
Under the terms of certain acquisitions, Schlumberger has obligations to pay additional consideration if specific conditions were met. Schlumberger made cash payments of $63 million during 2006 with respect to certain transactions that were consummated in prior years, which were recorded as additional goodwill.
Pro forma results pertaining to the above acquisitions, including the WesternGeco and PetroAlliance Services transactions, are not presented as the impact was not significant.
5. Investments in Affiliated Companies
The MI-SWACO drilling fluids joint venture is owned 40% by Schlumberger and 60% by Smith International, Inc. Schlumberger records income relating to this venture using the equity method of accounting. Schlumberger’s investment in the joint venture on December 31, 2008 and 2007 was $1.3 billion and $1.2 billion, respectively. Schlumberger’s equity income from this joint venture in 2008 was $210 million, $174 million in 2007 and $135 million in 2006. Schlumberger received cash distributions from the joint venture of $57 million in 2008 and $40 million in 2007. There were no such distributions in 2006.
Schlumberger’s joint venture agreement with Smith International, Inc. contains a provision under which either party to the joint venture may offer to sell its entire interest in the venture to the other party at a cash purchase price per percentage interest specified in an offer notice. If the offer to sell is not accepted, the offering party will be obligated to purchase the entire interest of the other party at the same price per percentage interest as the prices specified in the offer notice.
6. Inventory
A summary of inventory follows:
| (Stated in millions) | ||||||
| As at December 31, | 2008 | 2007 | ||||
| Raw materials & field materials |
$ | 1,674 | $ | 1,359 | ||
| Work in process |
136 | 145 | ||||
| Finished goods |
109 | 134 | ||||
| $ | 1,919 | $ | 1,638 | |||
7. Fixed Assets
A summary of fixed assets follows:
| (Stated in millions) | ||||||
| As at December 31, | 2008 | 2007 | ||||
| Land |
$ | 119 | $ | 78 | ||
| Buildings & improvements |
1,611 | 1,365 | ||||
| Machinery & equipment |
16,593 | 14,431 | ||||
| Seismic vessels and related equipment |
722 | 690 | ||||
| Seismic vessels under construction |
1,107 | 781 | ||||
| 20,152 | 17,345 | |||||
| Less accumulated depreciation |
10,462 | 9,337 | ||||
| $ | 9,690 | $ | 8,008 | |||
49
Table of Contents
Part II, Item 8
The estimated useful lives of Buildings & improvements are primarily 30 to 40 years. The estimated useful lives of Machinery & equipment range from 2 years to 10 years, with 90% being depreciated over 5 to 10 years (determined on a gross book value basis). Seismic vessels are depreciated over periods ranging from 20 to 30 years with the related equipment generally depreciated over 5 years.
Depreciation and amortization expense relating to fixed assets was $1.9 billion, $1.5 billion and $1.2 billion in 2008, 2007 and 2006, respectively.
8. Multiclient Seismic Data
The change in the carrying amount of multiclient seismic data is as follows:
| (Stated in millions) | ||||||||
| 2008 | 2007 | |||||||
| Balance at beginning of year |
$ | 182 | $ | 227 | ||||
| Capitalized in year |
345 | 260 | ||||||
| Charged to cost of goods sold & services |
(240 | ) | (305 | ) | ||||
| $ | 287 | $ | 182 | |||||
9. Goodwill
The changes in the carrying amount of goodwill by business segment in 2008 were as follows:
| (Stated in millions) | |||||||||||
| Oilfield Services |
Western Geco |
Total | |||||||||
| Balance at December 31, 2007 |
$ | 4,185 | $ | 957 | $ | 5,142 | |||||
| Additions |
49 | 58 | 107 | ||||||||
| Impact of change in exchange rates |
(60 | ) | – | (60 | ) | ||||||
| Balance at December 31, 2008 |
$ | 4,174 | $ | 1,015 | $ | 5,189 | |||||
The changes in the carrying amount of goodwill by business segment in 2007 were as follows:
| (Stated in millions) | |||||||||
| Oilfield Services |
Western Geco |
Total | |||||||
| Balance at December 31, 2006 |
$ | 4,049 | $ | 940 | $ | 4,989 | |||
| Additions |
129 | 17 | 146 | ||||||
| Impact of change in exchange rates |
7 | – | 7 | ||||||
| Balance at December 31, 2007 |
$ | 4,185 | $ | 957 | $ | 5,142 | |||
10. Intangible Assets
Intangible assets principally comprise software, technology and customer relationships. At December 31, the gross book value and accumulated amortization of intangible assets were as follows:
| (Stated in millions) | ||||||||||||||||||
| 2008 |
2007 | |||||||||||||||||
| Gross Book Value |
Accumulated Amortization |
Net Book Value |
Gross Book Value |
Accumulated Amortization |
Net Book Value | |||||||||||||
| Software |
$ | 337 | $ | 233 | $ | 104 | $ | 341 | $ | 204 | $ | 137 | ||||||
| Technology |
465 | 117 | 348 | 437 | 89 | 348 | ||||||||||||
| Customer Relationships |
345 | 56 | 289 | 354 | 34 | 320 | ||||||||||||
| Other |
124 | 45 | 79 | 128 | 30 | 98 | ||||||||||||
| $ | 1,271 | $ | 451 | $ | 820 | $ | 1,260 | $ | 357 | $ | 903 | |||||||
50
Table of Contents
Part II, Item 8
Amortization expense was $124 million in 2008, $124 million in 2007 and $113 million in 2006.
The weighted average amortization period for all intangible assets is approximately 12 years.
Amortization expense for the subsequent five years is estimated to be as follows: 2009 – $113 million, 2010 – $100 million, 2011 – $91 million, 2012 – $85 million and 2013 – $66 million.
11. Long-term Debt and Debt Facility Agreements
Series A Convertible Debentures
During 2003, Schlumberger Limited issued $975 million aggregate principal amount of 1.5% Series A Convertible Debentures due June 1, 2023. The Series A debentures were convertible, at the holders’ option, into shares of common stock of Schlumberger Limited at a conversion rate of 27.651 shares for each $1,000 of principal amount (equivalent to an initial conversion price of $36.165 per share).
During 2007, $622 million of the Series A debentures were converted into 17.2 million shares of Schlumberger common stock. During 2008, all of the remaining $353 million of outstanding Series A debentures were converted into 9.8 million shares of Schlumberger common stock.
Series B Convertible Debentures
During 2003, Schlumberger Limited issued $450 million aggregate principal amount of 2.125% Series B Convertible Debentures due June 1, 2023. The Series B debentures are convertible, at the holders’ option, into shares of common stock of Schlumberger Limited. Holders of the Series B debentures may convert their debentures into common stock at a conversion rate of 25.000 shares for each $1,000 of principal (equivalent to an initial conversion price of $40.00 per share). The conversion rate may be adjusted for certain events, but it will not be adjusted for accrued interest.
On or after June 6, 2010, Schlumberger may redeem for cash all or part of the debentures, upon notice to the holders, at the redemption prices of 100% of the principal amount of the debentures, plus accrued and unpaid interest to the date of redemption. On June 1, 2010, June 1, 2013 and June 1, 2018, holders may require Schlumberger to repurchase their Series B debentures. The repurchase price will be 100% of the principal amount of the debentures plus accrued and unpaid interest to the repurchase date. The repurchase price for repurchases on June 1, 2010 will be paid in cash. On the other repurchase dates, Schlumberger may choose to pay the repurchase price in cash or common stock or any combination of cash and common stock. In addition, upon the occurrence of a Fundamental Change (defined as a change in control or a termination of trading of Schlumberger’s common stock), holders may require Schlumberger to repurchase all or a portion of their debentures for an amount equal to 100% of the principal amount of the debentures plus accrued and unpaid interest to the repurchase date. The repurchase price may be paid in cash, Schlumberger common stock (or if Schlumberger is not the surviving entity in a merger, the securities of the surviving entity) or a combination of cash and the applicable securities, at Schlumberger’s option. The applicable securities will be valued at 99% of their market price.
Schlumberger’s option to pay the repurchase price with securities is subject to certain conditions. The debentures will mature on June 1, 2023 unless earlier redeemed or repurchased.
During 2008 and 2007, $95 million and $34 million of the Series B debentures were converted into 2.4 million and 0.9 million shares of Schlumberger common stock, respectively.
At December 31, 2008, there were $321 million of the Series B debentures outstanding. The fair value of the Series B debentures at December 31, 2008 was $398 million.
51
Table of Contents
Part II, Item 8
Other Long-Term Debt
A summary of other long-term debt by currency, analyzed by Bonds and Notes, Commercial Paper (CP) and Other, at December 31 follows. As described in further detail below, the currencies are presented after taking into account currency swaps entered into on the date of issuance until maturity.
| (Stated in millions) | ||||||||||||||||||||||||
| 2008 |
2007 | |||||||||||||||||||||||
| Bonds and Notes |
CP | Other | Total | Bonds and Notes |
CP | Other | Total | |||||||||||||||||
| US dollar |
$ | 1,361 | $ | 525 | $ | 188 | $ | 2,074 | $ | 1,420 | $ | 522 | $ | 207 | $ | 2,149 | ||||||||
| Euro |
355 | – | 106 | 461 | 372 | – | 69 | 441 | ||||||||||||||||
| Pound sterling |
– | 246 | 46 | 292 | – | 166 | – | 166 | ||||||||||||||||
| Canadian dollar |
203 | – | – | 203 | 255 | – | – | 255 | ||||||||||||||||
| Norwegian kroner |
– | – | 342 | 342 | – | – | 368 | 368 | ||||||||||||||||
| $ | 1,919 | $ | 771 | $ | 682 | $ | 3,372 | $ | 2,047 | $ | 688 | $ | 644 | $ | 3,379 | |||||||||
Bonds and Notes consist of the following at December 31,
| (Stated in millions) | ||||||
| 2008 | 2007 | |||||
| 6.5% Notes due 2012 |
$ | 647 | $ | 647 | ||
| 5.25% Guaranteed Notes due 2013 |
714 | – | ||||
| 5.875% Guaranteed Bonds due 2011 |
355 | 372 | ||||
| 5.14% Guaranteed Notes due 2010 |
203 | 255 | ||||
| Guaranteed Floating Rate Notes due 2009 |
– | 591 | ||||
| 10.875% Senior Secured Bonds due 2012 |
– | 182 | ||||
| $ | 1,919 | $ | 2,047 | |||
The fair value of the $647 million of Schlumberger Technology Corporation 6.5% Notes due 2012 was $651 million at December 31, 2008.
In September 2008, Schlumberger Finance B.V. issued €500 million 5.25% Guaranteed Notes due 2013. Schlumberger entered into agreements to swap these Euro notes for US dollars on the date of issue until maturity, effectively making this a US dollar denominated debt on which Schlumberger Finance B.V. will pay interest in US dollars at a rate of 4.74%. The fair value of these Notes was $731 million at December 31, 2008.
The fair value of the $355 million of Schlumberger SA euro denominated 5.875% Guaranteed Bonds due 2011 was $390 million at December 31, 2008.
The fair value of the $203 million of Schlumberger Canada Limited 5.14% Guaranteed Notes due 2010, which are Canadian dollar denominated, was $209 million at December 31, 2008.
In September 2006, Schlumberger Finance B.V. issued €400 million Guaranteed Floating Rate Notes due 2009. At December 31, 2008 these Notes are classified within Long-term debt – current portion in the Consolidated Balance Sheet.
In connection with the Eastern Echo acquisition (see Note 4, Acquisitions), Schlumberger assumed 10.875% Senior Secured Bonds due May 2012 with par value of $160 million. The fair value of these bonds at the time of the acquisition was approximately $182 million. These bonds were redeemed by Schlumberger during the second quarter of 2008.
Commercial paper borrowings outstanding at December 31, 2008 and 2007 include certain notes issued in currencies other than the US dollar which were swapped for US dollars and pounds sterling on the date of issue until maturity. Commercial paper borrowings are classified as long-term debt to the extent of their backup by available and unused committed credit facilities maturing in more than one year and to the extent it is Schlumberger’s intent to maintain these obligations for longer than one year.
52
Table of Contents
Part II, Item 8
On December 31, 2008, wholly-owned subsidiaries of Schlumberger had separate committed debt facility agreements aggregating $3.9 billion with commercial banks, of which $1.8 billion was available and unused. This included $2.5 billion of committed facilities which support commercial paper programs in the United States and Europe, and mature in April 2012. Interest rates and other terms of borrowing under these lines of credit vary from country to country. Borrowings under the commercial paper programs at December 31, 2008 were $1.1 billion, of which $0.4 billion was classified within Long-term debt – current portion in the Consolidated Balance Sheet due to Schlumberger’s current intent to repay such amount in 2009.
The weighted average interest rate on variable rate debt as of December 31, 2008 was 4.5%.
Other Long-term Debt as of December 31, 2008, which excludes the Series B debentures, is due as follows: $447 million in 2010, $777 million in 2011, $1.418 billion in 2012 and $730 million in 2013.
12. Derivative Instruments and Hedging Activities
Schlumberger is subject to market risks primarily associated with changes in foreign currency exchange rates, commodity prices and interest rates. To mitigate these risks, Schlumberger utilizes derivative instruments. Schlumberger does not enter into derivatives for speculative purposes.
Foreign Currency Exchange Rate Risk
As a multinational company, Schlumberger conducts its business in approximately 80 countries. Schlumberger’s functional currency is primarily the US dollar, which is consistent with the oil and gas industry. Approximately 80% of Schlumberger’s revenue in 2008 was denominated in US dollars. However, outside the United States, a significant portion of Schlumberger’s expenses is incurred in foreign currencies. Therefore, when the US dollar weakens in relation to the foreign currencies of the countries in which Schlumberger conducts business, the US dollar – reported expenses will increase.
Schlumberger is exposed to risks on future cash flows to the extent that local currency expenses exceed revenues denominated in local currency that are other than the functional currency. Schlumberger uses foreign currency forward contracts and foreign currency options to provide a hedge against a portion of these cash flow risks. These contracts are accounted for as cash flow hedges under the provisions of SFAS No. 133, Accounting for Derivative Instruments and Hedging Activities (SFAS No. 133), with the effective portion of changes in the fair value of the hedge recorded on the Consolidated Balance Sheet and in Other Comprehensive Income (Loss). Amounts recorded in Other Comprehensive Income (Loss) are reclassified into earnings in the same period or periods that the hedged item is recognized in earnings. The ineffective portion of changes in the fair value of the hedged item is recorded directly to earnings.
At December 31, 2008, Schlumberger recognized a cumulative net $104 million loss in Stockholders’ Equity relating to revaluation of foreign currency forward contracts and foreign currency options designated as cash flow hedges at December 31, 2008.
Schlumberger is also exposed to changes in the fair value of assets and liabilities which are denominated in currencies other than the functional currency. Schlumberger uses foreign currency forward contracts and foreign currency options to hedge this exposure as it relates to certain currencies. These contracts are accounted for as fair value hedges under the provisions of SFAS No. 133, with the fair value of the contracts recorded on the Consolidated Balance Sheet and changes in the fair value recognized in the Consolidated Statement of Income along with the change in fair value of the hedged item.
At December 31, 2008, contracts were outstanding for the US dollar equivalent of $4.3 billion in various foreign currencies, the majority of which expire on various dates in 2009.
Commodity Price Risk
Schlumberger is exposed to the impact of market fluctuations in the price of commodities, such as copper and lead. Schlumberger has entered into forward contracts on these commodities to manage the price risk
53
Table of Contents
Part II, Item 8
associated with forecasted purchases. The objective of these contracts is to reduce the variability of cash flows associated with the forecasted purchase of those commodities These contracts do not qualify for hedge accounting treatment under the provisions of SFAS No. 133 and therefore, changes in the fair value of the forward contracts are recorded directly to earnings.
Interest Rate Risk
Schlumberger is subject to interest rate risk on its debt and its investment portfolio. Schlumberger maintains an interest rate risk management strategy that generally does not involve derivatives and instead primarily uses a mix of variable and fixed rate debt combined with its investment portfolio to mitigate the exposure to changes in interest rates. At December 31, 2008, Schlumberger had fixed rate debt aggregating approximately $2.2 billion and variable rate debt aggregating approximately $3.1 billion.
Schlumberger’s exposure to interest rate risk associated with its debt is also partially mitigated by its investment portfolio. Both Short-term investments and Fixed income investments, held to maturity, which totaled approximately $4.0 billion at December 31, 2008, are comprised primarily of money market funds, eurodollar time deposits, certificates of deposit, commercial paper, euro notes and Eurobonds and are substantially all denominated in US dollars.
The following tables detail the effect of derivatives on the financial position and performance of Schlumberger:
Fair Values of Derivative Instruments
| (Stated in millions) | ||||||
| As at December 31, | Fair Value | |||||
| Asset Derivatives |
Liability Derivatives | |||||
| Derivatives designated as hedging instruments under SFAS No. 133 | 2008 | 2008 | ||||
| Foreign exchange contracts |
$ | – | $ | 102 | ||
| Derivatives not designated as hedging instruments under SFAS No. 133 | ||||||
| Commodity contracts |
$ | – | $ | 5 | ||
| Total derivatives |
$ | – | $ | 107 | ||
The fair value of all outstanding derivatives are determined using a model with inputs that are observable in the market or can be derived from or corroborated by observable data, and are included in Accounts payable and accrued liabilities on the Consolidated Balance Sheet.
The effect of Derivative Instruments on the Consolidated Statement of Income
| (Stated in millions) | ||||||
| For the year ended December 31, | ||||||
| Derivatives in SFAS No. 133 Fair Value Hedging Relationships | Location of Gain or (Loss) recognized | Gain (Loss) 2008 |
||||
| Foreign exchange contracts |
Cost of goods sold and services | $ | (122 | ) | ||
54
Table of Contents
Part II, Item 8
| Derivatives in SFAS No. 133 Cash Flow Hedging Relationships | Gain or (Loss) recognized in OCI on Derivatives 2008 |
Location of Gain or (Loss) reclassified from Accumulated OCI into Income |
Gain (Loss) 2008 |
|||||||
| Foreign exchange contracts |
$ | (149 | ) | Cost of goods sold and services | $ | (19 | ) | |||
| Research & engineering | 5 | |||||||||
| $ | (14 | ) | ||||||||
| Derivatives not designated as hedging instruments under SFAS 133 | Gain (Loss) recognized in Income on Derivatives |
Gain (Loss) recognized in Income on Derivatives 2008 |
||||
| Foreign exchange contracts |
Cost of goods sold and services | $ | (11 | ) | ||
| Commodity contracts |
Cost of goods sold and services | (6 | ) | |||
| $ | (17 | ) | ||||
13. Capital Stock
Schlumberger is authorized to issue 3,000,000,000 shares of common stock, par value $0.01 per share, of which 1,194,100,845 and 1,195,616,324 shares were outstanding on December 31, 2008 and 2007, respectively. Schlumberger is also authorized to issue 200,000,000 shares of preferred stock, par value $0.01 per share, which may be issued in series with terms and conditions determined by the Board of Directors. No shares of preferred stock have been issued. Holders of common stock are entitled to one vote for each share of stock held.
14. Stock Compensation Plans
Schlumberger has three types of stock-based compensation programs: stock options, a restricted stock and restricted stock unit program (collectively referred to as “restricted stock”) and a discounted stock purchase plan (“DSPP”).
Stock Options
Key employees are granted stock options under Schlumberger stock option plans. For all of the stock options granted, the exercise price of each option equals the average of the high and low sales prices of Schlumberger stock on the date of grant; an option’s maximum term is generally ten years, and options generally vest in increments over four or five years. The gain on the awards granted during the period from July 2003 to January 2006 is capped at 125% of the exercise price. Awards granted subsequent to January 2006 do not have a cap on any potential gain and generally vest in increments over five years.
The fair value of each stock option grant was estimated on the date of grant using the Black-Scholes option-pricing model with the following weighted-average assumptions and resulting weighted-average fair value per share:
| 2008 | 2007 | 2006 | ||||||||||
| Dividend yield |
1.0 | % | 1.1 | % | 0.8 | % | ||||||
| Expected volatility |
31 | % | 33 | % | 33 | % | ||||||
| Risk free interest rate |
3.2 | % | 4.7 | % | 4.3 | % | ||||||
| Expected option life |
7.0 years | 6.9 years | 6.1 years | |||||||||
| Weighted-average fair value per share |
$ | 29.33 | $ | 25.94 | $ | 20.03 | ||||||
55
Table of Contents
Part II, Item 8
The following table summarizes information concerning outstanding and exercisable options by five ranges of exercise prices as of December 31, 2008:
| OPTIONS OUTSTANDING |
OPTIONS EXERCISABLE | |||||||||||
| Range of exercise prices |
Number outstanding as of 12/31/08 |
Weighted- average remaining contractual life |
Weighted- average exercise price |
Number as of 12/31/08 |
Weighted- average exercise price | |||||||
| $19.04 - $27.87 |
7,307,406 | 2.99 | $ | 25.91 | 7,307,406 | $ | 25.91 | |||||
| $27.94 - $32.62 |
4,543,384 | 5.22 | $ | 32.26 | 3,312,660 | $ | 32.19 | |||||
| $34.83 - $54.24 |
9,938,296 | 5.89 | $ | 49.53 | 5,745,381 | $ | 47.39 | |||||
| $58.46 - $92.70 |
9,367,481 | 8.45 | $ | 73.03 | 1,078,501 | $ | 63.85 | |||||
| $93.97 - $110.78 |
1,144,750 | 9.26 | $ | 99.94 | 57,200 | $ | 110.78 | |||||
| 32,301,317 | 6.00 | $ | 50.36 | 17,501,148 | $ | 36.76 | ||||||
The weighted average remaining contractual life of stock options exercisable as of December 31, 2008 was 4.32 years.
The following table summarizes stock option activity during the years ended December 31, 2008, 2007 and 2006:
| 2008 |
2007 |
2006 | ||||||||||||||||
| Shares | Weighted- average exercise price |
Shares | Weighted- average exercise price |
Shares | Weighted- average exercise price | |||||||||||||
| Outstanding at beginning of year |
35,718,782 | $ | 41.02 | 48,678,601 | $ | 36.36 | 52,978,806 | $ | 31.39 | |||||||||
| Granted |
5,421,900 | $ | 84.95 | 4,398,500 | $ | 66.48 | 9,055,140 | $ | 55.86 | |||||||||
| Exercised |
(5,443,552 | ) | $ | 32.69 | (13,788,401 | ) | $ | 34.89 | (11,277,006 | ) | $ | 29.89 | ||||||
| Forfeited |
(3,395,813 | ) | $ | 42.68 | (3,569,918 | ) | $ | 31.74 | (2,078,339 | ) | $ | 29.53 | ||||||
| Outstanding at year-end |
32,301,317 | $ | 50.36 | 35,718,782 | $ | 41.02 | 48,678,601 | $ | 36.36 | |||||||||
The aggregate intrinsic value of stock options outstanding as of December 31, 2008 was approximately $175 million. The aggregate intrinsic value of stock options exercisable as of December 31, 2008 was approximately $161 million.
The total intrinsic value of options exercised during the years ended December 31, 2008, 2007 and 2006, was approximately $119 million, $607 million and $366 million, respectively.
Restricted Stock
Schlumberger began granting restricted stock in 2006. Executive officers of Schlumberger may not receive grants of restricted stock unless the grants are subject to performance-based vesting. Restricted stock awards generally vest at the end of three years, with the exception of certain grants which vest over a two-year period with a two-year holding period. There have not been any grants to date that are subject to performance-based vesting.
56
Table of Contents
Part II, Item 8
The following table summarizes information about restricted stock transactions:
| 2008 |
2007 |
2006 | ||||||||||||||||
| Restricted Stock |
Weighted Average Grant Date Fair Value |
Restricted Stock |
Weighted Average Grant Date Fair Value |
Restricted Stock |
Weighted Average Grant Date Fair Value | |||||||||||||
| Unvested at beginning of year |
884,600 | $ | 65.14 | 636,800 | $ | 65.21 | – | $ | – | |||||||||
| Granted |
862,500 | 68.04 | 285,800 | 64.71 | 661,000 | 65.22 | ||||||||||||
| Vested |
(18,200 | ) | 65.35 | – | – | – | – | |||||||||||
| Forfeited |
(28,300 | ) | 72.44 | (38,000 | ) | 63.12 | (24,200 | ) | 65.41 | |||||||||
| Unvested at end of year |
1,700,600 | $ | 66.49 | 884,600 | $ | 65.14 | 636,800 | $ | 65.21 | |||||||||
Discounted Stock Purchase Plan
Under the terms of the DSPP, employees can choose to have a portion of their earnings withheld, subject to certain restrictions, to purchase Schlumberger common stock. The purchase price of the stock is 92.5% of the lower of the stock price at the beginning or end of the plan period at six-month intervals.
The fair value of the employees’ purchase rights under the DSPP was estimated using the Black-Scholes model with the following assumptions and resulting weighted average fair value per share:
| 2008 | 2007 | 2006 | ||||||||||
| Dividend yield |
0.9 | % | 0.9 | % | 1.1 | % | ||||||
| Expected volatility |
34 | % | 34 | % | 25 | % | ||||||
| Risk free interest rate |
2.7 | % | 5.0 | % | 3.9 | % | ||||||
| Weighted average fair value per share |
$ | 17.21 | $ | 11.52 | $ | 6.19 | ||||||
Total Stock-based Compensation Expense
The following summarizes stock-based compensation expense recognized in income:
| (Stated in millions) | |||||||||
| 2008 | 2007 | 2006 | |||||||
| Stock options |
$ | 111 | $ | 94 | $ | 90 | |||
| Restricted stock |
31 | 19 | 9 | ||||||
| DSPP |
30 | 23 | 15 | ||||||
| Total stock-based compensation expense |
$ | 172 | $ | 136 | $ | 114 | |||
As of December 31, 2008, there was $305 million of total unrecognized compensation cost related to nonvested stock-based compensation arrangements. Approximately $128 million is expected to be recognized in 2009, $80 million is expected to be recognized in 2010, $62 million in 2011, $32 million in 2012 and $3 million in 2013.
15. Income Tax Expense
Schlumberger and its subsidiaries operate in more than 100 taxing jurisdictions where statutory tax rates generally vary from 0% to 50%.
57
Table of Contents
Part II, Item 8
Pretax book income subject to United States and non-United States income taxes for each of the three years ended December 31, was as follows:
| (Stated in millions) | |||||||||
| 2008 | 2007 | 2006 | |||||||
| United States |
$ | 1,432 | $ | 1,754 | $ | 1,582 | |||
| Outside United States |
5,420 | 4,870 | 3,366 | ||||||
| Pretax income |
$ | 6,852 | $ | 6,624 | $ | 4,948 | |||
The components of net deferred tax assets were as follows:
| (Stated in millions) | ||||||||
| 2008 | 2007 | |||||||
| Postretirement benefits, net |
$ | 556 | $ | 249 | ||||
| Multiclient seismic data |
121 | 124 | ||||||
| Intangible assets |
(106 | ) | (97 | ) | ||||
| Other, net |
178 | 121 | ||||||
| $ | 749 | $ | 397 | |||||
The above deferred tax assets at December 31, 2008 and 2007 are net of valuation allowances relating to net operating losses in certain countries of $197 million and $214 million, respectively. The deferred tax assets are also net of valuation allowances relating to a capital loss carryforward of $140 million at December 31, 2008 ($144 million at December 31, 2007) which $124 million expires in 2009 and $16 million expires in 2010, and a foreign tax credit carryforward of $49 million at December 31, 2008 ($55 million at December 31, 2007) of which $2 million expires in 2009, and $47 million expires in years 2010 through 2012.
The components of consolidated income tax expense were as follows:
| (Stated in millions) | ||||||||||||
| 2008 | 2007 | 2006 | ||||||||||
| Current: |
||||||||||||
| United States – Federal |
$ | 453 | $ | 538 | $ | 495 | ||||||
| United States – State |
34 | 54 | 49 | |||||||||
| Outside United States |
949 | 834 | 641 | |||||||||
| $ | 1,436 | $ | 1,426 | $ | 1,185 | |||||||
| Deferred: |
||||||||||||
| United States – Federal |
$ | 23 | $ | (3 | ) | $ | 8 | |||||
| United States – State |
1 | 8 | 12 | |||||||||
| Outside United States |
(12 | ) | 38 | (10 | ) | |||||||
| Valuation allowance |
(18 | ) | (21 | ) | (5 | ) | ||||||
| $ | (6 | ) | $ | 22 | $ | 5 | ||||||
| Consolidated taxes on income |
$ | 1,430 | $ | 1,448 | $ | 1,190 | ||||||
A reconciliation of the United States statutory federal tax rate (35%) to the consolidated effective tax rate is:
| 2008 | 2007 | 2006 | |||||||
| US statutory federal rate |
35 | % | 35 | % | 35 | % | |||
| US state income taxes |
1 | 1 | 1 | ||||||
| Non-US income taxed at different rates |
(13 | ) | (12 | ) | (10 | ) | |||
| Effect of equity method investment |
(1 | ) | (1 | ) | (1 | ) | |||
| Other |
(1 | ) | (1 | ) | (1 | ) | |||
| Effective income tax rate |
21 | % | 22 | % | 24 | % | |||
58
Table of Contents
Part II, Item 8
Schlumberger adopted the provisions of FASB Interpretation No. 48, Accounting for Uncertainty in Income Taxes – an Interpretation of FASB Statement No. 109 (“FIN 48”) on January 1, 2007. This interpretation clarifies the accounting for uncertain tax positions and requires companies to recognize the impact of a tax position in their financial statements, if that position is more likely than not of being sustained on audit, based on the technical merits of the position. The adoption of FIN 48 did not have any impact on the total liabilities or stockholders’ equity of Schlumberger.
A reconciliation of the beginning and ending amount of liabilities associated with uncertain tax positions for the years ended December 31, 2008 and 2007 is as follows:
| 2008 | 2007 | |||||||
| Balance at beginning of year |
$ | 858 | $ | 730 | ||||
| Additions based on tax positions related to the current year |
223 | 187 | ||||||
| Additions for tax positions of prior years |
19 | 16 | ||||||
| Impact of changes in exchange rates |
(72 | ) | 21 | |||||
| Settlements with tax authorities |
(20 | ) | (8 | ) | ||||
| Reductions for tax positions of prior years |
(111 | ) | (55 | ) | ||||
| Reductions due to the lapse of the applicable statute of limitations |
(20 | ) | (33 | ) | ||||
| Balance at end of year |
$ | 877 | $ | 858 | ||||
Included in the Schlumberger Consolidated Balance Sheet at December 31, 2008 is approximately $877 million of liabilities associated with uncertain tax positions in the over 100 jurisdictions in which Schlumberger conducts business, a number of which have tax laws that are not fully defined and are evolving. This amount excludes $136 million of accrued interest and penalties. All of the unrecognized tax benefits, if recognized, would impact the Schlumberger effective tax rate.
Schlumberger classifies interest and penalties relating to uncertain tax positions within Taxes on income in the Consolidated Statement of Income. During 2008 and 2007, Schlumberger recognized approximately $25 million and $36 million in interest and penalties, respectively.
The following table summarizes the tax years that are either currently under audit or remain open and subject to examination by the tax authorities in the most significant jurisdictions in which Schlumberger operates:
| Canada |
2002 – 2008 | |
| Mexico |
2003 – 2008 | |
| Russia |
2004 – 2008 | |
| Saudi Arabia |
2001 – 2008 | |
| United Kingdom |
2005 – 2008 | |
| United States |
2005 – 2008 |
In certain of the jurisdictions noted above, Schlumberger operates through more than one legal entity, each of which has different open years subject to examination. The table above presents the open years subject to examination for the most material of the legal entities in each jurisdiction. Additionally, it is important to note that tax years are technically not closed until the statute of limitations in each jurisdiction expires. In the jurisdictions noted above, the statute of limitations can extend beyond the open years subject to examination.
Due to the geographic breadth of the Schlumberger operations, numerous tax audits may be ongoing throughout the world at any point in time. Tax liabilities are recorded based on estimates of additional taxes which will be due upon the conclusion of these audits. Estimates of these tax liabilities are made based upon prior experience and are updated in light of changes in facts and circumstances. However, due to the uncertain and complex application of tax regulations, it is possible that the ultimate resolution of audits may result in liabilities which could be materially different from these estimates. In such an event, Schlumberger will record additional tax expense or tax benefit in the period in which such resolution occurs.
59
Table of Contents
Part II, Item 8
16. Leases and Lease Commitments
Total rental expense was $1.1 billion in 2008, $913 million in 2007, and $686 million in 2006. Future minimum rental commitments under noncancelable operating leases for each of the next five years are as follows:
| (Stated in millions) | |||
| 2009 |
$ | 293 | |
| 2010 |
184 | ||
| 2011 |
134 | ||
| 2012 |
94 | ||
| 2013 |
62 | ||
| Thereafter |
258 | ||
| $ | 1,025 | ||
17. Contingencies
In July 2007, Schlumberger received an inquiry from the United States Department of Justice (“DOJ”) related to the DOJ’s investigation of whether certain freight forwarding and customs clearance services of Panalpina, Inc., and other companies provided to oil and oilfield service companies, including Schlumberger, violated the Foreign Corrupt Practices Act. Schlumberger is cooperating with the DOJ and is conducting its own investigation with respect to these services.
Schlumberger and its subsidiaries are party to various legal proceedings from time to time. A liability is accrued when a loss is both probable and can be reasonably estimated. At this time the ultimate disposition of these proceedings is not determinable and therefore, it is not possible to estimate the amount of loss or range of possible losses that might result from an adverse judgment or settlement in any of these matters. However, in the opinion of management, any liability that might ensue would not be material in relation to Schlumberger’s consolidated liquidity, financial position or future results of operations.
18. Segment Information
Schlumberger operates two business segments: Oilfield Services and WesternGeco.
The Oilfield Services segment falls into four clearly defined economic and geographical areas and is evaluated on the following basis: North America is a major self-contained market; Latin America comprises regional markets that share a common dependence on the oil and gas industry; Europe is a major self-contained market that includes the CIS and Africa, whose economy is increasingly linked to that of Europe; Middle East & Asia includes the remainder of the Eastern Hemisphere, which consists of many countries at different stages of economic development that share a common dependence on the oil and gas industry. The Oilfield Services segment provides virtually all exploration and production services required during the life of an oil and gas reservoir.
The WesternGeco segment provides comprehensive worldwide reservoir imaging, monitoring, and development services, with extensive seismic crews and data processing centers, as well as a large multiclient seismic library. Services range from 3D and time-lapse (4D) seismic surveys to multi-component surveys for delineating prospects and reservoir management.
60
Table of Contents
Part II, Item 8
Financial information for the years ended December 31, 2008, 2007 and 2006, by segment, is as follows:
| (Stated in millions) | ||||||||||||||||||||||||||||||
| 2008 |
||||||||||||||||||||||||||||||
| Revenue | Income after tax & Min. Int. |
Minority Interest |
Tax Expense |
Income before tax & Min. Int. |
Assets | Depn. & Amortn. |
Capital Expenditure |
|||||||||||||||||||||||
| OFS |
||||||||||||||||||||||||||||||
| North America |
$ | 5,914 | $ | 922 | $ | – | $ | 449 | $ | 1,371 | $ | 3,229 | $ | 433 | $ | 750 | ||||||||||||||
| Latin America |
4,230 | 687 | – | 171 | 858 | 2,804 | 223 | 414 | ||||||||||||||||||||||
| Europe/CIS/Africa |
8,180 | 1,813 | 28 | 403 | 2,244 | 4,634 | 600 | 988 | ||||||||||||||||||||||
| Middle East & Asia |
5,724 | 1,796 | – | 209 | 2,005 | 3,741 | 496 | 762 | ||||||||||||||||||||||
| Elims/Other |
234 | (29 | ) | 1 | 55 | 27 | 3,689 | (9 | ) | 128 | ||||||||||||||||||||
| 24,282 | 5,189 | 29 | 1,287 | 6,505 | 18,097 | 1,743 | 3,042 | |||||||||||||||||||||||
| WESTERNGECO |
2,838 | 586 | 3 | 247 | 836 | 3,274 | 518 | 680 | ||||||||||||||||||||||
| Corporate items and eliminations |
43 | (157 | ) | (7 | ) | (104 | ) | (268 | ) | 4,611 | 8 | 1 | ||||||||||||||||||
| Goodwill and Intangible assets |
6,009 | |||||||||||||||||||||||||||||
| $ | 27,163 | $ | 5,618 | $ | 25 | $ | 1,430 | $ | 31,991 | $ | 2,269 | $ | 3,723 | |||||||||||||||||
| Interest income |
112 | |||||||||||||||||||||||||||||
| Interest expense |
(217 | ) | ||||||||||||||||||||||||||||
| Charges & credits |
(116 | ) | ||||||||||||||||||||||||||||
| $ | 6,852 | |||||||||||||||||||||||||||||
| (Stated in millions) | ||||||||||||||||||||||||||||||
| 2007 |
||||||||||||||||||||||||||||||
| Revenue | Income after tax & Min. Int. |
Minority Interest |
Tax Expense |
Income before tax & Min. Int. |
Assets | Depn. & Amortn. |
Capital Expenditure |
|||||||||||||||||||||||
| OFS |
||||||||||||||||||||||||||||||
| North America |
$ | 5,345 | $ | 1,040 | $ | – | $ | 497 | $ | 1,537 | $ | 2,841 | $ | 367 | $ | 591 | ||||||||||||||
| Latin America |
3,295 | 616 | – | 139 | 755 | 2,123 | 185 | 292 | ||||||||||||||||||||||
| Europe/CIS/Africa |
6,602 | 1,559 | – | 326 | 1,885 | 3,727 | 451 | 920 | ||||||||||||||||||||||
| Middle East & Asia |
4,869 | 1,522 | – | 185 | 1,707 | 3,078 | 393 | 772 | ||||||||||||||||||||||
| Elims/Other |
195 | 23 | – | 52 | 75 | 3,022 | 5 | (18 | ) | |||||||||||||||||||||
| 20,306 | 4,760 | – | 1,199 | 5,959 | 14,791 | 1,401 | 2,557 | |||||||||||||||||||||||
| WESTERNGECO |
2,963 | 766 | 1 | 293 | 1,060 | 3,036 | 546 | 359 | ||||||||||||||||||||||
| Corporate items and eliminations |
8 | (267 | ) | (1 | ) | (44 | ) | (312 | ) | 3,981 | 7 | 15 | ||||||||||||||||||
| Goodwill and Intangible assets |
6,045 | |||||||||||||||||||||||||||||
| $ | 23,277 | $ | 5,259 | $ | – | $ | 1,448 | $ | 27,853 | $ | 1,954 | $ | 2,931 | |||||||||||||||||
| Interest income |
160 | |||||||||||||||||||||||||||||
| Interest expense |
(268 | ) | ||||||||||||||||||||||||||||
| Charges & credits |
25 | |||||||||||||||||||||||||||||
| $ | 6,624 | |||||||||||||||||||||||||||||
61
Table of Contents
Part II, Item 8
| (Stated in millions) | ||||||||||||||||||||||||||||
| 2006 | ||||||||||||||||||||||||||||
| Revenue | Income after tax |
Minority Interest |
Tax Expense |
Income before tax & Min. Int. |
Assets | Depn. & Amortn. |
Capital Expenditure | |||||||||||||||||||||
| OFS |
||||||||||||||||||||||||||||
| North America |
$ | 5,273 | $ | 1,053 | $ | – | $ | 551 | $ | 1,604 | $ | 2,577 | $ | 310 | $ | 623 | ||||||||||||
| Latin America |
2,563 | 403 | – | 92 | 495 | 1,487 | 151 | 233 | ||||||||||||||||||||
| Europe/CIS/Africa |
5,057 | 1,075 | 2 | 215 | 1,292 | 2,731 | 343 | 579 | ||||||||||||||||||||
| Middle East & Asia |
3,721 | 1,070 | – | 124 | 1,194 | 2,392 | 308 | 610 | ||||||||||||||||||||
| Elims/Other |
148 | 33 | – | 26 | 59 | 2,591 | 18 | 44 | ||||||||||||||||||||
| 16,762 | 3,634 | 2 | 1,008 | 4,644 | 11,778 | 1,130 | 2,089 | |||||||||||||||||||||
| WESTERNGECO |
2,476 | 527 | 42 | 243 | 812 | 1,770 | 425 | 351 | ||||||||||||||||||||
| Corporate items and eliminations |
(8 | ) | (290 | ) | 5 | (61 | ) | (346 | ) | 3,388 | 6 | 17 | ||||||||||||||||
| Goodwill and Intangible assets |
5,896 | |||||||||||||||||||||||||||
| $ | 19,230 | $ | 3,871 | $ | 49 | $ | 1,190 | $ | 22,832 | $ | 1,561 | $ | 2,457 | |||||||||||||||
| Interest income |
113 | |||||||||||||||||||||||||||
| Interest expense |
(229 | ) | ||||||||||||||||||||||||||
| Charges & credits |
(46 | ) | ||||||||||||||||||||||||||
| $ | 4,948 | |||||||||||||||||||||||||||
Oilfield Services Elims/Other include certain headquarters administrative costs which are not allocated geographically, manufacturing and certain other operations, and costs maintained at the Oilfield Services level.
Corporate items, which are not included in the segments’ income, principally comprise nonoperating expenses, such as interest on postretirement medical benefits, stock-based compensation costs and corporate expenses. Corporate assets largely comprise short-term investments and fixed income investments, held to maturity.
During the three years ended December 31, 2008, no single customer exceeded 10% of consolidated revenue.
Schlumberger did not have revenue from third-party customers in its country of domicile during the last three years. Revenue in the United States in 2008, 2007 and 2006 was $5.9 billion, $5.6 billion and $5.2 billion, respectively.
Interest income excludes amounts which are included in the segments’ income (2008 – $7 million: 2007 – $2 million; 2006 – $2 million).
Interest expense excludes amounts which are included in the segments’ income (2008 – $30 million; 2007 – $7 million; 2006 – $6 million).
Depreciation & Amortization includes Multiclient seismic data costs.
Effective January 1, 2008, a component of the Middle East & Asia Area was reallocated to the Europe/CIS/Africa Area. Prior period data has been reclassified to conform to the current organizational structure.
19. Pension and Other Benefit Plans
Pension Plans
Schlumberger and its United States subsidiary sponsor several defined benefit pension plans that cover substantially all U.S. employees hired prior to October 1, 2004. The benefits are based on years of service and compensation, on a career-average pay basis.
62
Table of Contents
Part II, Item 8
In addition to the United States defined benefit pension plans, Schlumberger sponsors several other international defined benefit pension plans. The most significant of these international plans are the International Staff Pension Plan, which was converted from a defined contribution plan to a defined benefit pension plan during the fourth quarter of 2008, and the UK pension plan (collectively, the “International plans”). The International Staff Pension Plan covers certain international employees and is based on years of service and compensation on a career-average pay basis. The UK plan covers employees hired prior to April 1, 1999, and is based on years of service and compensation, on a final salary basis.
The weighted-average assumed discount rate, compensation increases and the expected long-term rate of return on plan assets used to determine the net pension cost for the US and International (“Int’l”) plans were as follows:
| 2008 |
2007 |
2006 |
||||||||||||||||
| US | Int’l | US | Int’l | US | Int’l | |||||||||||||
| Discount rate |
6.50 | % | 5.80 | % | 6.00 | % | 5.20 | % | 5.75 | % | 4.90 | % | ||||||
| Compensation increases |
4.00 | % | 4.90 | % | 4.00 | % | 4.50 | % | 3.00 | % | 4.20 | % | ||||||
| Return on plan assets |
8.50 | % | 8.00 | % | 8.50 | % | 8.00 | % | 8.50 | % | 8.00 | % | ||||||
Net pension cost for 2008, 2007 and 2006 included the following components:
| (Stated in millions) | ||||||||||||||||||||||||
| 2008 |
2007 |
2006 |
||||||||||||||||||||||
| US | Int’l | US | Int’l | US | Int’l | |||||||||||||||||||
| Service cost – benefits earned during the period |
$ | 56 | $ | 33 | $ | 58 | $ | 35 | $ | 59 | $ | 26 | ||||||||||||
| Interest cost on projected benefit obligation |
130 | 58 | 120 | 52 | 112 | 42 | ||||||||||||||||||
| Expected return on plan assets |
(162 | ) | (75 | ) | (147 | ) | (67 | ) | (134 | ) | (53 | ) | ||||||||||||
| Amortization of net loss |
13 | 11 | 26 | 18 | 27 | 17 | ||||||||||||||||||
| Amortization of prior service cost |
7 | 1 | 7 | – | 8 | – | ||||||||||||||||||
| Net pension cost |
$ | 44 | $ | 28 | $ | 64 | $ | 38 | $ | 72 | $ | 32 | ||||||||||||
As the International Staff Pension Plan was converted to a defined benefit pension plan during the fourth quarter of 2008, the net pension cost included above for this pension plan was not significant in 2008.
The weighted-average assumed discount rate and compensation increases used to determine the projected benefit obligations for the US and International plans were as follows:
| 2008 |
2007 |
|||||||||||
| US | Int’l | US | Int’l | |||||||||
| Discount rate |
6.50 | % | 6.48 | % | 6.50 | % | 5.80 | % | ||||
| Compensation increases |
4.00 | % | 4.80 | % | 4.00 | % | 4.90 | % | ||||
63
Table of Contents
Part II, Item 8
The changes in the projected benefit obligation, plan assets and funded status of the plans were as follows:
| (Stated in millions) | ||||||||||||||||
| 2008 |
2007 |
|||||||||||||||
| US | Int’l | US | Int’l | |||||||||||||
| Projected benefit obligation at beginning of the year |
$ | 2,030 | $ | 1,063 | $ | 2,006 | $ | 991 | ||||||||
| Service cost |
56 | 33 | 58 | 35 | ||||||||||||
| Interest cost |
131 | 58 | 120 | 52 | ||||||||||||
| Contributions by Plan participants |
– | 2 | – | 2 | ||||||||||||
| Actuarial losses/(gains) |
33 | (218 | ) | (57 | ) | (30 | ) | |||||||||
| Currency effect |
– | (257 | ) | – | 26 | |||||||||||
| Benefits paid |
(100 | ) | (28 | ) | (97 | ) | (25 | ) | ||||||||
| Impact of International Staff Pension Plan |
– | 2,114 | – | – | ||||||||||||
| Other |
– | – | – | 12 | ||||||||||||
| Projected benefit obligation at end of the year |
$ | 2,150 | $ | 2,767 | $ | 2,030 | $ | 1,063 | ||||||||
| Plan assets at market value at beginning of the year |
$ | 2,170 | $ | 977 | $ | 1,913 | $ | 810 | ||||||||
| Actual (loss)/return on plan assets |
(572 | ) | (103 | ) | 212 | 57 | ||||||||||
| Currency effect |
– | (259 | ) | – | 21 | |||||||||||
| Contributions |
2 | 288 | 152 | 100 | ||||||||||||
| Contributions by Plan participants |
– | 2 | – | – | ||||||||||||
| Benefits paid |
(100 | ) | (28 | ) | (97 | ) | (25 | ) | ||||||||
| Impact of International Staff Pension Plan |
– | 1,037 | – | – | ||||||||||||
| Other |
(10 | ) | (1 | ) | (10 | ) | 14 | |||||||||
| Plan assets at market value at end of the year |
$ | 1,490 | $ | 1,913 | $ | 2,170 | $ | 977 | ||||||||
| Net (underfunded)/overfunded position at end of year |
$ | (660 | ) | $ | (854 | ) | $ | 140 | $ | (86 | ) | |||||
The underfunded/overfunded position represents the difference between the plan assets and the projected benefit obligation (“PBO”). The PBO represents the actuarial present value of benefits based on employee service and compensation and includes an assumption about future compensation levels.
The amounts recognized on the Consolidated Balance Sheet for the Schlumberger defined benefit pension plans are as follows:
| (Stated in millions) |
|||||||||||||||
| As at December 31, | 2008 |
2007 |
|||||||||||||
| US | Int’l | US | Int’l | ||||||||||||
| Postretirement Benefits |
$ | (660 | ) | $ | (877 | ) | $ | – | $ | (86 | ) | ||||
| Other Assets |
– | 23 | 140 | – | |||||||||||
| Net amount recognized |
$ | (660 | ) | $ | (854 | ) | $ | 140 | $ | (86 | ) | ||||
The following is a weighted-average breakdown of the plans assets:
| 2008 |
2007 |
|||||||||||
| US | Int’l | US | Int’l | |||||||||
| Equity securities |
57 | % | 64 | % | 66 | % | 67 | % | ||||
| Debt securities |
33 | 28 | 26 | 31 | ||||||||
| Cash and cash equivalents |
1 | 2 | 2 | – | ||||||||
| Other investments |
9 | 6 | 6 | 2 | ||||||||
| 100 | % | 100 | % | 100 | % | 100 | % | |||||
64
Table of Contents
Part II, Item 8
The following is the weighted-average target allocation of the defined benefit pension plans’ assets:
| US | Int’l | |||||
| Equity securities |
55 | % | 65 | % | ||
| Debt securities |
33 | 25 | ||||
| Other investments |
12 | 10 | ||||
| 100 | % | 100 | % | |||
The asset allocation objectives are to diversify the portfolio among several asset classes to reduce volatility while maintaining an asset mix that provides the highest expected rate of return consistent with an acceptable level of risk. There is no investment of any plan assets in Schlumberger common stock. Schlumberger’s asset allocation strategy is reviewed at least annually. Other investments above consist primarily of alternative investments such as real estate and private equity.
The expected long-term rate of return on assets assumptions reflect the average rate of earnings expected on funds invested or to be invested. The assumptions have been determined by reflecting expectations regarding future rates of return for the portfolio considering the asset distribution and related historical rates of return. The appropriateness of the assumptions is reviewed annually.
The funding policy is to annually contribute amounts that are based upon a number of factors including the actuarial accrued liability, amounts that are deductible for income tax purposes, legal funding requirements and available cash flow. Schlumberger currently anticipates contributing approximately $400 million to $500 million to its defined benefit pension plans in 2009, subject to market and business conditions.
Postretirement Benefits Other than Pensions
Schlumberger and its United States subsidiary provide certain health care benefits to former US employees who have retired.
The actuarial assumptions used to measure net periodic benefit costs were a discount rate of 6.50% in 2008, 6.00% in 2007 and 5.75% in 2006. The overall medical cost trend rate assumption is 9% graded to 6% over the next four years and 5% thereafter.
The net periodic benefit cost for the US postretirement medical plan included the following components:
| (Stated in millions) | ||||||||||||
| 2008 | 2007 | 2006 | ||||||||||
| Service cost – benefits earned during the period |
$ | 23 | $ | 22 | $ | 26 | ||||||
| Interest cost on projected benefit obligation |
52 | 47 | 45 | |||||||||
| Expected return on plan assets |
(3 | ) | (2 | ) | – | |||||||
| Amortization of prior service credit |
(27 | ) | (27 | ) | (28 | ) | ||||||
| Amortization of net loss |
10 | 13 | 16 | |||||||||
| $ | 55 | $ | 53 | $ | 59 | |||||||
65
Table of Contents
Part II, Item 8
The changes in the accumulated postretirement benefit obligation, plan assets and funded status were as follows:
| (Stated in millions) | ||||||||
| 2008 | 2007 | |||||||
| Accumulated postretirement benefit obligation at beginning of the year |
$ | 792 | $ | 785 | ||||
| Service cost |
23 | 22 | ||||||
| Interest cost |
53 | 48 | ||||||
| Contributions by Plan participants |
5 | – | ||||||
| Actuarial losses/(gains) |
22 | (35 | ) | |||||
| Benefits paid |
(33 | ) | (28 | ) | ||||
| Accumulated postretirement benefit obligation at end of the year |
$ | 862 | $ | 792 | ||||
| Plan assets at market value at beginning of the year |
$ | 39 | $ | 23 | ||||
| Contributions |
28 | 42 | ||||||
| Contributions by Plan participants |
5 | – | ||||||
| Benefits paid |
(33 | ) | (28 | ) | ||||
| Actual return on plan assets |
(10 | ) | 2 | |||||
| Plan assets at market value at end of the year |
$ | 29 | $ | 39 | ||||
| Underfunded position at end of year |
$ | (833 | ) | $ | (753 | ) | ||
The underfunded position is included in Postretirement Benefits in the Consolidated Balance Sheet.
The assumed discount rate used to determine the accumulated postretirement benefit obligation was 6.50% for 2008 and 6.50% for 2007.
The overall medical cost trend rate assumption used to determine the accumulated postretirement benefit obligation for both 2008 and 2007 was 9% graded to 6% over the next four years and 5% thereafter.
Assumed health care cost trend rates have a significant effect on the amounts reported for the U.S. postretirement medical plan. A one percentage point change in assumed health care cost trend rates would have the following effects:
| (Stated in millions) | |||||||
| One percentage point increase |
One percentage point decrease |
||||||
| Effect on total service and interest cost components |
$ | 13 | $ | (11 | ) | ||
| Effect on accumulated postretirment benefit obligation |
$ | 127 | $ | (109 | ) | ||
Other Information
The expected benefits to be paid under the US and International pension plans as well as the postretirement medical plan (which is disclosed net of the annual Medicare Part D subsidy, which ranges from $3 million to $6 million per year) were as follows:
| Pension Benefits |
Postretirement Medical Plan | ||||||||
| US |
Int’l |
||||||||
| 2009 |
$ | 100 | $ | 103 | $ | 36 | |||
| 2010 |
103 | 112 | 39 | ||||||
| 2011 |
107 | 122 | 42 | ||||||
| 2012 |
113 | 131 | 44 | ||||||
| 2013 |
120 | 142 | 47 | ||||||
| 2014 – 2018 |
727 | 863 | 285 | ||||||
Included in Accumulated Other Comprehensive Income at December 31, 2008 are the following non-cash pretax charges which have not yet been recognized in net periodic pension cost. Also presented is the estimated portion of each component of Accumulated Other Comprehensive Income which is expected to be recognized as a component of net periodic benefit cost during the year-ending December 31, 2009.
66
Table of Contents
Part II, Item 8
| (Stated in millions) |
||||||||||||||
| Amt. recognized in Acc. Other Comp. Income at December 31, 2008 |
Amount expected to be charged to net periodic cost in 2009 |
|||||||||||||
| Pension Plans |
Postretirement Medical Plan |
Pension Plans |
Postretirement Medical Plan |
|||||||||||
| Net actuarial losses |
$ | 1,018 | $ | 168 | $ | 33 | $ | 8 | ||||||
| Prior service cost / (credit) |
$ | 1,125 | $ | (92 | ) | $ | 129 | $ | (27 | ) | ||||
In addition to providing defined pension benefits and a postretirement medical plan, Schlumberger and its subsidiaries have other deferred benefit programs, primarily profit sharing and defined contribution pension plans. Expenses for these programs were $482 million, $408 million and $351 million in 2008, 2007 and 2006, respectively.
20. Supplementary Information
Cash paid for interest and income taxes was as follows:
| (Stated in millions) | |||||||||
| Year ended December 31, | 2008 | 2007 | 2006 | ||||||
| Interest |
$ | 289 | $ | 269 | $ | 234 | |||
| Income taxes |
$ | 1,158 | $ | 1,127 | $ | 997 | |||
Accounts payable and accrued liabilities are summarized as follows:
| (Stated in millions) | ||||||
| As at December 31, | 2008 | 2007 | ||||
| Payroll, vacation and employee benefits |
$ | 1,126 | $ | 1,076 | ||
| Trade |
1,872 | 1,554 | ||||
| Other |
2,270 | 1,921 | ||||
| $ | 5,268 | $ | 4,551 | |||
Interest and other income, net includes the following:
| (Stated in millions) |
|||||||||||
| Year ended December 31, | 2008 | 2007 | 2006 | ||||||||
| Interest income |
$ | 119 | $ | 162 | $ | 117 | |||||
| Equity in net earnings of affiliated companies |
293 | 244 | 179 | ||||||||
| Other |
(10 | ) | 25 | (9 | ) | ||||||
| $ | 402 | $ | 431 | $ | 287 | ||||||
Allowance for doubtful accounts is as follows:
| (Stated in millions) |
||||||||||||
| Year ended December 31, | 2008 | 2007 | 2006 | |||||||||
| Balance at beginning of year |
$ | 86 | $ | 115 | $ | 103 | ||||||
| Provision |
65 | 9 | 24 | |||||||||
| Amounts written off |
(18 | ) | (38 | ) | (12 | ) | ||||||
| Balance at end of year |
$ | 133 | $ | 86 | $ | 115 | ||||||
Discontinued Operations
During 2008, Schlumberger recorded an after-tax gain of $38 million related to the resolution of a contingency associated with a previously disposed of business. This gain is included in Income from Discontinued Operations in the Consolidated Statement of Income.
67
Table of Contents
Part II, Item 8
Management’s Report on Internal Control Over Financial Reporting
The management of Schlumberger Limited is responsible for establishing and maintaining adequate internal control over financial reporting as defined in Rule 13a–15(f) of the Securities Exchange Act of 1934, as amended. Schlumberger Limited’s internal control over financial reporting is a process designed to provide reasonable assurance regarding the reliability of financial reporting and the preparation of financial statements for external purposes in accordance with generally accepted accounting principles.
Because of its inherent limitations, internal control over financial reporting may not prevent or detect misstatements. Also, projections of any evaluation of effectiveness to future periods are subject to the risk that controls may become inadequate because of changes in conditions, or that the degree of compliance with the policies or procedures may deteriorate.
Schlumberger Limited management assessed the effectiveness of our internal control over financial reporting as of December 31, 2008. In making this assessment, it used the criteria set forth by the Committee of Sponsoring Organizations of the Treadway Commission (COSO) in Internal Control—Integrated Framework. Based on our assessment we have concluded that, as of December 31, 2008, our internal control over financial reporting is effective based on those criteria.
The effectiveness of Schlumberger Limited’s internal control over financial reporting as of December 31, 2008, has been audited by PricewaterhouseCoopers LLP, an independent registered public accounting firm, as stated in their report which appears herein.
68
Table of Contents
Part II, Item 8
Report of Independent Registered Public Accounting Firm
To the Board of Directors and Stockholders
of Schlumberger Limited
In our opinion, the accompanying consolidated balance sheet and the related consolidated statements of income, of stockholders’ equity and of cash flows present fairly, in all material respects, the financial position of Schlumberger Limited and its subsidiaries at December 31, 2008 and 2007, and the results of their operations and their cash flows for each of the three years in the period ended December 31, 2008 in conformity with accounting principles generally accepted in the United States of America. Also in our opinion, the Company maintained, in all material respects, effective internal control over financial reporting as of December 31, 2008, based on criteria established in Internal Control—Integrated Framework issued by the Committee of Sponsoring Organizations of the Treadway Commission (COSO). The Company’s management is responsible for these financial statements, for maintaining effective internal control over financial reporting and for its assessment of the effectiveness of internal control over financial reporting, included in Management’s Report on Internal Control Over Financial Reporting appearing on page 68 of this Annual Report on Form 10-K. Our responsibility is to express opinions on these financial statements and on the Company’s internal control over financial reporting based on our integrated audits. We conducted our audits in accordance with the standards of the Public Company Accounting Oversight Board (United States). Those standards require that we plan and perform the audits to obtain reasonable assurance about whether the financial statements are free of material misstatement and whether effective internal control over financial reporting was maintained in all material respects. Our audits of the financial statements included examining, on a test basis, evidence supporting the amounts and disclosures in the financial statements, assessing the accounting principles used and significant estimates made by management, and evaluating the overall financial statement presentation. Our audit of internal control over financial reporting included obtaining an understanding of internal control over financial reporting, assessing the risk that a material weakness exists, and testing and evaluating the design and operating effectiveness of internal control based on the assessed risk. Our audits also included performing such other procedures as we considered necessary in the circumstances. We believe that our audits provide a reasonable basis for our opinions.
As discussed in Note 15 to the consolidated financial statements, the Company changed its method of accounting for uncertainty in income taxes on January 1, 2007. Additionally, as discussed in Note 2 to the consolidated financial statements, the Company changed its method of accounting for defined benefit pension and other postretirement plans on December 31, 2006.
A company’s internal control over financial reporting is a process designed to provide reasonable assurance regarding the reliability of financial reporting and the preparation of financial statements for external purposes in accordance with generally accepted accounting principles. A company’s internal control over financial reporting includes those policies and procedures that (i) pertain to the maintenance of records that, in reasonable detail, accurately and fairly reflect the transactions and dispositions of the assets of the company; (ii) provide reasonable assurance that transactions are recorded as necessary to permit preparation of financial statements in accordance with generally accepted accounting principles, and that receipts and expenditures of the company are being made only in accordance with authorizations of management and directors of the company; and (iii) provide reasonable assurance regarding prevention or timely detection of unauthorized acquisition, use, or disposition of the company’s assets that could have a material effect on the financial statements.
69
Table of Contents
Part II, Item 8
Because of its inherent limitations, internal control over financial reporting may not prevent or detect misstatements. Also, projections of any evaluation of effectiveness to future periods are subject to the risk that controls may become inadequate because of changes in conditions, or that the degree of compliance with the policies or procedures may deteriorate.
| /s/ PRICEWATERHOUSECOOPERS LLP |
| PricewaterhouseCoopers LLP |
| Houston, Texas February 11, 2009 |
70
Table of Contents
Part II, Item 8, 9, 9A, 9B
Quarterly Results
(UNAUDITED)
The following table summarizes Schlumberger’s results for each of the four quarters for the years ended December 31, 2008 and 2007.
| (Stated in millions except per share amounts) | |||||||||||||||
| Revenue | Gross Margin1 |
Net Income2 |
Earnings per share2 | ||||||||||||
| Basic | Diluted | ||||||||||||||
| Quarters-2008 |
|||||||||||||||
| First |
$ | 6,290 | $ | 1,932 | $ | 1,338 | $ | 1.12 | $ | 1.09 | |||||
| Second |
6,746 | 2,137 | 1,420 | 1.19 | 1.16 | ||||||||||
| Third |
7,259 | 2,292 | 1,526 | 1.27 | 1.25 | ||||||||||
| Fourth3 |
6,868 | 1,835 | 1,150 | 0.96 | 0.95 | ||||||||||
| $ | 27,163 | $ | 8,196 | $ | 5,435 | $ | 4.54 | $ | 4.45 | ||||||
| Quarters-2007 |
|||||||||||||||
| First |
$ | 5,464 | $ | 1,842 | $ | 1,181 | $ | 1.00 | $ | 0.96 | |||||
| Second |
5,639 | 1,902 | 1,258 | 1.06 | 1.02 | ||||||||||
| Third |
5,926 | 2,021 | 1,354 | 1.13 | 1.09 | ||||||||||
| Fourth4 |
6,248 | 2,030 | 1,383 | 1.16 | 1.12 | ||||||||||
| $ | 23,277 | $ | 7,795 | $ | 5,177 | $ | 4.36 | $ | 4.20 | ||||||
| 1. | Gross margin equals Revenue less Cost of goods sold & services. |
| 2. | Due to rounding, the addition of net income and earnings per share by quarter may not equal the total for the year. |
| 3. | Net income in the fourth quarter of 2008 includes an after-tax charge of $93 million. |
| 4. | Net income in the fourth quarter of 2007 includes an after-tax credit of $17 million. |
| * | Mark of Schlumberger |
Item 9. Changes in and Disagreements with Accountants on Accounting and Financial Disclosure.
None.
Item 9A. Controls and Procedures.
Schlumberger has carried out an evaluation under the supervision and with the participation of Schlumberger’s management, including the Chief Executive Officer (“CEO”) and the Chief Financial Officer (“CFO”), of the effectiveness of the design and operation of Schlumberger’s disclosure controls and procedures. Based upon Schlumberger’s evaluation, the CEO and the CFO have concluded that, as of December 31, 2008, the disclosure controls and procedures were effective to provide reasonable assurance that information required to be disclosed in the reports Schlumberger files and submits under the Securities Exchange Act of 1934 is recorded, processed, summarized and reported within the time periods specified in Securities and Exchange Commission rules and forms.
There has been no change in Schlumberger’s internal control over financial reporting that occurred during the quarter ended December 31, 2008 that has materially affected, or is reasonably likely to materially affect, Schlumberger’s internal control over financial reporting.
See page 66 of this Report for Management’s Report on Internal Control Over Financial Reporting.
None.
71
Table of Contents
Part III, Item 10, 11, 12
Item 10. Directors, Executive Officers and Corporate Governance of Schlumberger.
See “Item 4. Submission of Matters to a Vote of Security Holders – Executive Officers of Schlumberger” of this Report for Item 10 information regarding executive officers of Schlumberger. The information under the captions “Election of Directors,” “Section 16(a) Beneficial Ownership Reporting Compliance,” “Corporate Governance – Director Nominations” and “Corporate Governance – Board Committees – Audit Committee” in Schlumberger’s Proxy Statement to be filed with the SEC with respect to the 2009 Annual General Meeting of Stockholders is incorporated herein by reference.
Schlumberger has adopted a Code of Ethics that applies to all of it directors, officers and employees, including its principal executive, financial and accounting officers, or persons performing similar functions. Schlumberger’s Code of Ethics is posted on its corporate governance website located at www.slb.com/ir. In addition, amendments to the Code of Ethics and any grant of a waiver from a provision of the Code of Ethics requiring disclosure under applicable SEC rules will be disclosed on Schlumberger’s corporate governance website located at www.slb.com/ir.
Item 11. Executive Compensation.
The information set forth under the captions “Compensation Discussion and Analysis,” “Executive Compensation,” “Compensation Committee Report” and “Director Compensation” in Schlumberger’s Proxy Statement to be filed with the SEC with respect to the 2009 Annual General Meeting of Stockholders is incorporated herein by reference.
Item 12. Security Ownership of Certain Beneficial Owners and Management and Related Stockholder
Matters.
The information under the caption “Security Ownership of Certain Beneficial Owners and Management” in Schlumberger’s Proxy Statement to be filed with the SEC with respect to the 2009 Annual General Meeting of Stockholders is incorporated herein by reference.
Equity Compensation Plan Information
The table below sets forth the following information as of December 31, 2008 for (1) all compensation plans previously approved by our stockholders and (2) all compensation plans not previously approved by our stockholders.
| Plan Category |
Number of securities to be issued upon exercise of outstanding options, warrants and rights |
Weighted-average exercise price of such outstanding options, warrants and rights |
Number of securities remaining available for future issuance under equity compensation plans (excluding securities reflected in column (a)) | ||||
| Equity compensation plans approved by security holders |
32,301,317 | $ | 50.36 | 22,599,548 | |||
| Equity compensation plans not approved by security holders |
N/A | N/A | N/A | ||||
| 32,301,317 | $ | 50.36 | 22,599,548 | ||||
Equity compensation plans approved by our stockholders include the Schlumberger 1994 Stock Option Plan as amended, the Schlumberger 1998 Stock Option Plan as amended, the Schlumberger 2001 Stock Option Plan, as amended, the Schlumberger 2005 Stock Incentive Plan, as amended, the Schlumberger 2008 Stock Incentive Plan, as amended, and the Schlumberger Discounted Stock Purchase Plan and the Schlumberger Stock and Deferral Plan for Non-Employee Directors.
72
Table of Contents
Part III, Item 13, 14
Item 13. Certain Relationships and Related Transactions, and Director Independence.
The information under the captions “Corporate Governance – Director Independence” and “Corporate Governance – Policies and Procedures for Approval of Related Person Transactions” in Schlumberger’s Proxy Statement to be filed with the SEC for the 2009 Annual General Meeting of Stockholders is incorporated herein by reference.
Item 14. Principal Accounting Fees and Services.
The information under the caption “Appointment of Independent Registered Public Accounting Firm” in Schlumberger’s Proxy Statement to be filed with the SEC with respect to the 2009 Annual General Meeting of Stockholders is incorporated herein by reference.
73
Table of Contents
Part IV, Item 15
Item 15. Exhibits and Financial Statement Schedules.
| (a) | The following documents are filed as part of this Report: |
| Page(s) | ||||
| (1) Financial Statements |
||||
| ConsolidatedStatement of Income for the three years ended December 31, 2008 |
35 | |||
| ConsolidatedBalance Sheet at December 31, 2008 and 2007 |
36 | |||
| ConsolidatedStatement of Cash Flows for the three years ended December 31, 2008 |
37 | |||
| Consolidated Statement of Stockholders’ Equity for the three years ended December 31, 2008 |
38 and 39 | |||
| Notes to Consolidated Financial Statements |
40 to 67 | |||
| Report of Independent Registered Public Accounting Firm |
69 | |||
| Quarterly Results (Unaudited) |
71 | |||
| Financial statements of 20% – 50% owned companies accounted for under the equity method and unconsolidated subsidiaries have been omitted because they do not meet the materiality tests for assets or income. | ||||
| (2) Financial Statement Schedules not required |
||||
| (3) Exhibits: the exhibits listed in the accompanying “Index to Exhibits” are filed or incorporated by reference as part of this Form 10-K report. | ||||
74
Table of Contents
Pursuant to the requirements of Section 13 or 15(d) of the Securities Exchange Act of 1934, the Registrant has duly caused this Report to be signed on its behalf by the undersigned, thereunto duly authorized.
| Date: February 11, 2009 |
SCHLUMBERGER LIMITED | |||||||
| By: |
/s/ HOWARD GUILD | |||||||
| Howard Guild Chief Accounting Officer | ||||||||
Pursuant to the requirements of the Securities Exchange Act of 1934, this Report has been signed below by the following persons on behalf of the Registrant and in the capacities and on the dates indicated.
| Name | Title | |||
| * Andrew Gould |
Director, Chairman and Chief Executive Officer (Principal Executive Officer) | |||
| /s/ SIMON AYAT Simon Ayat |
Executive Vice President and Chief Financial Officer (Principal Financial Officer) | |||
| /s/ HOWARD GUILD Howard Guild |
Chief Accounting Officer (Principal Accounting Officer) | |||
| * Philippe Camus |
Director | |||
| * Jamie S. Gorelick |
Director | |||
| * Tony Isaac |
Director | |||
| * Nikolay Kudryavtsev |
Director | |||
| * Adrian Lajous |
Director | |||
| * Michael E. Marks |
Director | |||
| * Leo Rafael Reif |
Director | |||
| * Tore Sandvold |
Director | |||
| * Nicolas Seydoux |
Director | |||
| * Linda G. Stuntz |
Director | |||
| /s/ ELLEN SUMMER *By Ellen Summer Attorney-in-Fact |
February 11, 2009 | |||
75
Table of Contents
INDEX TO EXHIBITS
| Exhibit | ||
| Articles of Incorporation of Schlumberger Limited (Schlumberger N.V.), as last amended on April 12, 2006 (incorporated by reference to Exhibit 3.1 to Schlumberger’s Quarterly Report on Form 10-Q for the quarter ended March 31, 2006) |
3.1 | |
| Amended and Restated By-Laws of Schlumberger Limited (Schlumberger N.V.), as last amended on April 21, 2005 (incorporated by reference to Exhibit 3.1 to Schlumberger’s Current Report on Form 8-K filed on April 22, 2005) |
3.2 | |
| Indenture dated as of June 9, 2003, by and between Schlumberger Limited and Citibank, N.A., as Trustee (incorporated by reference to Exhibit 4.3 to Schlumberger’s Registration Statement on Form S-3 filed on September 12, 2003) |
4.1 | |
| First Supplemental Indenture dated as of June 9, 2003, by and between Schlumberger Limited and Citibank, N.A., as Trustee (incorporated by reference to Exhibit 4.4 to Schlumberger’s Registration Statement on Form S-3 filed on September 12, 2003) |
4.2 | |
| Schlumberger 1994 Stock Option Plan, as conformed to include amendments through January 1, 2009(*)(+) |
10.1 | |
| Schlumberger Limited Supplementary Benefit Plan, as conformed to include amendments through January 1, 2009(*)(+) |
10.2 | |
| Schlumberger Limited Restoration Savings Plan, as conformed to include amendments through January 1, 2009(*)(+) |
10.3 | |
| Schlumberger 1998 Stock Option Plan, as conformed to include amendments through January 1, 2009(*)(+) |
10.4 | |
| Schlumberger 2001 Stock Option Plan, as conformed to include amendments through January 1, 2009(*)(+) |
10.5 | |
| Schlumberger 2005 Stock Incentive Plan, as conformed to include amendments through January 1, 2009(*)(+) |
10.6 | |
| Schlumberger Limited 2004 Stock and Deferral Plan for Non-Employee Directors, as conformed to include amendments through January 1, 2009(*)(+) |
10.7 | |
| Schlumberger 2008 Stock Incentive Plan, as conformed to include amendments through January 1, 2009(*)(+) |
10.8 | |
| Form of Option Agreement, Incentive Stock Option (incorporated by reference to Exhibit 10.1 to Schlumberger’s Current Report on Form 8-K filed on January 19, 2006) |
10.9 | |
| Form of Option Agreement, Non-Qualified Stock Option (incorporated by reference to Exhibit 10.2 to Schlumberger’s Current Report on Form 8-K filed on January 19, 2006) |
10.10 | |
| Employment Agreement dated January 18, 2007 and effective as of March 1, 2007, between Schlumberger Limited and Jean-Marc Perraud (incorporated by reference to Exhibit 10.1 to Schlumberger’s Current Report on Form 8-K filed on January 22, 2007)(+) |
10.11 | |
| Form of Indemnification Agreement (incorporated by reference to Exhibit 10.1 to Schlumberger’s Current Report on Form 8-K filed on April 22, 2005) |
10.12 | |
| Subsidiaries(*) |
21 | |
| Consent of Independent Registered Public Accounting Firm(*) |
23 | |
76
Table of Contents
| Exhibit | ||||
| Powers of Attorney(*) Philippe Camus Jamie S. Gorelick Andrew Gould Tony Isaac Nikolay Kudryavtsev Adrian Lajous Michael E. Marks Leo Rafael Reif Tore I. Sandvold Nicolas Seydoux Linda G. Stuntz |
dated: January 22, 2009 | 24.1 | ||
| Additional Exhibits: |
||||
| Certification of Chief Executive Officer pursuant to Rule 13a-14(a) as Adopted Pursuant to Section 302 of the Sarbanes-Oxley Act of 2002(*) |
31.1 | |||
| Certification of Chief Financial Officer pursuant to Rule 13a-14(a) as Adopted Pursuant to Section 302 of the Sarbanes-Oxley Act of 2002(*) |
31.2 | |||
| Certification of Chief Executive Officer pursuant to 18 U.S.C. Section 1350, as Adopted Pursuant to Section 906 of the Sarbanes-Oxley Act of 2002(*) |
32.1 | |||
| Certification of Chief Financial Officer pursuant to 18 U.S.C. Section 1350, as Adopted Pursuant to Section 906 of the Sarbanes-Oxley Act of 2002(*) |
32.2 | |||
| (*) | Exhibits physically filed with this Form 10-K report. All other exhibits are incorporated by reference. |
| (+) | Management contracts or compensatory plans or arrangements. |
77
Table of Contents
Exhibit 21
Significant Subsidiaries
Listed below are the significant first tier subsidiaries of the Registrant, along with the total number of active subsidiaries directly or indirectly owned by each as of January 1, 2009. Certain second and third tier subsidiaries, though included in the numbers, are also shown by name. Ownership is 100% unless otherwise indicated. The business activities of the subsidiaries have been keyed as follows: (a) Oilfield Services, (b) WesternGeco, (c) General/Multiple Segments.
| U.S. | Non-U.S. | |||||
| Schlumberger B.V., Netherlands (c) |
1 |
|
55(a) 21(b) 4(c) |
1 2
| ||
| Schlumberger Canada Limited, Ontario (c) |
||||||
| Schlumberger SA, France (a) |
||||||
| Services Petroliers Schlumberger, France (a) |
||||||
| Schlumberger Norge AS (c) |
||||||
| Schlumberger Antilles N.V., Netherlands Antilles (a) |
2(a) | |||||
| Schlumberger Oilfield Holdings Limited, BVI (c) |
1(a) | 135(a) 27(b) 8(c) |
3 4
| |||
| Schlumberger Holdings Limited, BVI (a) |
||||||
| Dowell Schlumberger Corporation, BVI (a) |
||||||
| Schlumberger Middle East S.A., Panama (a) |
||||||
| Schlumberger Offshore Services Limited, BVI (a) |
||||||
| Schlumberger Overseas, S.A., Panama (a) |
||||||
| Schlumberger Seaco, Inc., Panama (a) |
||||||
| Schlumberger Surenco, S.A., Panama (a) |
||||||
| Schlumberger Plc, UK (c) |
||||||
| Schlumberger Oilfield UK Plc, UK (a) |
||||||
| WesternGeco Limited, UK (b) |
||||||
| WesternGeco Seismic Holdings Limited, BVI (b) |
||||||
| Schlumberger Technology Corporation, Texas (c) |
7(a) 3(b) 4(c) |
5
|
1(b) | |||
| WesternGeco L.L.C., Delaware (b) |
||||||
| 1 |
Includes eight majority-owned subsidiaries and one 50%-owned subsidiary. |
| 2 |
Includes one majority-owned subsidiary and one 50%-owned subsidiary. |
| 3 |
Includes three majority-owned subsidiaries and three 50%-owned subsidiaries. |
| 4 |
Includes two majority-owned subsidiaries. |
| 5 |
Includes one majority-owned subsidiary and one 50%-owned subsidiary. |
Table of Contents
Exhibit 23
Consent of Independent Registered Public Accounting Firm
We hereby consent to the incorporation by reference in the Registration Statements on Form S-8 (Nos. 33-86424; 333-62545; 333-36366; 333-36364; 333-67330; 333-104225; 333-115277; 333-124534; and 333-151920), on Form S-3 (No. 333-108730) and on Form S-4 (No. 333-97899) of Schlumberger Limited of our report dated February 11, 2009 relating to the consolidated financial statements and the effectiveness of internal control over financial reporting, which appears in this Form 10-K.
| /s/ PRICEWATERHOUSECOOPERS LLP |
| PricewaterhouseCoopers LLP |
| Houston, Texas |
| February 11, 2009 |
Table of Contents
Exhibit 24.1
Power of Attorney
Each of the undersigned, in the capacity or capacities set forth below his or her signature as a member of the Board of Directors and/or an officer of Schlumberger Limited (“the Corporation”), a Netherlands Antilles corporation, hereby appoints Simon Ayat, Howard Guild and Ellen Summer, and each of them, the attorney or attorneys of the undersigned, with full power of substitution and revocation, for and in the name, place and stead of the undersigned to execute and file with the Securities and Exchange Commission the Form 10-K Annual Report under the Securities Exchange Act of 1934 for the year ending 2008, and any amendment or amendments to any such Form 10-K Annual Report, and any agreements, consents or waivers relative thereto, and to take any and all such other action for and in the name and place and stead of the undersigned as may be necessary or desirable in connection with any such Form 10-K Annual Report.
| /s/ Philippe Camus Philippe Camus Director |
/s/ Michael E. Marks Michael E. Marks Director | |
| /s/ Jamie S. Gorelick Jamie S. Gorelick Director |
/s/ Leo Rafael Reif Leo Rafael Reif Director | |
| /s/ Andrew Gould Andrew Gould Director Chairman and Chief Executive Officer |
/s/ Tore Sandvold Tore Sandvold Director | |
| /s/ Tony Isaac Tony Isaac Director |
/s/ Nicolas Seydoux Nicolas Seydoux Director | |
| /s/ Nikolay Kudryavtsev Nikolay Kudryavtsev Director |
/s/ Linda G. Stuntz Linda G. Stuntz Director | |
| /s/ Adrian Lajous Adrian Lajous Director |
||
Date: January 22, 2009
Table of Contents
CERTIFICATION OF CHIEF EXECUTIVE OFFICER
I, Andrew Gould, certify that:
1. I have reviewed this Annual Report on Form 10-K of Schlumberger Limited;
2. Based on my knowledge, this report does not contain any untrue statement of a material fact or omit to state a material fact necessary to make the statements made, in light of the circumstances under which such statements were made, not misleading with respect to the period covered by this report;
3. Based on my knowledge, the financial statements, and other financial information included in this report, fairly present in all material respects the financial condition, results of operations and cash flows of the registrant as of, and for, the periods presented in this report;
4. The registrant’s other certifying officer and I are responsible for establishing and maintaining disclosure controls and procedures (as defined in Exchange Act Rules 13a-15(e) and 15d-15(e)) and internal control over financial reporting (as defined in Exchange Act Rules 13a-15(f) and 15d-15(f)) for the registrant and have:
| a) | Designed such disclosure controls and procedures, or caused such disclosure controls and procedures to be designed under our supervision, to ensure that material information relating to the registrant, including its consolidated subsidiaries, is made known to us by others within those entities, particularly during the period in which this report is being prepared; |
| b) | Designed such internal control over financial reporting, or caused such internal control over financial reporting to be designed under our supervision, to provide reasonable assurance regarding the reliability of financial reporting and the preparation of financial statements for external purposes in accordance with generally accepted accounting principles; |
| c) | Evaluated the effectiveness of the registrant’s disclosure controls and procedures and presented in this report our conclusions about the effectiveness of the disclosure controls and procedures, as of the end of the period covered by this report based on such evaluation; and |
| d) | Disclosed in this report any change in the registrant’s internal control over financial reporting that occurred during the registrant’s most recent fiscal quarter (the registrant’s fourth fiscal quarter in the case of an annual report) that has materially affected, or is reasonably likely to materially affect, the registrant’s internal control over financial reporting; and |
5. The registrant’s other certifying officer and I have disclosed, based on our most recent evaluation of internal control over financial reporting, to the registrant’s auditors and the audit committee of the registrant’s board of directors (or persons performing the equivalent functions):
| a) | All significant deficiencies and material weaknesses in the design or operation of internal control over financial reporting which are reasonably likely to adversely affect the registrant’s ability to record, process, summarize and report financial information; and |
| b) | Any fraud, whether or not material, that involves management or other employees who have a significant role in the registrant’s internal control over financial reporting. |
| Date: February 11, 2009 |
/s/ Andrew Gould | |
| Andrew Gould | ||
| Chairman and Chief Executive Officer |
Table of Contents
Exhibit 31.2
CERTIFICATION OF CHIEF FINANCIAL OFFICER
I, Simon Ayat, certify that:
1. I have reviewed this Annual Report on Form 10-K of Schlumberger Limited;
2. Based on my knowledge, this report does not contain any untrue statement of a material fact or omit to state a material fact necessary to make the statements made, in light of the circumstances under which such statements were made, not misleading with respect to the period covered by this report;
3. Based on my knowledge, the financial statements, and other financial information included in this report, fairly present in all material respects the financial condition, results of operations and cash flows of the registrant as of, and for, the periods presented in this report;
4. The registrant’s other certifying officer and I are responsible for establishing and maintaining disclosure controls and procedures (as defined in Exchange Act Rules 13a-15(e) and 15d-15(e)) and internal control over financial reporting (as defined in Exchange Act Rules 13a-15(f) and 15d-15(f)) for the registrant and have:
| a) | Designed such disclosure controls and procedures, or caused such disclosure controls and procedures to be designed under our supervision, to ensure that material information relating to the registrant, including its consolidated subsidiaries, is made known to us by others within those entities, particularly during the period in which this report is being prepared; |
| b) | Designed such internal control over financial reporting, or caused such internal control over financial reporting to be designed under our supervision, to provide reasonable assurance regarding the reliability of financial reporting and the preparation of financial statements for external purposes in accordance with generally accepted accounting principles; |
| c) | Evaluated the effectiveness of the registrant’s disclosure controls and procedures and presented in this report our conclusions about the effectiveness of the disclosure controls and procedures, as of the end of the period covered by this report based on such evaluation; and |
| d) | Disclosed in this report any change in the registrant’s internal control over financial reporting that occurred during the registrant’s most recent fiscal quarter (the registrant’s fourth fiscal quarter in the case of an annual report) that has materially affected, or is reasonably likely to materially affect, the registrant’s internal control over financial reporting; and |
5. The registrant’s other certifying officer and I have disclosed, based on our most recent evaluation of internal control over financial reporting, to the registrant’s auditors and the audit committee of the registrant’s board of directors (or persons performing the equivalent functions):
| a) | All significant deficiencies and material weaknesses in the design or operation of internal control over financial reporting which are reasonably likely to adversely affect the registrant’s ability to record, process, summarize and report financial information; and |
| b) | Any fraud, whether or not material, that involves management or other employees who have a significant role in the registrant’s internal control over financial reporting. |
| Date: February 11, 2009 | /s/ Simon Ayat | |
| Simon Ayat | ||
| Executive Vice President and Chief Financial Officer |
Table of Contents
Exhibit 32.1
CERTIFICATION OF CHIEF EXECUTIVE OFFICER
PURSUANT TO
18 U.S.C. SECTION 1350
AS ADOPTED PURSUANT TO
SECTION 906 OF THE SARBANES-OXLEY ACT OF 2002
In connection with the Annual Report on Form 10-K of Schlumberger N.V. (Schlumberger Limited) (the “Company”) for the year ended December 31, 2008 as filed with the Securities and Exchange Commission on the date hereof (the “Report”), I, Andrew Gould, Chairman and Chief Executive Officer of the Company, certify, pursuant to 18 U.S.C. § 1350, as adopted pursuant to § 906 of the Sarbanes-Oxley Act of 2002, that:
(1) The Report fully complies with the requirements of section 13(a) or 15(d) of the Securities Exchange Act of 1934, as amended (the “Exchange Act”),
and
(2) The information contained in the Report fairly presents, in all material respects, the financial condition and results of operations of the Company.
| Date: February 11, 2009 | /s/ Andrew Gould | |
| Andrew Gould | ||
| Chairman and Chief Executive Officer |
A signed original of this written statement required by Section 906 has been provided to Schlumberger Limited and will be retained by Schlumberger Limited and furnished to the Securities and Exchange Commission or its staff upon request.
This certification accompanies the Report pursuant to Section 906 of the Sarbanes-Oxley Act of 2002 and shall not be deemed filed by the Company for purposes of Section 18 of the Exchange Act.
Table of Contents
Exhibit 32.2
CERTIFICATION OF CHIEF FINANCIAL OFFICER
PURSUANT TO
18 U.S.C. SECTION 1350
AS ADOPTED PURSUANT TO
SECTION 906 OF THE SARBANES-OXLEY ACT OF 2002
In connection with the Annual Report on Form 10-K of Schlumberger N.V. (Schlumberger Limited) (the “Company”) for the year ended December 31, 2008 as filed with the Securities and Exchange Commission on the date hereof (the “Report”), I, Simon Ayat, Executive Vice President and Chief Financial Officer of the Company, certify, pursuant to 18 U.S.C. § 1350, as adopted pursuant to § 906 of the Sarbanes-Oxley Act of 2002, that:
(1) The Report fully complies with the requirements of section 13(a) or 15(d) of the Securities Exchange Act of 1934, as amended (the “Exchange Act”),
and
(2) The information contained in the Report fairly presents, in all material respects, the financial condition and results of operations of the Company.
| Date: February 11, 2009 |
/s/ Simon Ayat | |
| Simon Ayat | ||
| Executive Vice President and Chief Financial Officer |
A signed original of this written statement required by Section 906 has been provided to Schlumberger Limited and will be retained by Schlumberger Limited and furnished to the Securities and Exchange Commission or its staff upon request.
This certification accompanies the Report pursuant to Section 906 of the Sarbanes-Oxley Act of 2002 and shall not be deemed filed by the Company for purposes of Section 18 of the Exchange Act.
Table of Contents

Table of Contents