 |


The following highlights for 2002 reflect the success of our product broadening strategy, the growth of our distribution and the benefits of a strong brand.
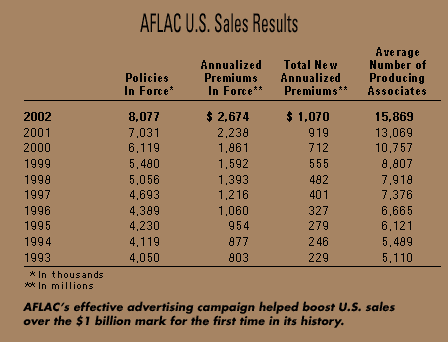
Total new annualized premium sales increased 16.4% to $1.1 billion, compared with $919 million in 2001.
Premium income rose 20.5% to $2.2 billion, up from $1.8 billion in 2001.
Total revenues were up 18.8% to $2.6 billion, rising from $2.2 billion in 2001.
Pretax operating earnings advanced 16.7% to $402 million, compared with $345 million in 2001.

 
For the last 15 years, AFLAC U.S. has pursued a strategy focused on product broadening. We continually assess consumers' insurance needs so we can improve policies in our existing product line and develop new types of supplemental coverage. Although our products appeal to a wide range of consumers who have varied insurance needs, our products all share common features. First, we design products that quickly provide consumers with cash benefits to help them cope with out-of-pocket expenses following a health-related event. These out-of-pocket expenses might include medical expenses, such as hospital care and physician services, or nonmedical expenses such as travel and lodging expenses and lost wages. Second, our policies provide fixed-benefit amounts rather than open-ended payments. For the consumer, that makes them easier to understand and more affordable. And for AFLAC, they are less costly to administer.
The success of our product broadening strategy is evidenced by our rates of sales growth as well as changes in our product mix. In 1987, our cancer product made up about 56% of total new annualized premium sales. Although we produced solid growth in cancer insurance sales in 2002, they made up only 21% of new sales. In 2002, accident/disability was our top-selling product, accounting for about 51% of our new sales. This product category has been our leading seller for nine consecutive years. And although it has been on the market for a relatively short time compared with our cancer policy, our accident/disability premiums in force exceed those of our cancer insurance business. Our payroll life and fixed-benefit dental products also sold well during the year, as did our newest product – personal sickness indemnity, or PSI. Because of the success of the new PSI product, the hospital indemnity category posted a sales increase of 98% in 2002, making it our third best-selling product category.

 
|
 |