 |
|
We have 79 operations and approximately 8,500 employees.
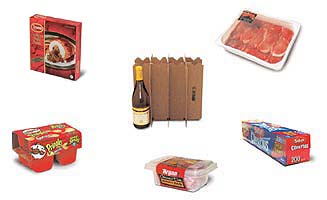
PACKAGING PRODUCTS
Folding Carton � Fifth-largest manufacturer of folding cartons in North America
RTS Packaging � Largest producer of solid fiber interior packaging in North America
Plastic Packaging� Supplies 40% of the rigid barrier plastic trays for the case-ready market
|
 |
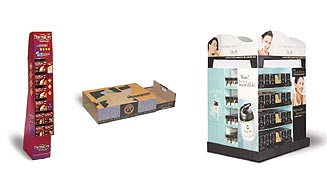
MERCHANDISING DISPLAYS AND CORRUGATED PACKAGING
Alliance � Largest manufacturer of temporary point-of-purchase displays in North America
Corrugated Packaging � Leading producer in the Southeast
|
 |
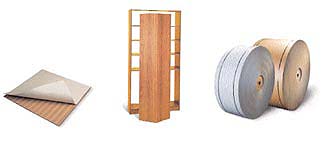
PAPERBOARD
Recycled Paperboard � Second-largest U.S. producer of clay-coated boxboard
Laminated Paperboard � Largest U.S. producer of laminated paperboard products for ready-to-assemble furniture and second-largest for books and binders
Recycled Fiber � Buys and sells over 1.5 million tons per year
|
 |
|
Year Ended September 30, |
| (In Thousands) |
|
2002 |
|
2001 |
|
2000 |
|
| |
| PACKAGING PRODUCTS |
| |
| Net sales (aggregate) |
$ 790,210 |
$ 806,107 |
$ 797,399 |
| Less net sales (intersegment) |
3,297 |
3,474 |
5,294 |
| Net sales (unaffiliated customers) |
786,913 |
802,633 |
792,105 |
| |
| Segment Income |
50,488 |
48,074 |
39,724 |
| Identifiable Assets |
419,692 |
423,041 |
429,422 |
| Capital Expenditures |
34,443 |
33,983 |
48,094 |
| |
|
| |
| MERCHANDISING DISPLAYS AND CORRUGATED PACKAGING |
| |
| Net sales (aggregate) |
$ 290,133 |
$ 263,395 |
$ 238,822 |
| Less net sales (intersegment) |
5,062 |
5,615 |
5,334 |
| Net sales (unaffiliated customers) |
285,071 |
257,780 |
233,488 |
| |
| Segment Income |
32,813 |
30,246 |
27,629 |
| Identifiable Assets |
152,503 |
132,122 |
130,126 |
| Capital Expenditures |
11,955 |
10,097 |
14,238 |
| |
|
| |
| PAPERBOARD |
| |
| Net sales (aggregate) |
$ 516,181 |
$ 524,551 |
$ 588,489 |
| Less net sales (intersegment) |
151,618 |
143,332 |
150,794 |
| Net sales (unaffiliated customers) |
364,563 |
381,219 |
437,695 |
| |
| Segment Income |
24,093 |
41,633 |
51,380 |
| Identifiable Assets |
566,895 |
582,364 |
585,985 |
| Capital Expenditures |
24,805 |
26,784 |
29,815 |
|
|
|