
Shareholders Day
November 15, 2002
Following are transcripts of the presentations made at The Washington Post Company's Shareholders Day on November 15, 2002. The transcripts have been edited and contain clarifications.
The presentations at this Shareholders Day meeting contain certain forward-looking statements that are based largely on the Company's current expectations. Forward-looking statements are subject to certain risks and uncertainties that could cause actual results and achievements to differ materially from those expressed in the forward-looking statements. For more information about these forward-looking statements and related risks, please link to Risk Factors under Shareholder Information on this website and refer to the section titled "Forward-looking Statements" in Part I of the Company's Annual Report on Form 10-K.
REMARKS BY THOMAS O. MIGHT
President and Chief Executive Officer
Cable ONE
I have arranged my comments for you today into four parts. The first
three cover creating shareholder value, and the last summarizes some risks
to that value that bear watching.
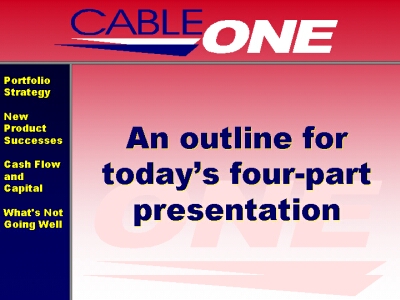
· The brief portfolio discussion will remind you what cable assets The Washington Post Company owns, along with why and how we got to this particular set of cable systems.
· Most of my time this morning will be spent on our new products, making sure you understand our successful and profitable accomplishments in digital cable and cable modems
· My cash flow and capital spending comments will give you a high level historical review of our long-term growth in cash flow and capital spending and what results they have had on free cash flow.
· Last, I will focus on three trends that are not going so well
and risk weakening the core analog video franchise. That would dampen
some of the value creation that I will be describing in parts 1, 2 and
3.

We have added a couple hundred thousand basic customers, at a net cost
below $1,500 each, through numerous trades and acquisitions over the past
six years. I think that is below anyone else's net cost during that period.
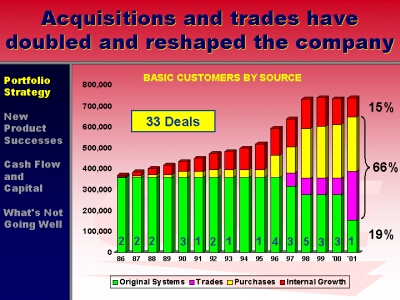
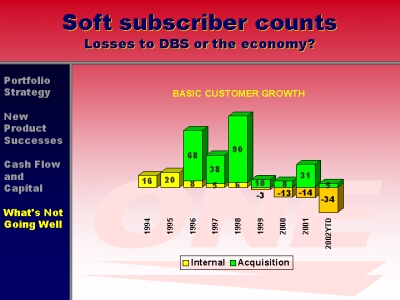
This chart summarizes the 33 deals by year and source. The green bars represents the original 350,000 cable customers that Katharine Graham and Dick Simmons bought from Capital Cities back in 1986. The bars go down as we traded several of those original systems for systems with better strategic and geographic fit. The blue number at the bottom of each green bar represents the number of deals that we did that year. Until 1996, the deals were all very small.
The pink bars represent customers received back in trade deals. In 1994, we decided to focus on large non-metro systems. We are unique in the industry with this focus. We chose these systems because we believe they are less competitive and less capital intensive to run well. So far we have been right.
Eight of the original systems were in metro markets, like San Francisco and Chicago. We have successfully traded away seven of those eight metro systems for attractive non-metro systems.
The yellow bars represent all of the customers that we have purchased, primarily in 1996, 1997 and 1998. Then Paul Allen entered the market with Charter, and the average price per customer doubled to over $4,000. We have been sitting patiently on the acquisition sidelines ever since.
The red bars represent the internal growth, which you can see has been flat to negative the last few years. We will revisit that in the last part of today's presentation as one of the trends not going so well.
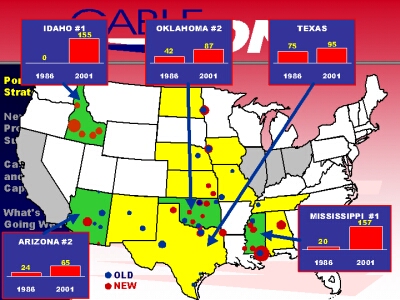
This map demonstrates the change and the geographical focus that we have attained so far. The red dots represent systems that have come on board after the original 1986 Cap Cities purchase.
We have carved out a significant #1 or #2 presence in the four green states, and they make up the majority of our customers.
· Mississippi is our largest state, and we are the largest operator in that state.
· Idaho is our second largest state, and we have 70% of all the cable customers in the state.
· Texas is our third largest state, even though we have traded out of several Texas systems.
· Oklahoma is our fourth largest state, and we are #2 in the state.
· And Arizona is our fifth largest state, where we are also #2.
There are still significant large, but non-metro, markets that we would
like to acquire some day in all four green states when the price is right.
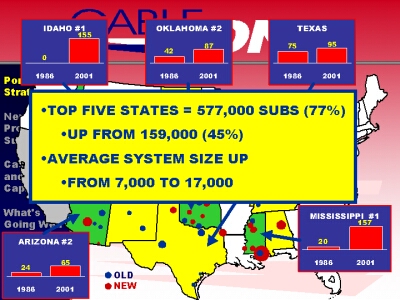
As a result of these deals and fiber optic interconnection of many systems, our geographic concentration and average headend size have improved considerably as you can see. We actually have fewer systems today than we had in 1986, even with twice the number of customers.
For the first fourteen years we just tried to sell more of the same two old products, basic and premium channels, to more homes. Heck, we didn't even have or need a marketing department when I moved to Cable ONE in 1993. In the past two years, cable marketing has definitely become an E-ticket ride!
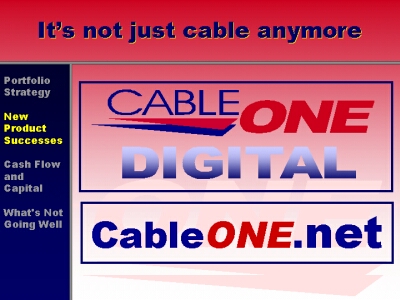
With the introduction of digital cable and high-speed Internet through
cable modems, it is not just cable anymore. These are our brand names
and logos for these two new and exciting products.
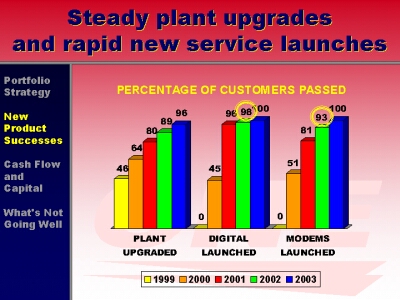
We have almost finished upgrading our plant to 550MHz or greater as you can see.
For digital cable, I need to remind you that we were the next to last top ten MSO to launch, but then launched explosively to the entire customer base in about nine months. And we gave digital away free to any willing customer for 12 months. More on how that turned out in a moment.
We were the very last of the top ten MSOs to launch cable modems. But again, we launched the entire MSO so rapidly, that we attained the highest or second highest modem availability in the industry by this time last year.
We are quite proud that our small, non-urban MSO is leading the industry with virtually universal deployments of these twin digital products
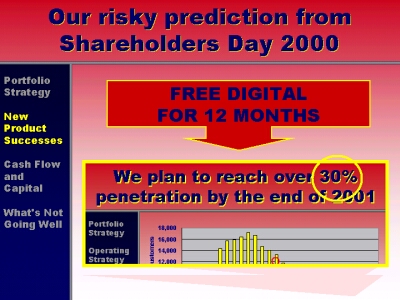
Here is the slide from our meeting two years ago with the risky prediction that our free digital concept could deliver 30% penetration in just 15 months - even though the industry average at that time was only 10% after two or three years.
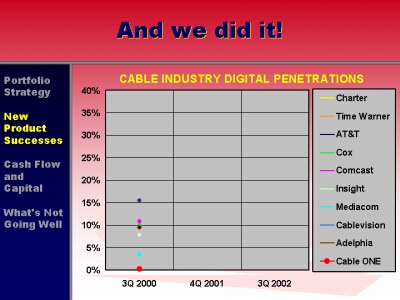
And we did it! I will show our performance against the industry for three time slots.
· This is where we stood at the last Shareholders Meeting with no penetration (we are the red dot at the bottom).
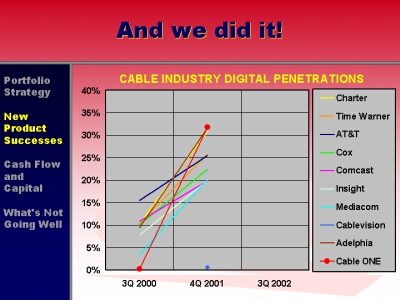
· Zoom ahead five quarters to the end of 2001 and you can see we made it. In fact we led the industry at that moment with 32% penetration.

· Zoom ahead again to last quarter, and you can see we have managed to hold 30% penetration as digital customers have started paying throughout the year. Retention rates have been pretty good.
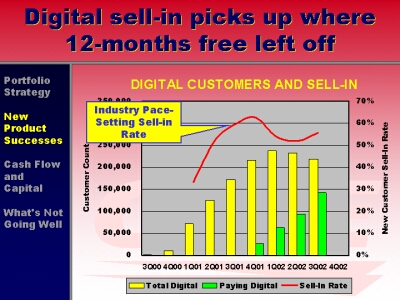
These yellow bars show the rapid run-up to over 200,000 digital customers with the free offer. The green bars show the total paying digital subs. It lags 12 months behind, of course. As of last week, 80% of digital is paid for and virtually all will be paid for by the end of the year. Free digital was a major success.
But now, on the right axis, I would like to show another major digital
success. Digital sell-in is 55% to new Cable ONE customers. That means
that 55 out of every 100 new customers signing up for basic cable service
agree to take Digital Cable as well. This is a tremendous performance
by our customer sales reps that we also think leads the industry. With
the free launch behind us, sell-in will be the 1st, 2nd and 3rd most important
factors in digital penetration and cash flow.
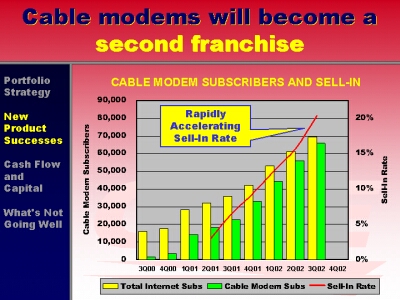
Now let's look at a similar chart for cable modems, and please stop me if I get too excited, because cable modems should create a second franchise as valuable as the original video franchise. These bars show our quarterly numbers since the last Shareholders Day Meeting. Notice the accelerating rate of growth. The green bars are cable modem customers. The yellow bars are cable modem customers plus our dial-up customers, almost all of who have been converted to high-speed cable modems at this point.
Look at this cable modem sell-in momentum! Using the right scale for
the red sell-in line, you can see that the modem sell-in rate is skyrocketing
upward. In fact, it is increasing 5% per quarter right now. Last quarter
21 out of every 100 new basic cable subscribers signed up for a cable
modem the same day they signed up for basic cable. The quarter before
only 16 of 100 did so. This product is hot and no one knows how high the
numbers will go.
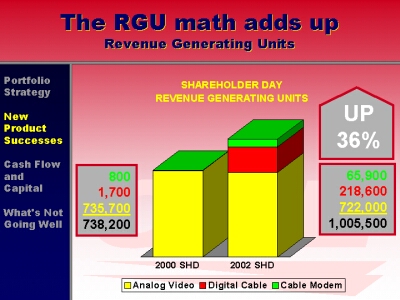
An RGU is a Revenue Generating Unit. The industry has agreed to start reporting RGUs every quarter beginning next year. The left bar plainly shows that we were still a one-product company back at Shareholders Day 2000, but look at us now -- over 1 million RGUs and up 36% between Shareholders Meetings.
However, not all RGUs are created equal. While digital cable offers immediate
boxcar numbers and a short-term shield against DBS, it is the cable modem
that promises the cash flow growth needed to sustain the business indefinitely
and provide the superior long-term shield against DBS.
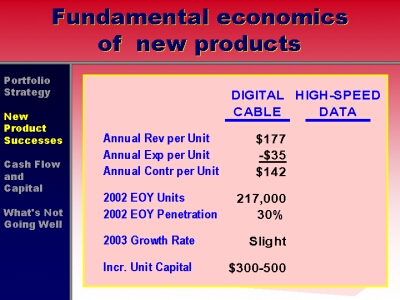
The annual contribution of digital cable is over $142 per digital customer. By comparison, the total cash flow per basic customer before digital and modems came along was only $195 in 2000, so you can imagine the quick cash flow lift that 30% digital penetration brings. However, we expect modest growth going forward, and the incremental capital cost runs anywhere between $300 and $500 per customer.
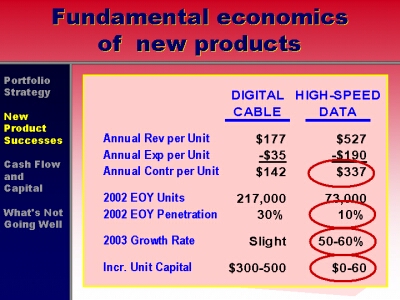
A cable modem customer on the other hand generates over $300 of contribution per year on average and requires only $0 to $60 of capital. Our penetration right now is only 10% of basic customers, but total on-line usage in our markets, including dial-up, is over 50% and moving up about 8% per year. In the competition against DSL to convert that massive base of dial-up customers to high-speed, we are winning 4 to 1.
Only the government could mess up something working this well. And there
are many proposals to do so under the guise of "digital divide"
and "broadband economic stimulus". I have lost count of the
senators and congressmen with broadband legislative proposals.
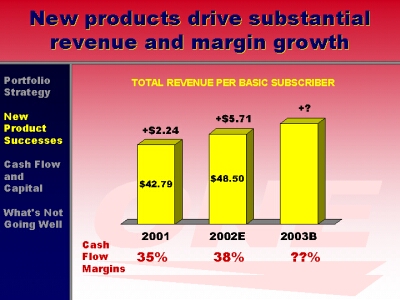
Total revenue from these terrific products will be in the $75 to $85 million range next year, up from zero two years ago, and still growing. We are seeing year-over-year revenue growth of $5 per basic customer since launching digital cable and cable modems. We expect something similar going forward.
Cash flow margins are on the rise again, moving from an all-time low
of 35% to 38% this year and hopefully up again next year.
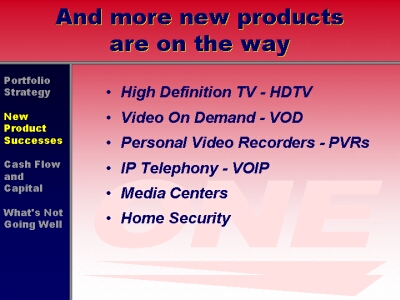
There are more new products to launch in the years ahead. As always, we will make a cautious trade-off between capital, revenue and competitive timing before rushing to launch any of them. The capital-revenue-competitive mix is very different for each opportunity. Here are some of the better-defined future products:
· High Definition TV
· Video On Demand
· Personal Video Recorders
· IP Telephony
· Media Centers
· Home Security

So how does all this acquisition strategy and new product strategy add up? Wall Street's nervous answers to these questions have been plaguing cable stocks since the beginning of the year when Adelphia Cable fell from grace. So let's look at our 17-year history of cash flow and capital.
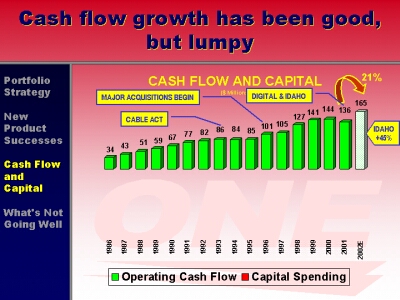
Cash flow is up about 400% since The Washington Post Company entered cable, while the customer base is up about 100%. But is has been lumpy or uneven.
· First there was the Cable Act, which reduced rates by 17% in 1993.
· Then there was the acquisition of about 250,000 new customers between 1996 and 1998.
· Then there was the free launch of digital and the trade for underperforming Idaho systems last year that temporarily crimped cash flow.
· Of course, this year we are enjoying the reciprocal benefits as 200,000 digital customer start paying, and as
· Idaho cash flow jumps by 45% in one year.
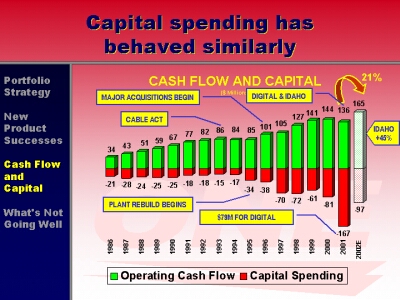
Capital spending has behaved similarly. Once plant rebuilds began in 1995, and 250,000 new subs started arriving in 1996, capital spending was destined to run at a much higher level.
Then, an incremental $70 million to support the launch of free digital
in 2001 caused an enormous one-year spike. I will come back to capital
in more detail in one minute. First I want to graphically show the net
free cash flow by year, if you subtract the red capex from the green operating
cash flow.
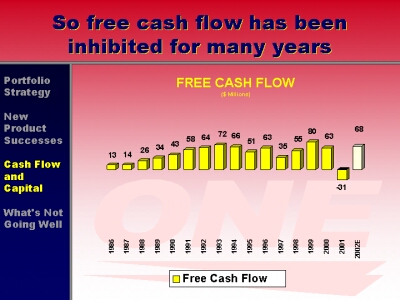
You get the free cash flow depicted by these yellow bars. You cannot help but notice how the plant rebuilds have inhibited free cash flow growth, and that huge digital spending in 2001 produced our one and only year of negative free cash flow.
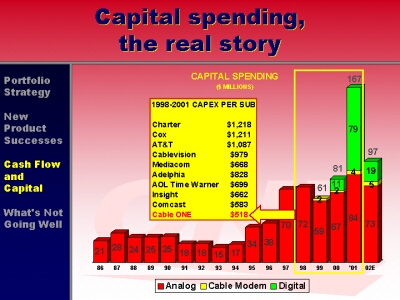
To help you understand the real capital spending story I need to break it down by component and compare it to industry spending levels.
The red bars represent analog plant spending. The big bulge is the nine-year rebuild cycle that we will complete next year. The on-going analog plant support capital will be in the $25-35 million range after the rebuilds end.
As you can see, the tiny yellow bars demonstrate how minimal and attractive the cable modem capital demands are. However, bear in mind that without the expensive analog plant rebuilds, cable modems would not even be an option. But modems have become the perfect add-on service.
In contrast, digital is capital intensive. Until recently, standard digital receivers cost $280 and HDTV receivers will cost around $400. And on the average, a customer has 1.3 digital receivers. Not cheap!
We are disappointed that the 2002 spending has not fallen faster. We originally expected to beat 2001 spending by $100 million, but the final cost of the digital rollout and the cost of upgrading house drops for new services ran higher than anticipated.
However, you should know that this capital spending record represents
the best track record in the industry. Beginning in 1998, we have tracked
the capital spending per basic customer across the ten largest MSOs as
closely as public reporting has allowed. For the four years, 1998 to 2001,
we had the lowest spending in the industry at $518 per basic customer.
The capex range is enormous, as you can see.
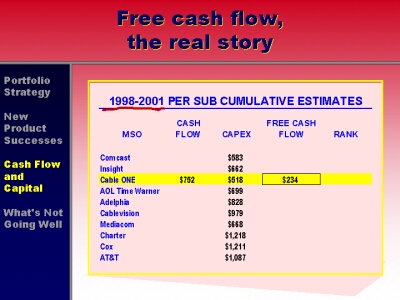
Allow me to take the analysis one step further to an industry comparison of free cash flow. The four-year capex numbers here are from the previous slide. I have added Cable ONE's operating cash flow of $752 per basic customer and the resultant $234 of free cash flow.
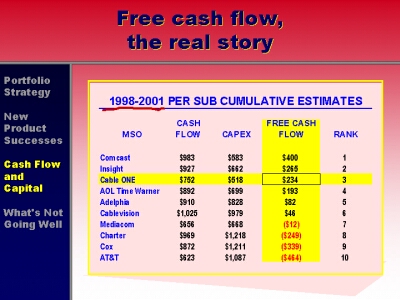
When you fill out the chart, here is how the four-year free cash flow turns out. Comcast leads the group, followed by three of us in a similar $200 - $300 range, with Cable ONE being third overall. Not bad for a small MSO that is supposed to lack economies of scale.
I will close with three issues that are not going so well. They can potentially erase some of the great new product valuation growth previously discussed, if not stopped.
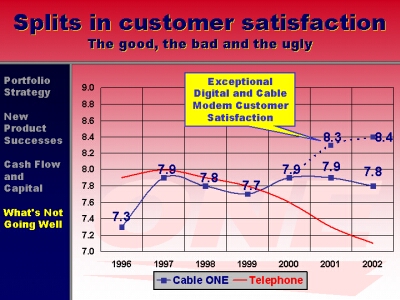
There are at least three different customer satisfaction stories. I will refer to them as the good, the bad and the ugly. These measures are based on 1,000 customer surveys per month. Customers rank their satisfaction on a scale of 1 to 10, with 10 being best and 1 being worst.
We began taking customer satisfaction very seriously in 1997, and you can see the immediate jump in satisfaction. What you don't see is any sustained improvement after that. This is the "bad" satisfaction story.
For contrast, here is how our customers rated their telephone company satisfaction during this period. Now this is a really "ugly" satisfaction trend - for them, not for us! We have essentially traded places with the telephone companies from 1996 to 2002. Since their DSL product is our only meaningful competitor for the new high-speed data franchise, this has enormous cash flow implications.
Here is the "good" customer satisfaction story. The 40% of our customers with digital cable and/or cable modem service rate their satisfaction with those products at an amazing 8.3 to 8.4. Experience with other brand research shows that this level of brand satisfaction is rare and a very defensible position versus DBS.
The story here is that we focused so successfully on launching our new
services that we lost our focus on satisfaction with our core analog customer
base, and their decline in satisfaction offset the rise with digital cable
and cable modem customers - a sad story but true. So we will go back on
fundamental satisfaction issues in the year ahead.
We reported a substantial basic customer drop in the 2nd and 3rd quarters that has us down 34,000 total for the year and has us very concerned. Since 1999 we have been fighting the effects of a severely weakening economy in most of the smaller markets where we have customers. These markets are much worse off than urban markets and the nation as a whole.
Our disconnects for non-payment of service are up 62% which equals 31,000 additional bad debt disconnects in just 2002 alone. This delinquency is exacerbated by the $11 jump in average revenue per customer due to digital cable and cable modems. You can see the nasty results.
This customer slide is also more acute in Idaho where several waves of product and pricing changes were necessary to fix the ailing AT&T systems that we picked up last year. Fortunately, cash flow is up 45% there, and all the changes are behind us.
A very important question is "How much of the loss is due to competitive
erosion to DBS versus the economy?"
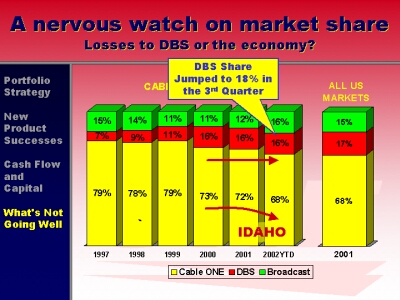
Based on our continuous market research since 1997, we know a lot. Cable ONE market share is yellow; DBS is red; and broadcast is green. (That would be homes that still use only an antenna to pick up free broadcast TV signals.) In the first three years shown, DBS share grew at the expense of free broadcast share. Then, in 2000, DBS share jumped to 16% at our expense.
In late 2000, we started our broad digital cable and cable modem rollout, and DBS share went flat for two years even though we started losing customers. Where did they go? Back to free broadcast reception, which started growing again. This is all very consistent with the bad economy and surge in non-pay disconnects.
I should also point out that some of the share change in 2001 and 2002 is due to the Idaho systems being added to the research. Idaho cable penetration is only 60% and brings down our average.
Based on these share trends and our surge in non-pay disconnects, I would normally assume our major customer challenge is the economy. For nine quarters we had lost share to free broadcast, but not DBS. But last quarter, DBS's share jumped to 18%. Occasionally, we can get a statistical bounce like this in the research for one quarter, but for now we assume this is a real slippage that we need to address. We have several major actions under way to slow or reverse any possible trend here in 2003.
For another comparison, here was the national market share in 2001. Very
close to where we are in 2002.
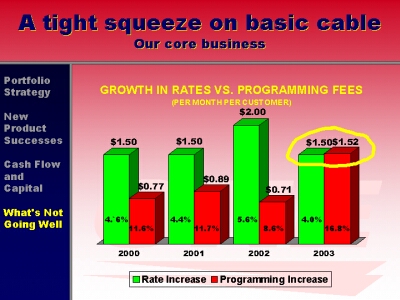
The third item on long-term watch is the profitability squeeze on basic cable, our core business. Here you can see our annual rate increases to our customers for basic cable since 2000 - a modest $1.50, except this year when over half our customers tried our free digital. We bumped it to $2.00.
Here are the programming fee increases that we have had to pay for basic programming. We need a 50 to 60¢ spread to cover our other fixed cost growth. What is left can go to cash flow growth and to recoup our capital spending.
Notice the squeeze in 2003. We have contracts for ten networks from three programming groups expiring at the end of this year.
· One programmer wants a 32% increase, mostly due to sports rights fees
· Another wants a 16% increase, partially driven by sports rights fees
· And the head of the third programmer, Mr. Diller, is on our board of directors, so I am smart enough to pass up commenting on that one.
· It is also well known that the Disney Company has raised ESPN's fees by 20% for four straight years due to sports rights fees. That contract does not expire, but those increases must be paid as well.
By the way, the Nielson ratings for almost all of this sports programming
continue to slide almost every year while rates go up. The system is broken,
and we are likely to start seeing more drastic measures like the loss
of the Yankees games to over 3 million Cablevision customers in New York
last season.
And now for a quick review of the highlights to put these negative trends back into perspective.
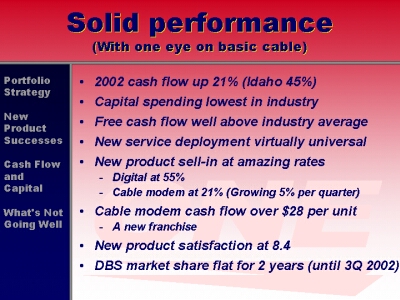
The performance has been solid, but we have one eye trained on the basic cable category.
· 2002 cash flow is up 22% (Idaho 45%)
· Capital spending is the lowest in industry
· Free cash flow is well above industry average
· New service deployment is virtually universal
· New product sell-in is at amazing rates
o Digital sell-in is 55%
o Cable modem sell-in is 21% and increasing 5% per quarter
· Cable modem cash flow is over $28 per unit
o And quickly becoming a second franchise
· New product satisfaction is an impressive 8.4
· DBS market share was flat for 2 years until 3rd quarter 2002
The Cable ONE company flag caused such a stir at the first Shareholders Meeting that I brought it back for an encore and a close.
Thank you.
# # #