| ($000, except per share data) |
2000(1)
|
1999
|
1998
|
 |
| Operating Results |
|
|
|
|
|
|
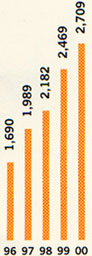
| Sales |
$
|
2,709,039
|
$
|
2,468,638
|
$
|
2,182,361
|
| Earnings before taxes(3) |
|
249,186
|
|
246,479
|
|
219,415
|
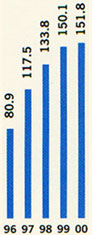
| Net earnings(3) |
|
151,754
|
|
150,106
|
|
133,843
|
| Earnings per diluted common share(2,3) |
$
|
1.82
|
$
|
1.64
|
$
|
1.40
|
|
| Financial Position |
|
|
|
|
|
|
| Total assets |
$
|
975,047
|
$
|
947,678
|
$
|
870,306
|
| Long-term debt |
|
30,000
|
|
0
|
|
0
|
| Working capital |
|
197,004
|
|
190,724
|
|
170,795
|
| Current ratio |
|
1.5:1
|
|
1.5:1
|
|
1.4:1
|
| Long-term debt as a percent of total capitalization |
|
6%
|
|
0%
|
|
0%
|
| Stockholders' equity |
|
467,547
|
|
473,431
|
|
424,703
|
|
| Operating Statistics |
|
|
|
|
|
|
| Diluted shares (000)(2) |
|
83,337
|
|
91,671
|
|
95,700
|
| Net earnings as a percent of sales(3) |
|
5.6%
|
|
6.1%
|
|
6.1%
|
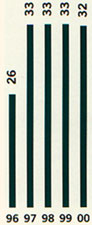
| Return on average stockholders' equity |
|
32%
|
|
33%
|
|
33%
|
| Comparable store sales increase |
|
1%
|
|
6%
|
|
3%
|
| Number of stores at year-end |
|
409
|
|
378
|
|
349
|
|
|