Management's Discussion and Analysis of Financial Condition and Results of Operations
The following discussion should be read in conjunction with the consolidated financial statements and notes thereto.
Results of Operations
The following table sets forth certain data from the Company's consolidated income statements for the years ended December 31, 1999, 1998 and 1997, expressed as a percentage of net revenue:
Years ended December 31 1999 1998 1997
____________________________________________________________________________________Net revenue 100.0% 100.0% 100.0%
Cost of sales 77.8 77.4 85.2 ------------------------------
Gross profit 22.2 22.6 14.8
Selling, general and administrative expense 11.5 13.3 12.3
Research and development 3.2 2.8 1.6
Amortization of intangible assets 0.5 0.4 0.1
------------------------------
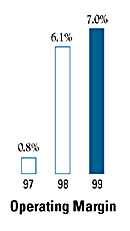
Operating income 7.0% 6.1% 0.8%
==============================
Income from continuing operations 4.7% 3.5% 0.7%
==============================
Net income 4.7% 3.5% 2.5%
==============================
Year Ended December 31, 1999 Compared to Year Ended December 31, 1998
Net revenue
totaled $202.1 million in 1999, a decrease of $9.5 million, or 4.5%, from
$211.6 million in 1998. Net revenue for the Electronics Group in 1999
was $164.9 million, a decrease of $9.5 million or 5.4% from $174.4 million
in 1998 and net revenue for the Industrial Group in 1999 was $37.2 million,
unchanged from 1998. The $9.5 million decrease in the Electronics Group's
net revenue for 1999 was primarily a result of reduced demand for certain
product offerings. During the fourth quarter of 1999, a portion of the
government program funding related to these products was delayed due to
the timing of the federal budget approval process and certain other program
spending was suspended prior to year-end due to year 2000 concerns. The
decrease in net revenue for product sales in the fourth quarter of 1999
was offset by an increase in net revenue for manufacturing services, which
experienced increased sales volume during the second half of 1999. The
Electronics Group's net revenue for the first half of 1999 was $15.8 million
below the first half of 1998. However, net revenue increased in the third
and fourth quarters of 1999 by $1.3 million and $5.0 million, respectively,
over the comparative prior year quarters. The growth that occurred during
the second half of 1999 is primarily the result of management's business
development efforts in manufacturing services that began during 1998,
specifically the transition from low-margin contracts to new business
opportunities aimed at improving profitability. The Electronics Group's
backlog increased from $76.7 million to $95.2 million to $107.7 million
at December 31, 1997, 1998 and 1999, respectively. The current backlog
also consists of higher margin contracts than those in place during 1998.
The Industrial Group continued to increase shipments of truck axles during
1999, thereby offsetting declines in other forged product lines provided
to customers in the aerospace industry and foreign markets of the oil
and gas industry.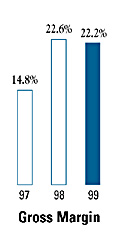
Gross
profit totaled $44.9 million in 1999, a decrease of $3.0 million, or 6.3%,
from $47.9 million in 1998. Gross profit for the Electronics Group was
$37.9 million in 1999, a decrease of $3.5 million, or 8.5%, from $41.4
million in 1998 and gross profit for the Industrial Group was $7.0 million
in 1999, an increase of $0.5 million, or 8.5%, from $6.5 million in 1998.
The $3.5 million decrease in the Electronics Group's gross profit is comprised
of a $4.7 million decrease primarily due to the decline in product sales
described above, which was partially offset by a $1.2 million increase
primarily due to the improved performance of manufacturing services. Operational
and financial control improvements over manufacturing services reflects
management's actions to improve profitability
by focusing on specific manufacturing and service opportunities in which
the Company offers value-added solutions under a competitive cost structure.
Additionally, the Electronics Group's revenue mix for 1999 as compared
to 1998 consisted of a higher percentage of manufacturing services revenue
and a lower percentage of product sales, primarily due to revenue mix
changes during the fourth quarter of 1999. Since the margins on manufacturing
services are typically lower than product sales, the Electronics Group's
gross profit percentage decreased to 23.0% in 1999 from 23.7% in 1998.
The $0.5 million increase in the Industrial Group's gross profit is primarily
due to manufacturing efficiencies in the production of forged truck axles
and the increased capacity utilization and cost reductions on certain
programs. The productivity and utilization improvements resulted in an
increase in the Industrial Group's gross profit percentage to 19.0% in
1999 from 17.5% in 1998.
 Selling,
general and administrative expense totaled $23.4 million in 1999, a decrease
of $4.8 million, or 17.1%, from $28.2 million in 1998. The consolidation
of certain functional activities was the primary cause of the decrease
in the year-to-year comparison. Other contributing factors include workforce
reductions in certain operations, a reduction in selling expense attributable
to the decrease in net revenue, and adjustments to the Company's estimated
liability for the sale of certain assets of the Electronics Group in June
1997, for which a final settlement agreement was reached during the second
quarter of 1999. Also included in 1998 were professional fees and other
costs associated with the Reorganization which were nonrecurring. Research
and development expense totaled $6.4 million in 1999, an increase of $0.5
million, or 7.9%, from $5.9 million in 1998. This increase was generated
by the Electronics Group, and reflects management's continued support
and investment in the data acquisition, storage and analysis product lines.
Selling,
general and administrative expense totaled $23.4 million in 1999, a decrease
of $4.8 million, or 17.1%, from $28.2 million in 1998. The consolidation
of certain functional activities was the primary cause of the decrease
in the year-to-year comparison. Other contributing factors include workforce
reductions in certain operations, a reduction in selling expense attributable
to the decrease in net revenue, and adjustments to the Company's estimated
liability for the sale of certain assets of the Electronics Group in June
1997, for which a final settlement agreement was reached during the second
quarter of 1999. Also included in 1998 were professional fees and other
costs associated with the Reorganization which were nonrecurring. Research
and development expense totaled $6.4 million in 1999, an increase of $0.5
million, or 7.9%, from $5.9 million in 1998. This increase was generated
by the Electronics Group, and reflects management's continued support
and investment in the data acquisition, storage and analysis product lines.
Amortization of intangible assets totaled $1.0 million
in 1999 and in 1998. The amortization is primarily attributable to goodwill
recorded in connection with the Reorganization.
Interest expense totaled $1.7 million in
1999, an increase of $0.4 million, from $1.3 million in 1998. Average
outstanding debt for 1999 exceeded 1998 primarily due to working capital
investments and capital expenditures. The weighted average interest rate
was higher in 1999 than in 1998 due to increased rates and a pricing adjustment
on the refinancing completed early in the fourth quarter of 1999.
The provision for income taxes totaled $3.1 million in 1999, a decrease of $1.2 million, from $4.3 million in 1998. The Company's effective tax rate in 1999 was 24.5% as compared to 36.7% in 1998. During the fourth quarter of 1999, the Company recognized a tax benefit of approximately $0.6 million related to a claim for research and development credits attributable to prior years. The provision for income taxes during 1999 also reflects a reduction in the valuation allowance on deferred tax assets of $1.9 million as compared to $0.9 million in 1998.
Year Ended December 31, 1998 Compared to Year Ended December 31, 1997
Net revenue totaled $211.6 million in 1998, a decrease of $5.8 million, or 2.6%, from $217.4 million in 1997. The Electronics Group experienced a decrease in net revenue of $11.5 million, while the Industrial Group experienced an increase of $5.7 million. The $11.5 million decrease in the Electronics Group's net revenue resulted from the divestiture of the Company's Latin American operations, which accounted for net revenue of $16.9 million in 1997, and a decrease in net revenue from manufacturing and technical services of $10.4 million partially offset by an increase in product sales of $15.8 million. The $10.4 million decrease in manufacturing and technical services revenue is primarily attributable to management's actions to redirect its resources to pursue low-volume, high-mix, complex industrial electronics assembly and test opportunities which meet specific profitability targets. The $15.8 million increase in product sales includes the acquisition of certain assets of Datatape Incorporated in November 1997 (the "Datatape Acquisition") which expanded the Company's data acquisition, storage and analysis product line and generated a $24.8 million increase in net revenue in 1998. The balance of the Electronics Group's product offerings experienced a $9.0 million decline in net revenue primarily due to a weakening of demand in domestic and Asian markets. The $5.7 million increase in the Industrial Group's net revenue resulted primarily from an increase in shipments to a customer based upon its commitment to use the Company as its sole source for truck axles in its North American market.
Gross profit totaled $47.9 million in 1998, an increase of $15.8 million, or 49.1%, from $32.1 million in 1997. The Electronics Group and the Industrial Group accounted for $14.3 million and $1.5 million of the increase in gross profit, respectively. The Electronics Group's gross profit was $41.4 million in 1998, an increase of $14.3 million, or 52.9%, from $27.1 million in 1997. The $14.3 million increase in gross profit was achieved while net revenue for the Electronics Group declined by $11.5 million to $174.4 million, reflecting the change in revenue mix described above. Gross profit of the Electronics Group expressed as a percentage of net revenue increased to 23.7% in 1998 from 14.6% in 1997. The increased product sales volume and improved cost management controls over higher margin manufacturing services contracts accounted for approximately $5.7 million and $7.7 million of the increase in gross profit, respectively. The Industrial Group's gross profit was $6.5 million in 1998, an increase of $1.5 million, or 29.0%, from $5.0 million in 1997, primarily due to the volume increase reflected in net revenue. Gross profit of the Industrial Group expressed as a percentage of net revenue increased to 17.5% in 1998 compared to 16.1% in 1997, primarily related to increased capacity utilization and cost reductions on certain programs.
Selling, general and administrative expense totaled $28.2 million in 1998, an increase of $1.5 million, or 5.7%, from $26.7 million in 1997. The change in revenue mix occurring in the Electronics Group resulted in an increase in selling, general and administrative expense for the comparable years.
Research and development expense totaled $5.9 million in 1998, an increase of $2.4 million, or 70.3%, from $3.5 million in 1997. This increase was generated by the Electronics Group, and reflects management's continued support and investment in the data acquisition, storage and analysis product lines.
Amortization of intangible assets totaled $1.0 million in 1998, an increase of $0.8 million, from $0.2 million in 1997. This increase is due to the amortization of goodwill recognized in connection with the Reorganization and the Datatape Acquisition.
Interest expense totaled $1.3 million in 1998, a decrease of $0.7 million, from $2.0 million in 1997. This decrease is primarily due to a reduction in the weighted average debt outstanding, a reduction in the Company's overall costs of borrowing and a decrease in amortization expense for debt issuance costs and stock warrants issued to a previous lender. The reduction in debt outstanding in 1998 compared to 1997 is attributable to the repayment of debt from proceeds generated by the divestiture of the Latin American operations, coupled with repayments generated by the Company's improved cash flow from operations in 1998, partially offset by the debt incurred to finance the Datatape Acquisition. The divestiture proceeds were used to repay in full a credit facility on which the effective interest rate was approximately 300 basis points over the Company's cost of borrowing under its consolidated credit facility during 1998.
Other income totaled $0.2 million in 1998, a decrease of $2.0 million, from $2.2 million in 1997. Other income in 1997 included the gain recognized on the divestiture of the Latin American operations totaling $3.2 million.
The provision for income taxes totaled $4.3 million,
an increase of $3.2 million, from $1.1 million in 1997. The Company's
effective tax rate in 1998 was 36.7%.
Liquidity, Capital Resources and Financial Condition
Net cash used in operating activities totaled $2.1 million in 1999 as compared to net cash provided by operating activities of $11.0 million in 1998. The use of cash in operating activities during 1999 was primarily driven by an increase in inventory to support the growth in the Company's order backlog and a decrease in accrued liabilities attributable to cash used to settle or reduce obligations. Inventory increased by $11.3 million during 1999, $11.0 million of which was associated with the expected shipment schedule for the Electronics Group. Accrued liabilities decreased by $6.7 million during 1999, which includes, among other things, the final settlement payment made during the second quarter with respect to the June 1997 asset divestiture transaction, reductions in employee incentive and benefit accruals, and payments on lease obligations. Accounts receivable decreased by $2.6 million during 1999, primarily due to an improvement in days sales outstanding.
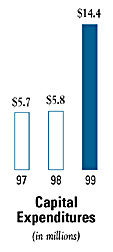 Net
cash used in investing activities totaled $26.4 million in 1999 as compared
to $5.8 million in 1998. Capital expenditures were $14.4 million and $5.8
million in 1999 and 1998, respectively. The Company also invested $11.6
million for two acquisitions by the Electronics Group. Capital expenditures
by the Electronics Group and the Industrial Group for 1999 were $6.3 million
and $7.1 million, respectively. Capital expenditures for the Electronics
Group include information system upgrades and
replacements as well as manufacturing, assembly and test equipment. The
Industrial Group's capital expenditures relate primarily to increasing production
capacity to meet the expanding needs of its customer base. At December 31,
1999, the Industrial Group also had commitments to invest $1.4 million in
manufacturing equipment to further increase production capacity, which is
expected to be funded through the Company's cash balances and borrowings
under its revolving credit facility. The Company expects total capital expenditures
in 2000 to be approximately $25.0 million.
The planned capital expenditures are for facilities and equipment to increase
capacity, expand production capabilities and improve efficiency through
automation.
Net
cash used in investing activities totaled $26.4 million in 1999 as compared
to $5.8 million in 1998. Capital expenditures were $14.4 million and $5.8
million in 1999 and 1998, respectively. The Company also invested $11.6
million for two acquisitions by the Electronics Group. Capital expenditures
by the Electronics Group and the Industrial Group for 1999 were $6.3 million
and $7.1 million, respectively. Capital expenditures for the Electronics
Group include information system upgrades and
replacements as well as manufacturing, assembly and test equipment. The
Industrial Group's capital expenditures relate primarily to increasing production
capacity to meet the expanding needs of its customer base. At December 31,
1999, the Industrial Group also had commitments to invest $1.4 million in
manufacturing equipment to further increase production capacity, which is
expected to be funded through the Company's cash balances and borrowings
under its revolving credit facility. The Company expects total capital expenditures
in 2000 to be approximately $25.0 million.
The planned capital expenditures are for facilities and equipment to increase
capacity, expand production capabilities and improve efficiency through
automation.Net cash provided by financing activities was $26.5 million in 1999 as compared to net cash used in financing activities of $2.6 million in 1998. The Company funded the Electronics Group's acquisitions, the investment in working capital and capital expenditures in 1999 through additional borrowings under its revolving credit facility.
 Under
the terms of the credit agreement between the Company and its lenders,
the Company had total availability for borrowings and letters of credit
under its revolving credit facility of $45.6 million at December 31, 1999,
which, with certain limitations, can be used for general corporate purposes.
This credit agreement contains customary restrictive covenants, including
covenants requiring the Company to maintain certain financial ratios.
Maximum borrowings on the revolving credit facility are $100.0 million,
subject to a $15.0 million limit for letters of credit.
Under
the terms of the credit agreement between the Company and its lenders,
the Company had total availability for borrowings and letters of credit
under its revolving credit facility of $45.6 million at December 31, 1999,
which, with certain limitations, can be used for general corporate purposes.
This credit agreement contains customary restrictive covenants, including
covenants requiring the Company to maintain certain financial ratios.
Maximum borrowings on the revolving credit facility are $100.0 million,
subject to a $15.0 million limit for letters of credit.
The Company believes cash generated from operations, existing cash reserves and available borrowings under its existing credit facility will satisfy the Company's working capital and capital expenditure requirements for at least the next twelve months.
Year 2000 Compliance
During 1999, the Company completed the process of preparing for the Year 2000 date change. This process involved assessing, testing and remediation of all significant information technology ("IT") and non-IT systems, identifying and communicating with customers, suppliers and other critical service providers to determine if entities with which the Company transacts business had an effective plan in place to address the Year 2000 issue, and determining the extent of the Company's vulnerability to the failure of third parties to remediate their own Year 2000 issue.
To date, the Company has not experienced any significant business disruptions as a result of the Year 2000 issue. In addition, the Company has not been informed of any such problems experienced by its customers, suppliers and other critical service providers. Although considered unlikely, it is too soon to conclude that there will not be any problems arising from the Year 2000 issue, particularly at some of the Company's customers, suppliers and other critical service providers. The Company will continue to monitor all business processes throughout 2000 to address any issues and ensure all processes continue to function properly. Contingency plans to address potential risks in the event of Year 2000 failures will be developed as needed.
As of December 31, 1999, the cost of the Year 2000 project totaled $1,024,000. The Company does not expect to incur significant costs during 2000 related to ongoing monitoring and support activities for the Year 2000 issue.
Market Risk
The Company had no holdings of derivative financial or commodity instruments at December 31, 1999. The Company is exposed to financial market risks, including changes in interest rates and foreign currency exchange rates. All borrowings under the Company's credit agreement bear interest at a variable rate based on the prime rate, the London Interbank Offered Rate, or certain alternative short-term rates. An increase in interest rates of 100 basis points would not significantly affect the Company's net income. Substantially all of the Company's business is transacted in U.S. dollars. Accordingly, foreign exchange rate fluctuations have never had a significant impact on the Company, and they are not expected to in the foreseeable future.
Consolidated Income Statements
Consolidated Statements of Cash Flows
Consolidated Statements of Shareholders' Equity
Notes to Consolidated Financial Statements 1
Notes to Consolidated Financial Statements 2
Notes to Consolidated Financial Statements 3
Report of Independent Auditors