
Management's discussion and analysis
Property-Liability Insurance
Investment Operations
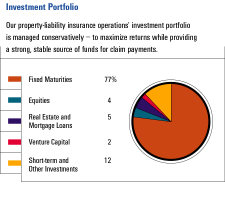
Our primary investment objective is to maintain a high-quality portfolio designed to maximize investment returns and generate sufficient liquidity to fund our cash disbursements. To that end, we deploy the majority of funds available for investment in a widely diversified portfolio of predominantly investment-grade fixed maturities. We also invest lesser amounts in equity securities, venture capital, real estate and mortgage loans with the goal of producing long-term growth in the value of our invested asset base and ultimately enhancing shareholder value. The latter investment classes have the potential for higher returns, but also involve a greater degree of risk, including less stable rates of return and less liquidity. Funds to be invested can be generated by underwriting cash flows, consisting of the excess of premiums collected over losses and expenses paid, and investment cash flows, which consist of income on existing investments and proceeds from sales and maturities of investments.
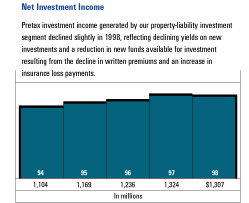
Pretax investment income produced by our property-liability investment segment totaled $1.31 billion in 1998, down slightly from income of $1.32 billion in 1997. Our underwriting cash flows in 1998 were negatively affected by the combination of a 3% decline in written premiums and a 6% increase in loss and loss adjustment expense payments. Funds available for investment were reduced further in 1998 by cash outflows resulting from the USF&G merger, primarily severance and other employee-related expenses, and other integration-related expenses. In addition, investments maturing during 1998 were generally reinvested at lower current market yields, contributing to the overall decline in investment income in 1998.
In 1997, pretax investment income of $1.32 billion was 7% higher than the 1996 total of $1.24 billion. The majority of the increase resulted from underlying growth in invested assets fueled by investment cash flows in 1997. The incremental impact of a full year's worth of income on Northbrook assets acquired in July 1996 also contributed to investment income growth in 1997.
The following table summarizes the composition and carrying value of our property-liability investment segment's portfolio at the end of the last two years. More information on each of our investment classes follows the tables.
(In millions)
December 31
1998
1997
Carrying Value
Fixed maturities
$17,778
$18,068
Equities
1,193
1,006
Real estate and mortgage loans
1,148
1,212
Venture Capital
571
462
Securities lending collateral
1,367
515
Short-term investments
859
849
Other investments
286
319
Total investments
$23,202
$22,431
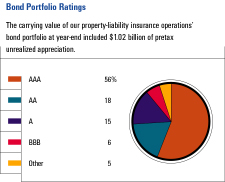
Fixed Maturities - Our fixed maturities portfolio is composed of high-quality, intermediate-term taxable U.S. government agency and corporate bonds and tax-exempt U.S. municipal bonds. We manage our bond portfolio conservatively, investing almost exclusively in investment-grade (BBB or better) securities. Approximately 95% of our portfolio at the end of 1998 was rated investment grade, with the remaining 5% consisting of high-yield and nonrated securities.
The primary factors considered in determining the mix of taxable and tax-exempt security purchases are our consolidated tax position and the relationship between taxable and tax-exempt yields. Taxable securities accounted for 82% of our new bond purchases in 1998 and comprised 65% of our fixed maturities portfolio at the end of 1998. The bond portfolio in total carried a weighted average pretax yield of 6.8% at the end of the year and produced pretax investment income of $1.22 billion in 1998, compared with $1.24 billion and $1.16 billion in 1997 and 1996, respectively.
We carry bonds on our balance sheet at estimated fair value, with the corresponding unrealized appreciation or depreciation recorded in shareholders' equity, net of taxes. The estimated fair values of our bonds fluctuate based on prevailing market yields at any given time. Movement in market interest rates and anticipated future trends in market yields can quickly and significantly impact bond market values. At the end of 1998, the pretax unrealized appreciation on our bond portfolio totaled $1.02 billion, compared with $853 million at the end of 1997. The increase in appreciation corresponds to the downward trend in market interest rates. The amortized cost of our bond portfolio at the end of 1998 was $16.76 billion, compared with $17.22 billion at the end of 1997. The decline from 1997 to 1998 is primarily due to the net sale of bonds in 1998 to fund our cash flow requirements.
Equities - Our equity holdings consist of a diversified portfolio of common stocks which accounted for 4% of total investments (at cost) at year-end 1998. The quality of our portfolio and favorable market conditions over the last several years have resulted in substantial appreciation in our equity holdings. The pretax unrealized appreciation included in the carrying value of our equity portfolio totaled $300 million at the end of 1998, compared with $229 million at the end of 1997.
Real Estate and Mortgage Loans - Real estate and mortgage loans comprised 5% of our total investments at the end of 1998. Our real estate holdings consist primarily of commercial office and warehouse properties that we own directly or in which we have a partial interest through joint ventures. Our properties are geographically distributed throughout the United States. We acquired the portfolio of mortgage loans, which totaled $356 million at the end of 1998, in the USF&G merger. The loans are collateralized by income-producing real estate.
Venture Capital - Venture capital comprised 2% of our invested assets (at cost) at the end of 1998. These private investments span a variety of industries but are concentrated in information technology, health care and consumer products. The carrying value of the venture capital portfolio at year-end 1998 and 1997 included pretax unrealized appreciation of $182 million and $138 million, respectively.
Securities Lending Collateral - This investment class consists of collateral held on certain securities from our fixed maturities portfolio that we have loaned to other institutions through our lending agent for short periods of time. We receive a fee from the borrower in return. We require collateral from the borrower equal to 102% of the fair value of the loaned securities, and we maintain full ownership of the securities loaned. We are indemnified by the lending agent in the event a borrower becomes insolvent or fails to return securities. We record the collateral received as an asset, with a corresponding liability for the same amount.
Realized Gains (Losses) - The following table summarizes our realized gains and losses by investment class for each of the last three years.
(In millions)
December 31
1998
1997
1996
Pretax Realized Investment Gains (Losses)
Fixed maturities
$1
$(18)
$(13)
Equities
158
155
201
Real estate and
mortgage loans
8
53
(10)
Venture capital
25
213
86
9
Other investments
(4)
7
Total investments
$188
$412
$271
Realized gains on sales of real estate and mortgage loans in 1998 were reduced by writedowns of $14 million. Venture capital gains in 1997 included a $129 million gain on the sale of the stock of Advanced Fibre Communications, Inc., one of our direct investments. Realized gains generated from equities in 1996 included a $78 million gain on the sale of our ownership interest in Chancellor Management, Inc. Realized losses on other investments in 1998 and 1997 primarily represent writedowns of miscellaneous investments.
1999 Investment Outlook - We will continue to purchase investment-grade fixed maturities with the majority of funds available for investment in 1999, with a portion of funds allocated to our other asset classes as market conditions warrant. We expect cash flows available for investment to decline further in 1999, due to the anticipated reduction in written premium volume and ongoing cash disbursement requirements related to merger-related and restructuring costs. The current low interest rate environment also negatively affects prospects for investment income growth in 1999. As a result, we expect pretax investment income to fall below 1998 levels. We will retain the portfolio of real estate mortgage loans acquired in the USF&G merger, but we have ceased new mortgage loan originations.