
Management's discussion and analysis
The St. Paul Companies
On April 24, 1998, The St. Paul Companies, Inc. ("The St. Paul") merged with USF&G Corporation ("USF&G"), a Baltimore, MD-based insurance holding company, in a tax-free exchange of stock accounted for as a pooling of interests. The following discussion and analysis is based on the combined results of the merged entity, which operates under The St. Paul name, for all periods presented.
Earnings down sharply in landmark year; strong balance sheet and capital base intact
1998 was one of the most noteworthy years in The St. Paul's 146-year history, yet it was also a difficult year from an operating and profitability standpoint. Our merger with USF&G combined two organizations that shared a similar specialty underwriting focus, expanded our presence in many key markets, and most importantly, provided the critical mass necessary to effectively compete in the extremely challenging and rapidly consolidating property-liability insurance industry. Operating results, however, were severely impacted in 1998 by catastrophe losses in excess of $400 million, several significant earnings charges and deteriorating global market conditions for our insurance products.
The following table summarizes our results for each of the last three years:
Year ended December 31
(In millions, except per share data)
1997
1996
1998
Pretax income (loss):
Property-libility insurance
$ 131
$ 1,391
$ 950
Life Insurance
21
78
(8)
Asset management
104
93
92
Parent company and
other operations
(302)
(226)
(43)
Pretax income(loss) from
continuing operations
(46)
1,336
991
Income tax expense (benefit)
(135)
339
151
Income from
continuing operations
89
997
840
Loss from discontinued operations
-
(68)
(107)
Net Income
$ 89
$ 929
$ 733
Per share
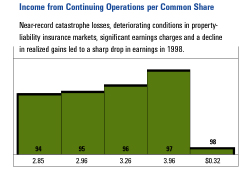
$ 0.32
$ 3.69
$ 2.84
Our 1998 results included $617 million of pretax charges which we believe warrant separate discussion for a better understanding of our 1998 performance.
The pretax charges consist of the following components:
The sharp decline in property-liability insurance pretax income in 1998 reflects the impact of catastrophes and an increase in other insurance losses, and $441 million of earnings charges. Fidelity and Guaranty Life, new to The St. Paul from the merger, recorded a solid year of operating results, reduced by $50 million of earnings charges. The remaining $126 million of earnings charges were recorded in "parent company and other operations," accounting for the deterioration in that category from 1997. Our asset management operation, The John Nuveen Company, posted a fourth consecutive year of record earnings. The tax benefit recorded in 1998 was disproportionately large compared with our pretax loss from continuing operations, due to the substantial amount of tax-exempt investment income we have. "Operating results," which exclude after-tax realized investment gains and losses, is a common measure of an insurance company's financial performance. Our consolidated after-tax operating loss was $40 million in 1998, compared with operating earnings of $743 million and $640 million in 1997 and 1996, respectively. Despite our low level of earnings in 1998, common shareholders' equity of $6.62 billion at the end of the year was slightly higher than year-end 1997 equity, primarily due to a $182 million net increase in unrealized appreciation on our investment portfolio. After issuing 66.5 million common shares to consummate the merger and executing a 2-for-1 stock split in 1998, 234 million common shares were outstanding at the end of the year, translating into a book value per share of $28.32. We repurchased 3.8 million of our common shares in 1998 for a total cost of $135 million. Merger-Related Charge - As part of the integration plan to merge The St. Paul and USF&G operations, management performed a comprehensive review of the operations of the separate companies. The review identified redundant job functions, staffing levels, geographical locations, leased space and technology platforms. To address these redundancies and implement our plan of integration, we recorded a $292 million pretax merger-related charge in 1998. The merger- related charge consisted of the following components:
For certain redundant branch office locations, the lease is expected to be terminated. For leases not expected to be terminated, the amount of expense recorded was calculated as the percent of excess space (20% to 100%) times the net of: remaining rental payments plus capitalized leasehold improvements less actual sub-lease income. No amounts were discounted to present value in the calculation.
On our Statement of Income, $269 million of the merger-related charge was recorded in the "Operating and administrative" expense caption and $23 million was recorded in the "Realized investment gains" revenue caption.
The integration of the two companies is expected to result in annualized expense savings of approximately $200 million, as measured against the combined 1997 pre-merger expenses of The St. Paul and USF&G. We began realizing expense savings in the second half of 1998. The expense savings primarily result from the reduction in employee salaries and benefits after the elimination of redundant positions from the merged organization. No material increases in other expenses are expected to offset these expense reductions over the long-term. As merger-related costs were paid, there was a short-term negative impact on operational cash flows in 1998. Merger-related payments will negatively impact our operational cash flows to a lesser extent in 1999.
The following table summarizes the source of our consolidated revenues for last three years:
Year ended December 31
(In millions)
1997
1996
1998
Revenues:
Insurance premiums earned:
Property-libility
$6,826
$7,161
$7,034
Life
119
137
145
Net investement income
1,585
1,578
1,513
Realized investment gains
202
423
262
Asset management
302
262
220
Other
74
62
58
Total revenues
$9,108
$9,623
$9,232
Change from prior year
(5)%
4%
8%
The 5% reduction in revenues in 1998 was driven by a $335 million decline in property-liability premiums earned, primarily in our Commercial Lines segment, and a $221 million reduction in realized investment gains. Those gains were unusually high in 1997, largely due to the sale of one venture capital investment that generated a $129 million gain. The growth in earned premiums and investment income in 1997 over 1996 was primarily due to our 1996 acquisitions of Northbrook Holdings, Inc., a commercial lines insurance company, and Afianzadora Insurgentes, S. A. de C.V., a surety underwriting company in Mexico.
1997 vs. 1996 - The 35% increase in consolidated 1997 pretax income from continuing operations compared with 1996 was centered in our property-liability insurance operations, where a decline in catastrophe losses, improvement in our core book of Personal Insurance business and significant growth in realized investment gains led to a $441 million increase in pretax earnings. F&G Life's pretax earnings also rebounded in 1997 after being heavily impacted by realized investment losses of $57 million in 1996, which largely consisted of asset writedowns.
The after-tax losses from discontinued operations of $68 million and $107 million in 1997 and 1996, respectively, were related to our sale of Minet, an insurance brokerage operation, to Aon Corporation in 1997. We recorded the initial loss in 1996 to reduce Minet's carrying value to its estimated net realizable value after our decision to exit the brokerage business. The loss recorded in 1997 reflects the costs associated with the actual Minet divestiture, primarily to recognize our commitment to Aon for certain severance, employee benefits, lease commitments and other costs.
The following pages include a detailed discussion of results produced by the five distinct business segments which underwrite property-liability insurance and provide related services for particular market sectors. We also review the performance of our underwriting operations' investment segment. After the property-liability discussion, we discuss the results of our life insurance segment, F&G Life, and our asset management segment, The John Nuveen Company.
Property-Liability Insurance Overview
Catastrophes and deteriorating market conditions push underwriting losses past $1 billion mark in 1998
Our underwriting results continued to suffer from the effects of intense competition throughout the property-liability insurance industry in 1998. Despite accelerating loss costs, pricing levels in virtually all commercial insurance markets continued to decline during the year, reflecting an overabundance of capital in the market. The competitive pressures and soft pricing environment, which have persisted for several years, were major contributors, along with catastrophes and a reserve strengthening charge, to the $1.26 billion decline in property-liability pretax income in 1998.
Consolidated net written premiums of $6.69 billion in 1998 were down 3% from 1997 premium volume of $6.93 billion. The decline in 1998 volume reflects the loss of business in certain markets following the merger with USF&G, as well as the soft pricing environment throughout global primary and reinsurance markets. Significant premium declines in our commercial insurance segments and the Reinsurance segment were partially offset by growth in our Personal Insurance segment, due to an acquisition in late 1997, and our International segment, due to new business expansion.
Our consolidated GAAP underwriting loss, representing premiums earned less losses incurred and underwriting expenses, totaled $1.04 billion in 1998, more than $800 million worse than the 1997 loss of $233 million. Catastrophe losses of $419 million in 1998 were the second-highest total in our history, trailing only the $445 million of losses recorded in 1992 when Hurricane Andrew struck the southeastern U.S. coast. The nature of our catastrophe experience in 1998 differed from 1992, however, in that the majority of losses resulted from an unusually high number of relatively low-severity storms across the United States. Several of these storms struck our home state of Minnesota, where we have a heavy concentration of business, and the southeastern United States, where we also have a strong presence. Hurricane Georges, one of the most severe hurricanes since Andrew, accounted for $118 million, or 28%, of our catastrophe experience in 1998. By comparison, our total catastrophe losses in 1997 were $132 million.
Our underwriting results in 1998 were also impacted by a $250 million provision to strengthen loss reserves, reflecting the application of our loss reserving policies to USF&G's loss and loss adjustment expense reserves subsequent to the merger.
Prior to the merger, both The St. Paul and USF&G, in accordance with generally accepted accounting principles, recorded their best estimate of reserves within a range of estimates bounded by a high point and a low point. Subsequent to the consummation of the merger in April 1998, we obtained the raw data underlying, and documentation supporting, USF&G's December 31, 1997, reserve analysis. The St. Paul's actuaries reviewed such information and concurred with the reasonableness of USF&G's range of estimates for their reserves. However, applying their judgment and interpretation to the range, our actuaries, who would be responsible for setting reserve amounts for the combined entity, concluded that strengthening the reserves would be appropriate, resulting in the $250 million adjustment. The adjustment was allocated to the following business segments: Commercial Lines ($197 million); Personal Insurance ($35 million); and Specialty Commercial ($18 million).
Catastrophes and reserve strengthening notwithstanding, 1998 underwriting results were significantly worse than comparable 1997 results. The deterioration was centered in our Commercial Lines segment, and in the Medical Services business center of our Specialty Commercial segment. The factors driving 1998 results in these operations, and the corrective actions under way, are specifically addressed in the respective segment discussions in the following pages.
A common measurement of a property-liability insurer's underwriting performance is its combined ratio, which is the sum of its loss ratio and expense ratio. The lower the ratio, the better the result. Our consolidated combined ratio was 116.2 in 1998, over 12 points worse than the 1997 ratio of 103.8. The loss ratio of 82.1, measuring losses and loss adjustment expenses incurred as a percentage of earned premiums, was 11 points worse than the comparable 1997 ratio of 71.1. The $250 million provision to strengthen loss reserves added 3.7 points to the 1998 ratio. Catastrophe losses accounted for 6.1 points of our loss ratio in 1998, compared with a 1.8 point impact in 1997. We expect catastrophes in a given year to account for approximately three points of our annual loss ratio based on historical average experience for our mix of business.
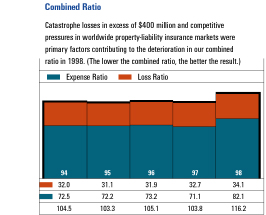
The expense ratio, which measures underwriting expenses as a percentage of premiums written, deteriorated 1.4 points to 34.1 in 1998, reflecting the impact of a 3% decline in premium volume and a slight increase in underwriting expenses. Expenses incurred in the second half of 1998 declined when compared with earlier in the year, reflecting the initial impact of operational efficiencies realized from the merger.
Late in the fourth quarter of 1998, we recorded a $34 million pretax charge to earnings in "Operating and administrative expenses" related to the restructuring of our Commercial Lines and Specialty Commercial segments. We implemented a plan to cut the number of our regional offices in half and streamline our underwriting structure. Approximately $26 million of the charge related to the anticipated termination of approximately 520 employees in the following operations: Claim, Commercial Lines, Information Systems, Medical Services and Professional Markets. The remaining charge of $8 million related to costs to be incurred to exit lease contracts. As of Dec. 31, 1998, no employees had been terminated under the restructuring plan. Actions to take place under the plan are expected to be completed by the end of 1999. We expect to realize annual expense savings of approximately $50 million in 1999 as a result of this plan, primarily due to a reduction in salaries and related costs. These savings are separate from the $200 million of expected savings related to the merger.
1997 vs. 1996 - Premium volume in 1997 of $6.93 billion was down less than 2% from the equivalent 1996 total of $7.04 billion. Declines in Personal Insurance and Reinsurance volume were largely offset by premium gains in the Commercial Lines and International segments. The GAAP underwriting result improved by $117 million compared with 1996, primarily due to a decline in catastrophe losses and significant improvement in our Personal Insurance segment.
Outlook for 1999 - We do not expect market conditions to improve in 1999. However, we believe the substantial economies of scale afforded by the merger with USF&G, coupled with the corrective underwriting initiatives and restructuring efforts already under way to improve our commercial insurance results, provide the opportunity for substantial earnings improvement in 1999. We will adhere to strict underwriting standards with respect to risk selection and pricing throughout our property-liability operations in 1999, and we are prepared to sacrifice premium volume and market share to restore profitability.
Property-Liability Insurance Results By Segment - The following table summarizes written premiums, underwriting results and statutory combined ratios for each of our property-liability insurance underwriting segments for the last three years. All data for 1997 and 1996 were reclassified to conform to the 1998 presentation. Following the table, we take a closer look at 1998 results for each segment and look ahead to 1999.
Year ended December 313
% of 1998
Written Premiums
1998
1997
1996
(Dollars in millions
Primary Insurance Operations:
U.S. Underwriting
Commercial Lines
Written premiums
37%
$2,493
$2,788
$2,710
$(659)
$(91)
$(95)
Underwriting results
Combined ratio
127.3
104.9
104.6
Speciality Commercial
Written premiums
20%
$1,348
$1,401
$1,418
$(147)
$18
$71
Underwriting results
Combined ratio
111.8
99.6
94.1
Personal Insurance
Written premiums
22%
$1,418
$1,250
$1,351
$(175)
$18
$(319)
Underwriting results
Combined ratio
113.1
99.6
123.3
Total U.S. Underwriting
Written premiums
79%
$5,259
$5,439
$5,479
$(981)
$(184)
$(343)
Underwriting results
Combined ratio
119.5
107.3
106,4
International
Written premiums
5%
$378
$294
$269
$(67)
$(53)
$(24
Underwriting results
Combined ratio
116.7
118.1
108.7
Total Primary Insurance Operations
Written premiums
84%
$5,637
$5,733
$5,748
$(1,048)
$(237)
$(367)
Underwriting results
Combined ratio
119.4
104.8
106.4
Reinsurance
Written premiums
16%
$1,056
$1,200
$1,286
$7
$4
$17
Underwriting results
Combined ratio
98.7
99.0
99.0
Total Property-Liability Insurance
Written premiums
100%
$6,693
$6,933
$7,034
$(1,041)
$(233)
$(350)
Underwriting results
Combined ratio:
82.1
71.1
73.2)
Loss and loss expense ratio
34.1
32.7
31.9
Underwriting expense ratio
Combined ratio
116.2
103.8
105.1