 |
|
FINANCIAL DATA |
|
|
FINANCIAL HIGHLIGHTS |
|
|
Ameren Consolidated |

(In Millions, Except Per Share Amounts
and Customer Data) |
2003 |
2002 |
|
|
|
| Operating Revenues
|
$4,593
|
$3,841
|
| Net Income (a)
|
$475
|
$440
|
| Earnings per Common Share (a)
|
$2.95
|
$3.01
|
| Dividends Paid per Common Share
|
$2.54
|
$2.54
|
| Dividend Yield (Dec. 31)
|
5.5%
|
6.1%
|
| Market Price per Common Share (Dec. 31)
|
$46.00
|
$41.57
|
| Total Market Value of Common Shares
|
$7,492
|
$6,404
|
| Book Value per Common Share
|
$26.73
|
$24.94
|
| Property and Plant (net)
|
$10,917
|
$9,492
|
| Total Assets
|
$14,233
|
$12,151
|
| Capitalization Ratios:
|
|
|
| Common Equity
|
47.5%
|
51.6%
|
| Preferred Stock
|
2.0%
|
2.6%
|
| Debt, Net of Cash
|
50.5%
|
45.8%
|
| Native Kilowatthour Sales
|
63,258
|
55,586
|
| Total Kilowatthour Sales
|
77,781
|
70,339
|
| Net Generation (in kilowatthours)
|
73,348
|
65,984
|
| Electric Customers
|
1,700,000
|
1,500,000
|
| Gas Customers
|
500,000
|
300,000
|
|
|
(a) Excludes cumulative effect of change in accounting principle in 2003 of $18 million, net of taxes (11 cents per share) as described in Note 1 of the Consolidated Financial Statements. Also excludes unusual gain in 2003 related to the settlement of a dispute over certain mine reclamation issues with a coal supplier of $31 million, net of taxes (19 cents per share) and unusual charges in 2002 for workforce reductions and suspension of operations or closure of units at two power plants of $58 million, net of taxes (40 cents per share), as described in Note 7 of the Consolidated Financial Statements. Net income excluding these items is a non-GAAP measure. |
|
AMEREN CORPORATION
ELECTRIC AND GAS SERVICE TERRITORY |
|
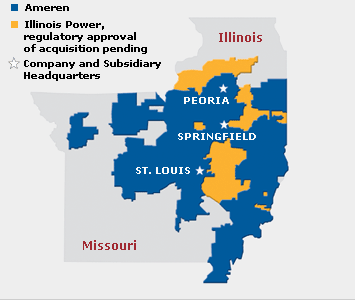
Above: With Ameren's 2003 acquisition of CILCORP Inc., the company's service territory grew to include 49,000 square miles in Missouri and Illinois. In early 2004, Ameren announced an agreement to purchase the stock of Illinois Power.
|
|
|
 |
|
|
KILOWATTHOUR SALES |
|
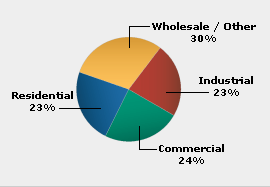
Above: Ameren's diverse sales mix offers more
stable and predictable sales, compared to
companies with sales concentrated in only
one or two customer segments.
|
|
|
FUEL MIX BASED ON GENERATION |
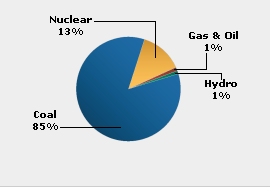
Above: Ameren is the 4th largest coal buyer in the nation, providing significant purchasing leverage and more stable pricing relative to other fuel choices.
|
|
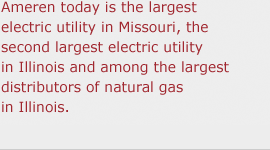 |
|
|
COMPETITIVE ELECTRIC RATES |
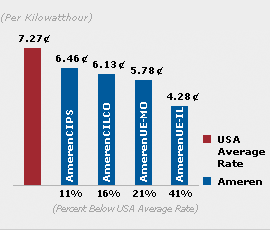
Above: Ameren's operating companies' annual average revenue per kilowatthour at June 30, 2003, was consistently below the national average revenue per kilowatthour over the same period. These competitive rates mean that, in total, Ameren companies' average rates were nearly 20 percent below the national average.
|
|
|
 |
 |
