Page 3 - 2019 AMETEK Annual Report FINAL
P. 3

Financial Highlights  1


          Financial Highlights


                                                                     ($ in millions, except per share amounts)
           Year Ended December 31                      2019         2018         2017         2016        2015*
           Net sales                                 $ 5,158.6    $ 4,845.9    $ 4,300.2    $ 3,840.1   $ 3,974.3
           Operating income                          $ 1,177.4    $ 1,075.5    $  925.4     $  830.4    $  944.3
           Net income                                $  861.3     $  766.1     $  606.0     $  537.7    $  615.5
           Diluted earnings per share                $  4.19      $   3.66     $  2.90      $  2.59     $  2.77
           Dividends declared and paid per share     $  0.56      $   0.56     $  0.36      $  0.36     $  0.36
           Operating income margin                      22.8%         22.2%       21.5%        21.6%       23.8%
           EBITDA                                    $ 1,388.3    $ 1,267.7    $ 1,076.0    $  966.0    $ 1,046.9
           Free cash flow                            $ 1,012.1    $  843.4     $  758.2     $  693.5    $  603.4
           Capital expenditures                      $  102.3     $   82.1     $  75.1      $  63.3     $  69.1

           At December 31
           Total debt                                $ 2,768.7    $ 2,632.7    $ 2,174.3    $ 2,341.6   $ 1,938.0
           Net debt                                  $ 2,375.7    $ 2,278.7    $ 1,528.0    $ 1,624.3   $ 1,557.0
           Total debt/EBITDA                             2.0x          2.1x        2.0x         2.4x        1.9x
           Stockholders’ equity                      $ 5,115.5    $ 4,241.9    $ 4,027.6    $ 3,256.5   $ 3,254.6
           Shares outstanding (in millions)            229.1         227.1       231.1        229.4        235.5
           Number of employees                         18,100       18,100       16,900       15,700      15,450
          Note: This table and other financial measures in this report include non-GAAP (generally accepted accounting principles) results. Please visit the Investors section of ametek.com for
          a reconciliation of GAAP to non-GAAP results.
          *  Amounts do not reflect the adoption of ASU 2017-07 related to presentation of pension costs.
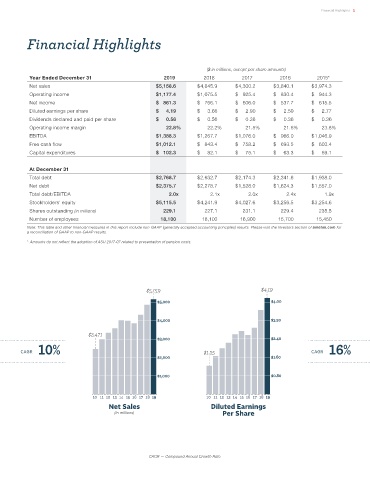


                                                 $5,159                                $4.19

                                                     $5,000                                $4.00

                                                     $4,000                                $3.20

                              $2,471                 $3,000                                $2.40
              10%                                                                                             16%
        CAGR                                                        $1.25                               CAGR
                                                     $2,000                                $1.60


                                                     $1,000                                $0.80


                                10 11 12 13 14 15 16 17 18 19        10 11 12 13 14 15 16 17 18 19
                                     Net Sales                         Diluted Earnings
                                       (In millions)                       Per Share


                                                  CAGR — Compound Annual Growth Rate
   1   2   3   4   5   6   7   8