
2010 marked the 50th anniversary of Sealed Air Corporation and our iconic Bubble Wrap® brand, as well as a turning point for our organization.
After focusing and investing over the last five years to optimize our internal operations, lower our cost structure, revitalize our R&D programs, reposition our supply chain platform to support developing regions growth, and successfully deploy a global SAP enterprise reporting system, we are now positioned to realize the benefits of these investments. In 2010, we outlined the key drivers needed to accelerate volume growth to 5% to 6% annually and return to a 15% operating profit margin by the 2012/2013 time frame.
Today, we are focused on pioneering what is next in material science, in automation technology, and in service-based solutions for our expanding customer base. Ultimately, our strategy places an emphasis on sustainable growth, reinforcing our competitive advantages, developing disruptive, proprietary technologies, and achieving greater profitability. By achieving our goals, we are confident in our ability to enhance the measurable benefits we bring to our customers, continue a longstanding tradition of creating a positive impact for our employees, consumers and communities, and thereby, increase the value we can return to stockholders. We believe all of these factors will help secure our competitive position for the next 50 years.
SOLID VOLUME & PRODUCTIVITY PERFORMANCE
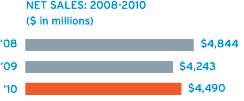
Business demand accelerated in the second half of 2010, resulting in 5% volume growth for the full year and a peak 7% increase in the fourth quarter compared to 2009. All businesses and regions and contributed to this solid growth, resulting in a 6% increase in annual sales to $4.5 billion. This achievement provided solid momentum for our businesses as we entered 2011 and is in line with our higher volume performance goals.
We generated approximately $100 million in supply chain productivity benefits in 2010 by achieving record level performance in manufacturing yields and safety, as well as ongoing improvements in labor and asset productivity. These accomplishments helped to largely offset an incremental $130 million in resin costs, as commodity prices continued to rise through the year and into 2011.
We continued to manage commodity price increases through several key actions. Our businesses increased contract adjustment frequency and initiated several pricing actions among our price list customers, which started our 12- to 18-month cost recovery process. Additionally, we enhanced our procurement strategy by beginning to harmonize resin specifications where possible and reformulate film structures to include a greater proportion of lower cost commodity resins. Our product development and manufacturing initiatives also focused on diversifying our material stream to incorporate a greater percentage of recycled and renewable content and scale our new, proprietary manufacturing technology that has reduced resin content by up to 30% in our CT-series shrink films.
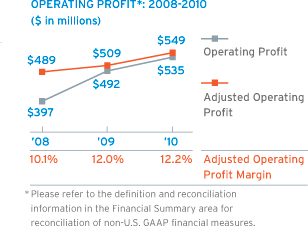
Although several of these initiatives are in early stages, we achieved a 3% annual increase in gross profit, or a 27.9% gross profit margin. However, rising resin costs ultimately did hinder our ability to meet some of our operational goals, and, as a result, performance-based compensation expenses were reduced. As a result of the above, we reported a 9% increase in operating profit, or an 11.9% operating profit margin. Excluding restructuring and other charges, we achieved a 12.2% operating profit margin, for the year—slightly above prior year performance.
These achievements were reflected in our reported $1.44 diluted earnings per share, or $1.60 per share on an adjusted basis, which was an 11% increase over the 2009 adjusted diluted earnings per share of $1.44.
We also realized solid results across our six key priorities for 2010:
- CASH FLOW GENERATION: We generated $342 million of free cash flow, representing 8% of net sales. Additionally, we returned $90 million to stockholders through dividends and share repurchases and reduced debt by over $250 million, primarily from the early redemption of half of our 12% senior notes;
- NEW PRODUCT DEVELOPMENT: We launched over 55 new solutions, continued to be recognized with numerous prestigious awards, and invested in four technologies that will help us further differentiate our solutions in the future;
- GROWTH IN INDIA & CHINA: We organized our strong regional management talent under newly assigned leadership and launched a new strategic plan that capitalizes on the tremendous growth opportunities available for all of our businesses in these dynamic economies. Although the program is still in its infancy, we generated year-over-year sales growth that was more than double GDP growth;
- OPTIMIZING PROCESSES & OPERATIONS TO MAXIMIZE PROFITABILITY: In addition to the record performance achievements listed above that leverage our World Class Manufacturing principles and the completion of our Global Manufacturing Strategy, we achieved solid progress in the various initiatives targeted at holding our $1 billion in fixed overhead expenses steady. Additionally, we continued to benefit from the roll-out of our “Cost to Serve Business Effectiveness” initiatives, which are focused on process simplification and enhancing SKU and customer profitability;
- DEVELOPING OUR PEOPLE—OUR FUTURE LEADERS: We formed a Diversity Council that ensures that our workplace and supply-base are inclusive, can capitalize on the creative force of a diverse team, and will reflect the array of needs and ideas inherent in each of our global end markets; and
- SUSTAINABILITY IN EVERYTHING WE DO: We advanced our sustainability initiatives through the launch of our new SmartLife™ campaign, introduced several new products that feature renewable materials, increased use of recycled content, and introduced thinner film structures that leverage our new, proprietary manufacturing process.
BOLSTERING STRENGTHS TO PIONEER AHEAD
Leading innovation, our unparalleled international footprint, distribution reach, and flexible manufacturing network have always been key differentiators for Sealed Air. In 2010, we bolstered these key brand anchors with ongoing investment.
Proprietary Technology and a Systems Approach: Materials + Equipment + Services
Sealed Air has a long tradition of pioneering new market applications and technologies in packaging. Today, approximately 15% of our net sales represent new products, and our goal is to increase this mix over the next few years. To reach this goal, we have enhanced our R&D platforms, are increasing the size and quality of our portfolio of proprietary technologies, manufacturing processes and automation systems, and are accelerating the speed-to-market of projects in our development pipeline. In 2010, we launched 40 new film structures, 8 new equipment systems, 5 new foam formulations, and 4 new service-based offerings. This represents double the volume of new solutions launched in 2009.
We continued to expand applications for our new proprietary micro-layering manufacturing process which reduces the thickness of our films by up to 50%, thus lowering resin content, while meeting and even exceeding traditional performance characteristics. Today, we are testing to determine if other product families may be able to leverage this new technology. Additionally, we are excited about efforts in other process technologies that will diversify our material stream. For example, we launched Instapak® RC45 foam, which incorporates 25% renewable content, and PakNatural™ loose fill made from renewable content.
Our efforts and expertise have been noticed. In addition to the numerous awards recognizing our innovation, our three Packforum® learning and innovation centers hosted over 2,000 attendees across 30 educational seminars and several hundred customer visits. It is at these sites that we share our insights and innovations, as well as collaborate with customers on tomorrow’s new packaging solutions.
Developing Regions
We have been serving developing regions for decades as part of our 52-country presence that enables us to distribute products to over 75 countries worldwide. Expanding our leadership and reach in developing regions is an important element in our growth strategy, as we aim to extend developing region sales from approximately $735 million, or 16% of consolidated net sales in 2010, to approximately 20% over the next three to five years.
In 2010, we completed our Global Manufacturing Strategy program, which established three new greenfield facilities across China, Mexico and Poland and optimized our food businesses’ footprint in North America and Europe. This program generated an annual $55 million benefit resulting from our simplified supply chain structure and a reduction in our overall costs while supporting growth in developing regions. Additionally, we invested in the future growth of our food businesses with the acquisition of a new facility in Brazil and expanded capacity in our existing Russian facility. Our Protective Packaging and Specialty Materials businesses expanded their capabilities in China with incremental foam extrusion capacity, which will help them meet the growing demand for high performance packaging solutions in Asia.
Supply Chain Excellence
We have been delivering high quality, high performing products to customers for decades by leveraging our World Class Manufacturing principles and a commitment to continuous improvement. In 2010, we continued to optimize our network, extend our footprint, integrate new technology platforms, and expand our sourcing strategies and tools to increase our productivity, while maintaining our high customer service levels. And I am proud to note that 2010 marked record performance across several metrics, which helped contribute to approximately $100 million in productivity benefits. These include record:
- Safety performance: 0.97 Total Recordable Incident Reports vs. 1.04 TRIR in 2009 (lower score reflects improvement)
- Productivity yields: 1% improvement vs. 2009 levels
- Supply Chain labor productivity: Sales/Employee: +7%; Operating Income/Employee +10% vs. 2009
We also exceeded our sustainability goals:
- Energy intensity: 2% reduction goal in 2010; 5% reduction attained (vs. 2006 baseline)
- Emissions intensity: 10% reduction goal in 2010; 13% reduction attained (vs. 2006 baseline)
- Waste to landfill: Material to landfill decreased 2% vs. 2009 and recycling rates increased—providing record material utilization rates at Sealed Air
PIONEERING INTO 2011 & BEYOND
Looking ahead, I am confident that we have the right strategy and structure in place to accelerate volume growth and achieve a 15% operating profit margin by 2012/2013 time frame. Our momentum is strong going into 2011 and we are staying focused on the implementation and disciplined execution of our growth plans, continued improvement in our operational performance, the advancement of our sustainability mission and the development of our people. As part of this journey, our 2011 management objectives continue to be focused on:
- Improving cash flow and return on assets;
- Continuing to innovate and extend the Sealed Air brand into new applications;
- Optimizing processes and operations to maximize profitability;
- Accelerating our growth in developing regions;
- Developing our people—our future leaders; and
- Continuing our sustainability practices—in everything we do—to help make the world a better place today and tomorrow.
Ultimately, we are targeting a 5% to 6% volume growth rate through 2013 and increasing operating profit margins by approximately 100 basis points annually. We expect to achieve these goals by growing our core business, accelerating introduction of new products and technologies that allow us to maximize profitability, generating productivity benefits and holding fixed overhead expenses steady as we shift our operating expense ratio to approximately 15% of net sales over time. We expect these efforts to yield a business with approximately a 30% gross profit margin, a 15% operating expense ratio and a 15% operating profit margin by the 2012/2013 time frame.
Additionally, we maintain a solid balance sheet and liquidity position. We are focused on strong free cash flow generation, which we are targeting to be approximately 8% to 9% of net sales in 2012/2013, and remain well positioned to fund the W. R. Grace settlement agreement when it becomes due. We expect payment of the settlement agreement to be accretive to our post-payment diluted earnings per share by approximately $0.12 to $0.14 annually, to yield cash tax benefits, and provide more flexibility in our balanced uses of cash going forward.
Together, we will capitalize on the numerous opportunities available to us and pioneer what is next for Sealed Air in 2011 and beyond. It is for these reasons that all of us at Sealed Air remain passionate about our business, our customers, our communities, and our stockholders.

William V. Hickey
President and Chief Executive Officer

- FOUNDED—1960 in Hawthorne, NJ, USA
- WORLD HEADQUARTERS—Elmwood Park, NJ, USA
- NYSE—SEE
- 2010 NET SALES—$4.5 billion
- 2010 NET EARNINGS—$256 million
- EMPLOYEES—16,100
- INNOVATOR—leading innovator in advanced material science, manufacturing processes, automation and integration
- TOTAL SYSTEMS APPROACH—services + materials + equipment + integration
- SCALE & GLOBAL REACH—114 manufacturing facilities, 52 country presence, 77 country distribution