Highlights
Financial Highlights*
| Year Ended December 31, | Pro Forma | ||||
|---|---|---|---|---|---|
| ($ in millions, except per common share data) | 2012 | 20111 | 2010 | 2011** | |
| Total Net Sales | $7,648 | $5,551 | $4,490 | $7,785 | |
| Percent U.S. | 35% | 40% | 46% | 35% | |
| Percent International | 65% | 60% | 54% | 65% | |
| U.S. GAAP Operating (Loss) Profit | $(1,417) | $429 | $535 | $596 | |
| Total Net Sales | $666 | $571 | $549 | $681 | |
| Adjusted Operating Profit Margin | 8.7% | 10.3% | 12.2% | 8.7% | |
| Adjusted EBITDA | $996 | $784 | $750 | $996 | |
| As a Percent of Net Sales | 13.0% | 14.1% | 16.7% | 12.7% | |
| U.S. GAAP Net (Loss) Earnings—Diluted | $(1,410) | $139 | $256 | $106 | |
| Adjusted Net Earnings—Diluted | $201 | $233 | $283 | $169 | |
| U.S. GAAP Net (Loss) Earnings Per Common Share—Diluted | $(8.35) | $0.75 | $1.44 | $0.51 | |
| Adjusted Earnings Per Common Share—Diluted | $0.95 | $1.26 | $1.60 | $0.81 | |
| Cash Dividends Paid per Common Share | $0.52 | $0.52 | $0.50 | $0.42 | |
| Total Return to Shareholders | |||||
| (Dividends & Share Repurchases) | $101 | $89 | $91 | $— | |
| Net Cash Provided by Operating Activities | $404 | $372 | $483 | $— | |
| Capital Expenditures | $124 | $123 | $88 | $— | |
| Free Cash Flow*** | $280 | $249 | $395 | $— | |
| Net Debt**** | $4,779 | $5,131 | $1,542 | $— | |
*Results for 2012 and 2011 are presented on a continuing operations basis, excluding the impact of the sale of Diversey Japan, which the company sold in November 2012.
**Reflects historical results on a pro forma basis reflecting the acquisition of Diversey Holdings, Inc.
***Free Cash Flow is calculated as: net cash provided by operating activities less capital expenditures.
****Net Debt is calculated as: the sum of short-term borrowings, current portion of long-term debt, Settlement agreement and related accrued interest and long-term debt less cash and cash equivalents.
12011 reported results include the results of Diversey for the fourth quarter based on the acquisition on October 3, 2011.
2012 Revenue mix highlights
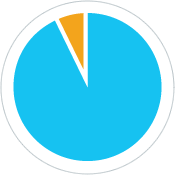
By Solution Type
| Consumables | 93% |
| Equipment | 7% |
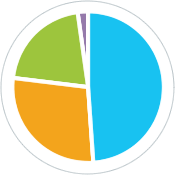
By Business
| Food & Beverage | 49% |
| Institutional & Laundry | 28% |
| Protective Packaging | 21% |
| Other | 2% |
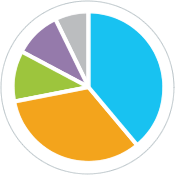
By Geography
| North America | 39% |
| Europe | 33% |
| Latin America | 21% |
| AMAT* | 10% |
| Japan/Australia NZ | 7% |
| *Asia, Middle East, Africa, and Turkey | |