
Page 5 - AnnualReport2014
P. 5
ustrial Controls, IwndhiucshtribaelcCaomnetroplasr,twohf iMchabgenceatemk’es pwairet loefssMcaognntreotlekb’usswinieressle, ss control business, neered the use opfiroandeieorecdonthtreolussoenoofvreardhieoacdocnrtraonlsesoino1v9e6rh0e.aTdhecrparneedseicne1ss9o6r0. The predecessor
Magnetek’s mininogf Mdraivgenebtueski’nsemssi,nPinogwderivCeobnutrsoilneCsosr,pPorwateiornC,ownatrsolfoCrmorepdoriantion, was formed in sburgh in 1965.PFiottsubnudregdh iin 198615,. EFloeucntrdoemdotiinve19S8ys1te, mElsecbterocammoetivMe aSgysntetmeks’sbecrcanmee Magnetek’s crane trol business andcownatrsolthbeusfirnset scsoamnpdawnyastothuesefirasdt jcuosmtapbalenyfretoquesnecayddjurisvteasblteo fcroeqntureonl cy drives to control
rhead cranes. WohveilrehMeaadgcnreatenkesh.aWs bheilenMinavgonlveetedkihnamsabneyeneliencvtorilcvaeldaindmpaonwyeerlectrical and power trol products ovecrointstrohlisptororyd,utchtes oavcecromitsphliisshtomreyn,ttsheofatcocdoamy’psliMshamgennettseokfbtuosdianeys’seMsagnetek businesses
e stood the test ohfavtiemestoaond tfhoermtestht eoffotiumnedatniodnforfmouthrexfopuenrtdisaetiointohef oinudr uesxtprierstiwsein the industries we
ve. We look forwsearvdet.oWthelnoeoxktf3o0rwyaeradrstootfhperonveixdtin3g0oyueraprsaortfnpersovwiditihnginonuorvaptaivretners with innovative wer and motion cponwtreorlsa.nd motion controls.
nk you for your
s
u
r p
y
o
u
T c
r continued support. t.
h o
P ck
a n
n ti
k nu
y e
o d
u
f
o
eter M. McCormick
p
o
r
er M. McCormi sident and Chie
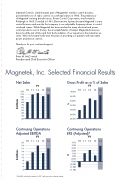
neMteka,gInec.teSk,elIenct.eSdeFleincatendciaFilnRaenscuilatslResults
et Sales Net Sales Gross Profit aGsraos%s PorfoSfitaalessa % of Sales
FY FY FY FY
P f
f Executive Officer
re E
s x
i e
d c
e u
n t
t iv
a e
n O
d
C
h ce
f
fi
ie r
10 11 12 13101411 12 13 10 11 12 13101411 12 13 120 38.0% 38.0%
120
110 110 100 100
90 90 80 80 70 70 60 60 50 50 40 40 30 30
36.0% 34.0% 32.0% 30.0% 2 8.0% 2 6.0%
36.0% 34.0% 32.0% 30.0% 2 8.0% 2 6.0%
14
20
20
ntinuing OCpoenrtaintiuoinsg OperationCsontinuing OCpoenrtaintiuoinsg Operations justed EBITADdAjusted EBITDA EPS (AdjustedE)P*S (Adjusted)*
FY FY FY FY
10 11 12 13101411 12 13 14 10 11 12 13101411 12 13 20 20 3.50 3.50
18 18 3.00 3.00
14
16 16 14 14 12 12 10 10
ANNUAL REPORT
2.50 2.50 2.00 2.00 1.50 1.50 1.00 1.00 0.50 0.50 0.00 0.00
88
66
44
2 2 (1.50) (1.50)
2 014
(0.50) (0.50) (1.00) (1.00)
14 EPS excludes the impac*t o2f0a14$3E7P.S1emxcilluiodnesptehnesiiomnpsaecttleomf aen$t3c7h.a1rgmei.llion pension settlement charge.
14
d o
n e n v
a
t e
o d
0
$millions $millions
$%
$%
