MD&A
Quantitative and Qualitative Disclosures About Market Risk
Financial Statements
Notes to Financial Statements
Shareholder Return Performance Graph
Quarterly Financial Data
Selected Historical Financial Data
Non-GAAP Financial Measure Reconciliation
Management’s Reports
Reports of Independent Registered Public Accounting Firm
16. BUSINESS SEGMENTS
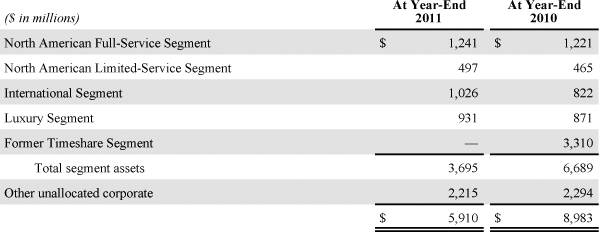
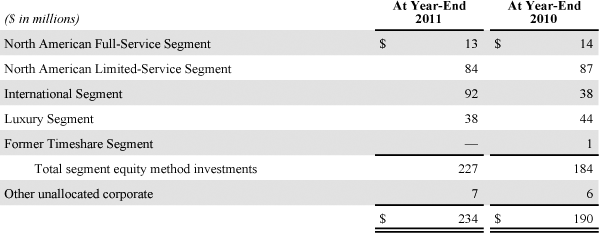
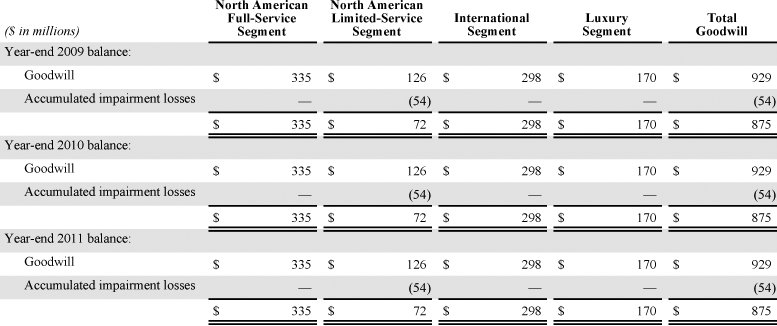
We are a diversified hospitality company with operations in four business segments:
- North American Full-Service Lodging, which includes the Marriott Hotels & Resorts, Marriott Conference Centers, JW Marriott, Renaissance Hotels, Renaissance ClubSport, and Autograph Collection properties located in the United States and Canada;
- North American Limited-Service Lodging, which includes the Courtyard, Fairfield Inn & Suites, SpringHill Suites, Residence Inn, TownePlace Suites, and Marriott ExecuStay properties located in the United States and Canada;
- International Lodging, which includes the Marriott Hotels & Resorts, JW Marriott, Renaissance Hotels, Autograph Collection, Courtyard, AC Hotels by Marriott, Fairfield Inn & Suites, Residence Inn, and Marriott Executive Apartments properties located outside the United States and Canada; and
- Luxury Lodging, which includes The Ritz-Carlton, Bulgari Hotels & Resorts, and EDITION properties worldwide (together with residential properties associated with some Ritz-Carlton hotels).
In addition, prior to the spin-off, our former Timeshare segment consisted of the timeshare operations and timeshare development business that we transferred to MVW in conjunction with the spin-off. Our former Timeshare segment’s historical financial results for periods prior to the spin-off continue to be included in Marriott’s historical financial results as a component of continuing operations as reflected in the tables that follow. See Footnote No. 17, “Spin-off” for additional information regarding the spin-off.
In 2011, we changed the management reporting structure for properties located in Hawaii. In conjunction with that change, we now report revenues, financial results, assets, and liabilities for properties located in Hawaii in our North American segments rather than in our International segment. In addition, we recognized in our Timeshare segment some management fees we previously recognized in our International segment. For comparability, we have reclassified prior year segment revenues, segment financial results, and segment assets to reflect these changes. These reclassifications only affect our segment reporting, and do not change our total consolidated revenue, operating income, or net income or our total segment revenues or total segment financial results.
We evaluate the performance of our segments based primarily on the results of the segment without allocating corporate expenses, income taxes, or indirect general, administrative, and other expenses. With the exception of our former Timeshare segment, we do not allocate interest income or interest expense to our segments. We allocate gains and losses, equity in earnings or losses from our joint ventures, divisional general, administrative, and other expenses, and income or losses attributable to noncontrolling interests to each of our segments. Prior to the spin-off date, we included interest income and interest expense associated with our former Timeshare segment notes in our Timeshare segment results because financing sales and securitization transactions were an integral part of that segment’s business. “Other unallocated corporate” represents that portion of our revenues, general, administrative, and other expenses, equity in earnings or losses, and other gains or losses that we do not allocate to our segments. “Other unallocated corporate” includes license fees we receive from our credit cards and following the spin-off, also includes license fees associated with the timeshare brands.
We aggregate the brands presented within our segments considering their similar economic characteristics, types of customers, distribution channels, regulatory business environments and operations within each segment and our organizational and management reporting structure.
Revenues

(1) Of the $164 million of interest expense shown on the Income Statement for year-end 2011 we allocated $43 million, respectively, to our former Timeshare Segment. Of the $180 million of interest expense shown on the Income Statement for year-end 2010 we allocated $55 million to our former Timeshare segment.

(2) The $61 million of income tax benefits for year-end 2009 included our benefit for income taxes of $65 million as shown in the Income Statements and taxes attributable to noncontrolling interests of $4 million.


Segment expenses include selling expenses directly related to the operations of the businesses, aggregating $354 million in 2011, $419 million in 2010, and $440 million in 2009. Approximately 82 percent for 2011 (prior to the spin-off date), 85 percent for 2010 and 86 percent for 2009 of the selling expenses are related to our former Timeshare segment.
Our Financial Statements include the following related to operations located outside the United States (which are predominately related to our International lodging segment):
- Revenues of $1,945 million in 2011, $1,841 million in 2010, and $1,700 million in 2009;
- Segment financial results of $172 million in 2011, segment financial results of $252 million in 2010, and segment financial losses of $26 million in 2009. 2011 segment financial results consisted of segment income of $76 million from Asia, $44 million from the United Kingdom and Ireland, $42 million from Continental Europe, $19 million from the Middle East and Africa, and $3 million from Australia, partially offset by a segment loss of $12 million from the Americas (excluding the United States). Segment results for 2011 included timeshare-strategy impairment charges for our former Timeshare segment, totaling $86 million associated with the Americas (excluding the United States) and Europe of $84 million and $2 million, respectively. Segment losses for 2009 reflected timeshare-strategy impairment charges and restructuring costs, both for our former Timeshare segment, totaling $176 million associated with the Americas (excluding the United States), Europe, Asia and the United Kingdom and Ireland of $100 million, $47 million, $22 million, and $7 million, respectively; and
- Fixed assets of $402 million in 2011 and $350 million in 2010. At year-end 2011 and year-end 2010, fixed assets located outside the United States are included within the “Property and equipment” caption in our Balance Sheets.
