
Financial Information
Jump to a Section:
PART II
Item 7. Management’s Discussion and Analysis of Financial Condition and Results of Operations.
CONSOLIDATED RESULTS
The following discussion presents an analysis of our consolidated results of operations for 2017, 2016, and 2015. In accordance with GAAP, our Income Statements include Legacy-Starwood’s results of operations from the Merger Date. All references to the effect of Legacy-Starwood operations on our 2017 results refer to the incremental amounts contributed by Legacy-Starwood operations in 2017 over the effect of Legacy-Starwood operations on our results for the period from the Merger Date through December 31, 2016. All references to the effect of the Starwood Combination on our 2016 results refer to the amounts contributed by Legacy-Starwood operations from the Merger Date through December 31, 2016.
Our 2017 results were favorably impacted by the non-recurring gain on the disposition of our ownership interest in Avendra, discussed in Footnote 3 “Acquisitions and Dispositions.” We committed to the owners of the hotels in our system that the benefits derived from Avendra, including any dividends or sale proceeds above our original investment, would be used for the benefit of the hotels in our system. Accordingly, we intend to utilize the net proceeds for the benefit of our system of hotels and are currently developing those plans. Spending under those plans will be expensed in our Income Statements and reduce our profitability in future periods.
Fee Revenues
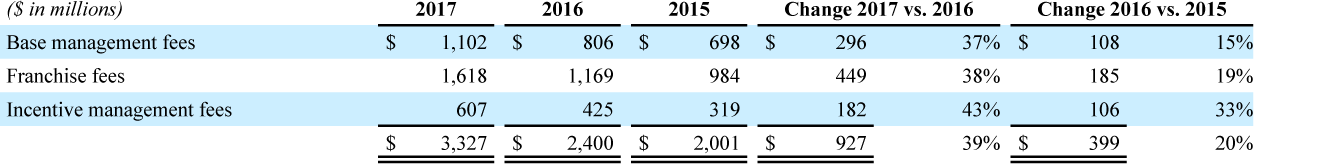
2017 Compared to 2016
The $296 million increase in base management fees primarily reflected $273 million of higher Legacy-Starwood fees, $18 million from stronger sales at Legacy-Marriott comparable properties primarily driven by RevPAR growth, and $14 million from Legacy-Marriott unit growth, partially offset by $6 million of lower fees from Legacy-Marriott properties that converted from managed to franchised and $4 million from Legacy-Marriott net unfavorable exchange rates.
The $449 million increase in franchise fees primarily reflected $346 million of higher Legacy-Starwood fees, $54 million from Legacy-Marriott unit growth, $18 million from Legacy-Marriott RevPAR growth, $14 million of higher Legacy-Marriott branding fees, $11 million of higher Legacy-Marriott relicensing fees, and $7 million of higher fees from Legacy-Marriott properties that converted from managed to franchised.
The $182 million increase in incentive management fees primarily reflected $159 million of higher Legacy-Starwood fees and $22 million from higher net house profits at Legacy-Marriott managed hotels.
In 2017, we earned incentive management fees from 71 percent of our managed properties. In North America, we earned incentive management fees from 60 percent of our managed properties. Outside North America, we earned incentive management fees from 80 percent of our managed properties, representing 62 percent of our total incentive management fees in 2017 from managed properties.
2016 Compared to 2015
The $108 million increase in base management fees was driven by $103 million from the Starwood Combination and the following Legacy-Marriott drivers: the impact of stronger sales at existing properties ($22 million) and unit growth across our system ($15 million), partially offset by the impact of unfavorable foreign exchange rates ($15 million), lower deferred fee recognition ($11 million), and lower fees from properties that converted from managed to franchised ($8 million).
The $185 million increase in franchise fees was driven by $98 million from the Starwood Combination and the following Legacy-Marriott drivers: the impact of unit growth across our system ($48 million), higher branding fees ($39 million), stronger sales at existing properties ($16 million), and higher fees from properties that converted from managed to franchised ($11 million), partially offset by lower relicensing fees ($22 million) and the impact of unfavorable foreign exchange rates ($7 million).
The $106 million increase in incentive management fees was driven by $72 million from the Starwood Combination and the following Legacy-Marriott drivers: higher net house profit and unit growth, higher incentive fees earned from a few limited-service portfolios ($10 million), and higher deferred fee recognition ($8 million), partially offset by the impact of unfavorable foreign exchange rates ($7 million).
In 2016, 69 percent of our Legacy-Marriott managed properties paid incentive management fees to us versus 68 percent in 2015. In North America, 65 percent of Legacy-Marriott managed properties paid incentive management fees in 2016 compared to 63 percent in 2015. Outside North America, 74 percent of Legacy-Marriott managed properties paid incentive management fees in both 2016 and 2015, representing 48 percent of our total incentive management fees in 2016 from Legacy-Marriott managed properties compared to 51 percent of our total incentive management fees in 2015.
Owned, Leased, and Other

2017 Compared to 2016
Owned, leased, and other revenue, net of direct expenses increased by $149 million, primarily due to $160 million of higher Legacy-Starwood owned and leased profits, partially offset by $7 million of net lower Legacy-Marriott owned and leased profits, primarily driven by lower RevPAR in Brazil and properties under renovation.
2016 Compared to 2015
Owned, leased, and other revenue, net of direct expenses increased by $104 million, driven by $78 million from the Starwood Combination and the following Legacy-Marriott changes: $17 million of net stronger performance at several properties following renovations, $15 million overall favorable results across our segments, and $4 million of lower pre-opening costs, partially offset by $10 million of lower profits from properties that converted from owned to managed.