Financial Information
Jump to a Section:
PART II
Item 8. Financial Statements and Supplementary Data.
MARRIOTT INTERNATIONAL, INC.
NOTES TO CONSOLIDATED FINANCIAL STATEMENTS
18. BUSINESS SEGMENTS
We are a diversified global lodging company with operations in the following reportable business segments:
- North American Full-Service, which includes our Luxury and Premium brands located in the U.S. and Canada;
- North American Limited-Service, which includes our Select brands located in the U.S. and Canada; and
- Asia Pacific, which includes all brand tiers in our Asia Pacific region.
The following operating segments do not meet the applicable accounting criteria for separate disclosure as reportable business segments: Caribbean and Latin America, Europe, and Middle East and Africa. We present these operating segments together as “Other International” in the tables below.
We evaluate the performance of our operating segments using “segment profits” which is based largely on the results of the segment without allocating corporate expenses, income taxes, or indirect general, administrative, and other expenses. We assign gains and losses, equity in earnings or losses from our joint ventures, and direct general, administrative, and other expenses to each of our segments. “Unallocated corporate” represents a portion of our revenues, including license fees we receive from our credit card programs and fees from vacation ownership licensing agreements, general, administrative, and other expenses, equity in earnings or losses, and other gains or losses that we do not allocate to our segments. In 2016, “Unallocated corporate” also included the impact of Legacy-Starwood operations for the eight days ended September 30, 2016, as we did not allocate Legacy-Starwood’s results to our segments for the period between the Merger Date and the end of the 2016 third quarter.
Our President and Chief Executive Officer, who is our “chief operating decision maker” (“CODM”), monitors assets for the consolidated company, but does not use assets by operating segment when assessing performance or making operating segment resource allocations.
Segment Revenues
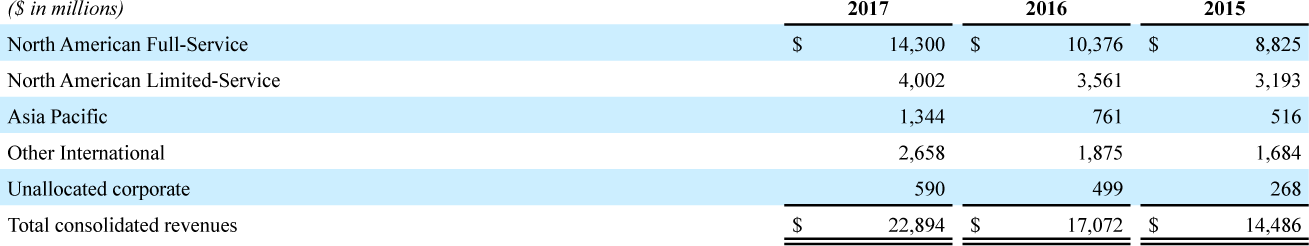
Revenues attributed to operations located outside the U.S. were $4,840 million in 2017, $3,181 million in 2016, and $2,761 million in 2015.
Segment Profits
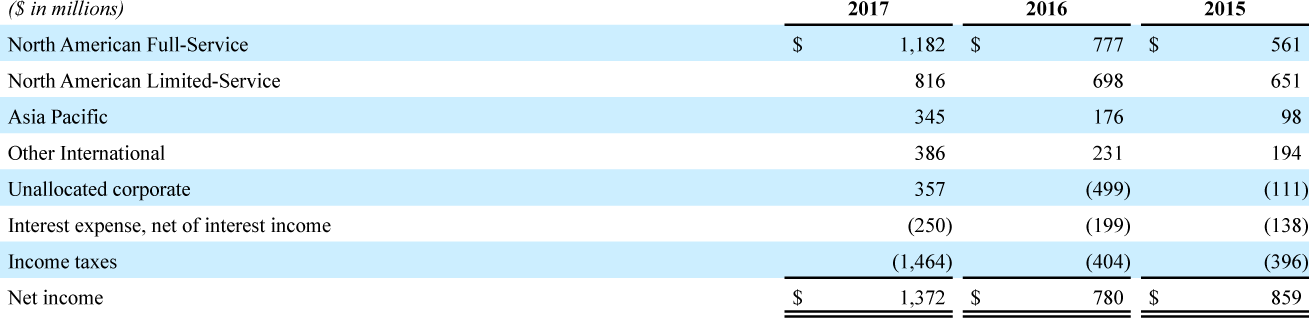
Segment profits attributed to operations located outside the U.S. were $852 million in 2017, $462 million in 2016, and $329 million in 2015. The 2017 segment profits consisted of segment profits of $345 million from Asia Pacific, $212 million from Europe, $111 million from the Caribbean and Latin America, $63 million from the Middle East and Africa, and $121 million from other locations.
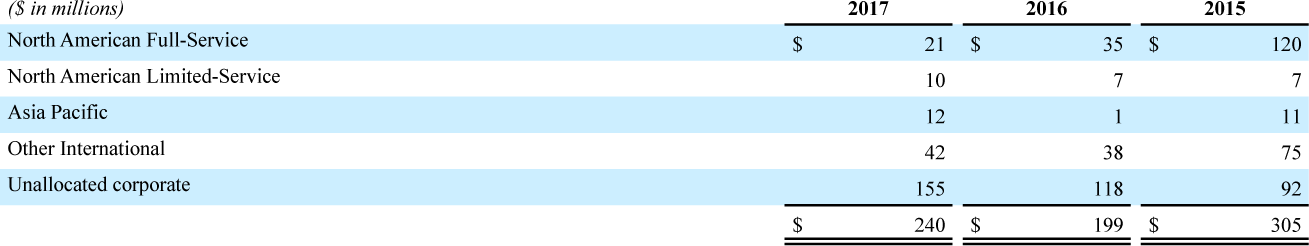
Depreciation and Amortization
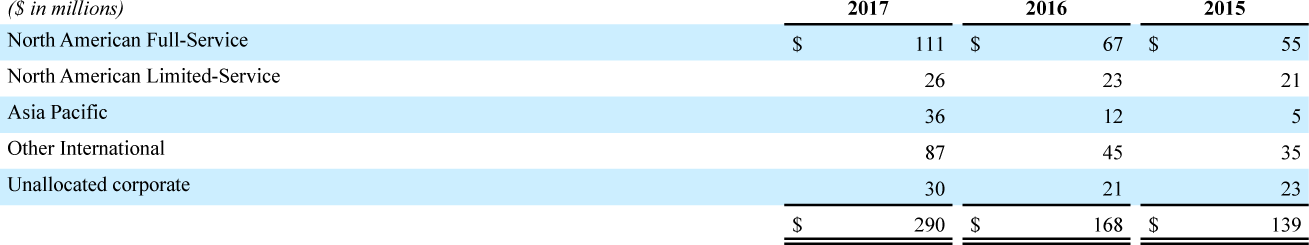
Capital Expenditures