
Financial Information
Jump to a Section:
PART II
Item 7. Management’s Discussion and Analysis of Financial Condition and Results of Operations.
CONSOLIDATED RESULTS
The following discussion presents an analysis of our consolidated results of operations for 2018, 2017, and 2016. In accordance with U.S. generally accepted accounting principles (“GAAP”), our Income Statements include Legacy-Starwood’s results of operations from the Merger Date. All references to the effect of Legacy-Starwood operations on our 2017 results refer to the incremental amounts contributed by Legacy-Starwood operations in 2017 over the effect of Legacy-Starwood operations on our results for the period from the Merger Date through December 31, 2016.
The following discussion also reflects our adoption of several new accounting standards. See the “New Accounting Standards Adopted” caption in Footnote 2. Summary of Significant Accounting Policies for additional information.
Our 2017 results were favorably impacted by the non-recurring gain on the disposition of our ownership interest in Avendra, discussed in Footnote 3. Dispositions and Acquisitions. We committed to the owners of the hotels in our system that the benefits derived from Avendra, including any dividends or sale proceeds above our original investment, would be used for the benefit of the hotels in our system. Accordingly, in 2018 we used $115 million ($85 million after-tax) of the net proceeds, and we intend to use the remainder of the net proceeds, for the benefit of our system of hotels. Spending under those plans is, and will be, expensed in the “Reimbursed expenses” caption of our Income Statements, causing a reduction in our profitability in the periods it is expensed.
Fee Revenues
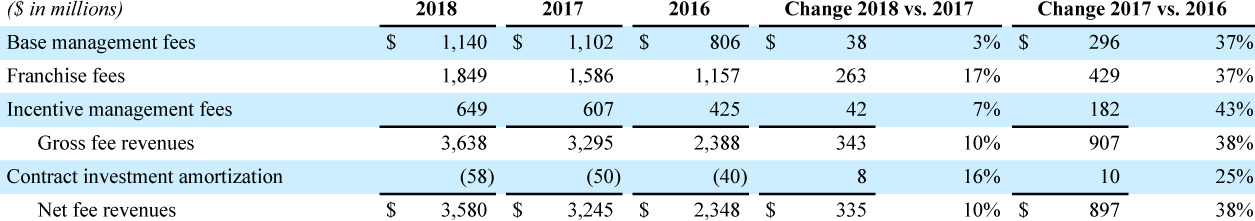
2018 Compared to 2017
The $38 million increase in base management fees primarily reflected $29 million from unit growth, $28 million from RevPAR growth, and $8 million from net favorable foreign exchange rates, partially offset by lower fees of $17 million from properties that converted from managed to franchised and $14 million from properties that were terminated.
The $263 million increase in franchise fees primarily reflected $143 million of higher branding fees, driven by $138 million of higher fees from our co-brand credit card agreements, $82 million from unit growth, $21 million from RevPAR growth, $15 million from properties that converted from managed to franchised, and $6 million of higher relicensing and application fees, partially offset by lower fees of $9 million from properties that were terminated.
The $42 million increase in incentive management fees primarily reflected net higher profits at managed hotels and $14 million from unit growth.
In 2018, we earned incentive management fees from 72 percent of our managed properties worldwide versus 71 percent in 2017. We earned incentive management fees from 59 percent of managed properties in North America and 82 percent of managed properties outside North America in 2018, compared to 60 percent in North America and 80 percent outside North America in 2017. In addition, 63 percent of our total incentive management fees in 2018 came from our managed properties outside North America versus 62 percent in 2017.
2017 Compared to 2016
The $296 million increase in base management fees primarily reflected $273 million of higher Legacy-Starwood fees, $18 million from stronger sales at Legacy-Marriott comparable properties primarily driven by RevPAR growth, and $14 million from Legacy-Marriott unit growth, partially offset by $6 million of lower fees from Legacy-Marriott properties that converted from managed to franchised and $4 million from Legacy-Marriott net unfavorable exchange rates.
The $429 million increase in franchise fees primarily reflected $341 million of higher Legacy-Starwood fees, $54 million from Legacy-Marriott unit growth, $18 million from Legacy-Marriott RevPAR growth, $14 million of higher Legacy-Marriott branding fees, and $7 million of higher fees from Legacy-Marriott properties that converted from managed to franchised.
The $182 million increase in incentive management fees primarily reflected $159 million of higher Legacy-Starwood fees and $22 million from higher net house profits at Legacy-Marriott managed hotels.
The $10 million increase in contract investment amortization primarily reflected $5 million of higher contract write-offs related to terminated contracts at Legacy-Marriott hotels.
Owned, Leased, and Other
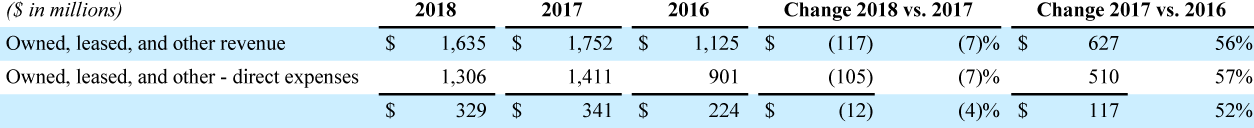
2018 Compared to 2017
Owned, leased, and other revenue, net of direct expenses decreased by $12 million, primarily due to $81 million of lower owned and leased profits attributable to properties sold, partially offset by $51 million of higher termination fees and $17 million of net stronger results at our remaining owned and leased properties.
2017 Compared to 2016
Owned, leased, and other revenue, net of direct expenses increased by $117 million, primarily due to $140 million of higher Legacy-Starwood owned and leased profits, partially offset by $15 million of lower Global Design profits and $7 million of net lower Legacy-Marriott owned and leased profits, primarily driven by lower RevPAR in Brazil and properties under renovation.