Financial Information
Jump to a Section:
PART II
Item 7. Management’s Discussion and Analysis of Financial Condition and Results of Operations.
Lodging Statistics
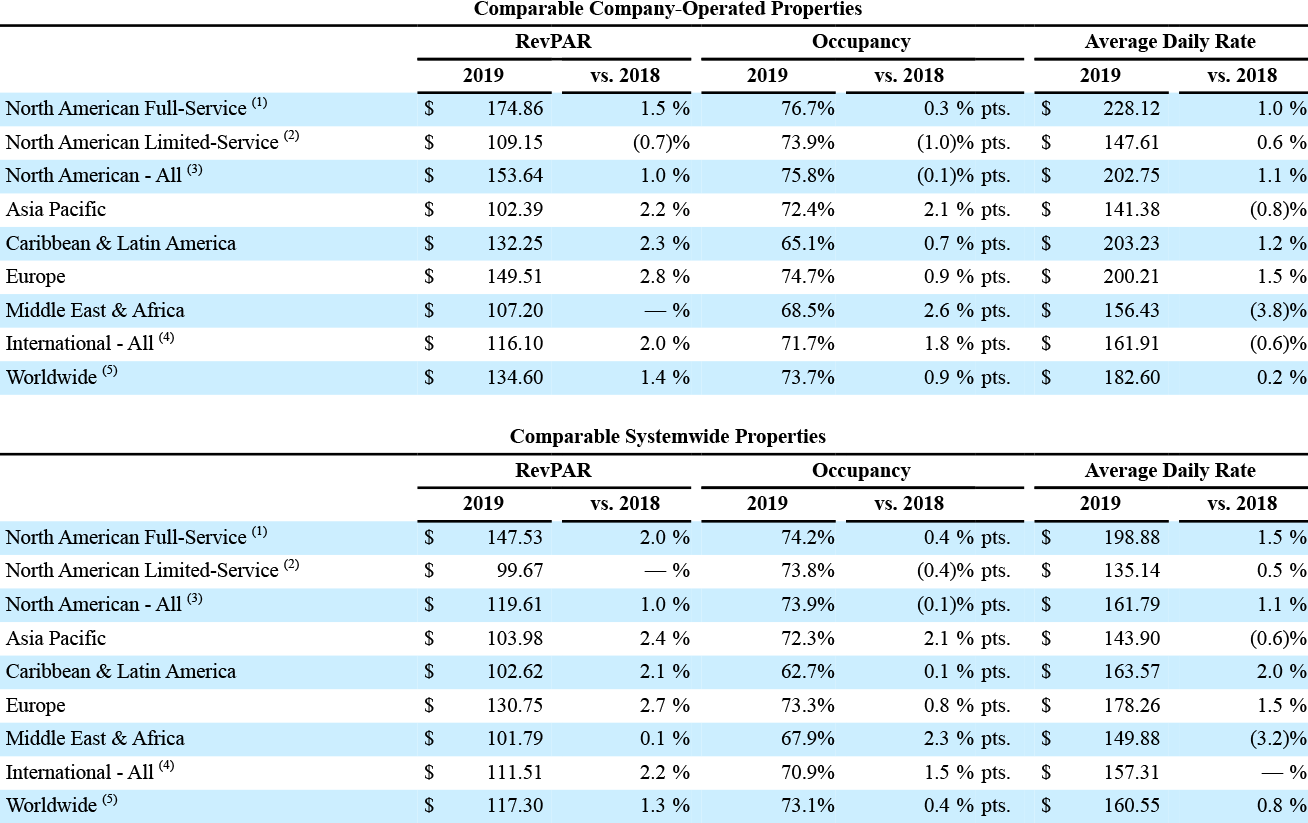
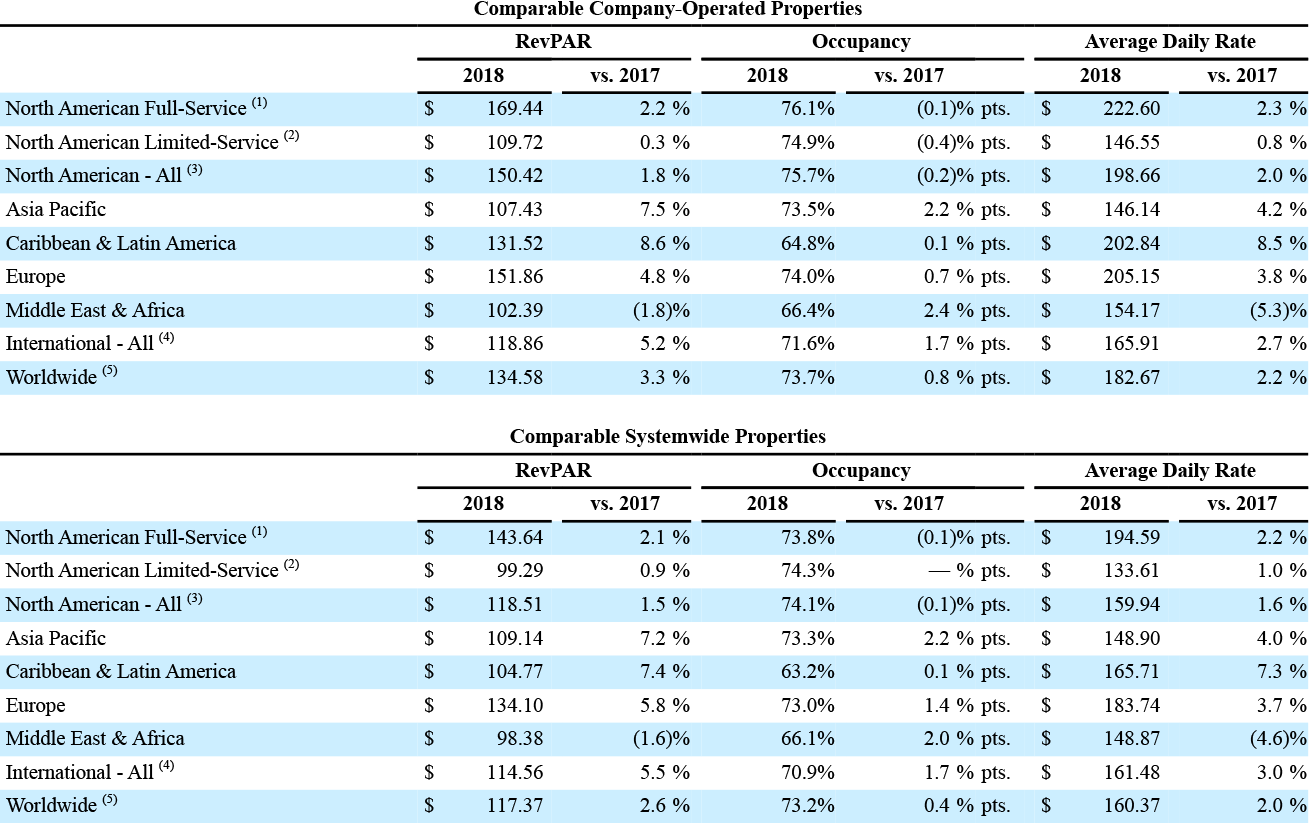
The following tables present RevPAR, occupancy, and ADR statistics for comparable properties for 2019, 2019 compared to 2018, 2018, and 2018 compared to 2017. Systemwide statistics include data from our franchised properties, in addition to our company-operated properties.
2019 Compared to 2018

(1) Includes JW Marriott, The Ritz-Carlton, W Hotels, The Luxury Collection, St. Regis, EDITION, Marriott Hotels, Sheraton, Westin, Renaissance, Autograph Collection, Delta Hotels, Gaylord Hotels, and Le Méridien. Systemwide also includes Tribute Portfolio.
(2) Includes Courtyard, Residence Inn, Fairfield by Marriott, SpringHill Suites, TownePlace Suites, Four Points, Aloft, Element, and AC Hotels by Marriott. Systemwide also includes Moxy.
(3) Includes North American Full-Service and North American Limited-Service.
(4) Includes Asia Pacific, Caribbean & Latin America, Europe, and Middle East & Africa.
(5) Includes North American — All and International — All.
2018 Compared to 2017

(1) Includes JW Marriott, The Ritz-Carlton, W Hotels, The Luxury Collection, St. Regis, EDITION, Marriott Hotels, Sheraton, Westin, Renaissance, Autograph Collection, Delta Hotels, Gaylord Hotels, and Le Méridien. Systemwide also includes Tribute Portfolio.
(2) Includes Courtyard, Residence Inn, Fairfield by Marriott, SpringHill Suites, TownePlace Suites, Four Points, Aloft, Element, and AC Hotels by Marriott. Systemwide also includes Moxy.
(3) Includes North American Full-Service and North American Limited-Service.
(4) Includes Asia Pacific, Caribbean & Latin America, Europe, and Middle East & Africa.
(5) Includes North American — All and International — All.