Basic HTML Version


Gregg J. Mollins,
President and Chief Operating Officer
10
REL I ANCE STEEL & ALUMINUM CO.
GROWING OUR FAMI LY
11
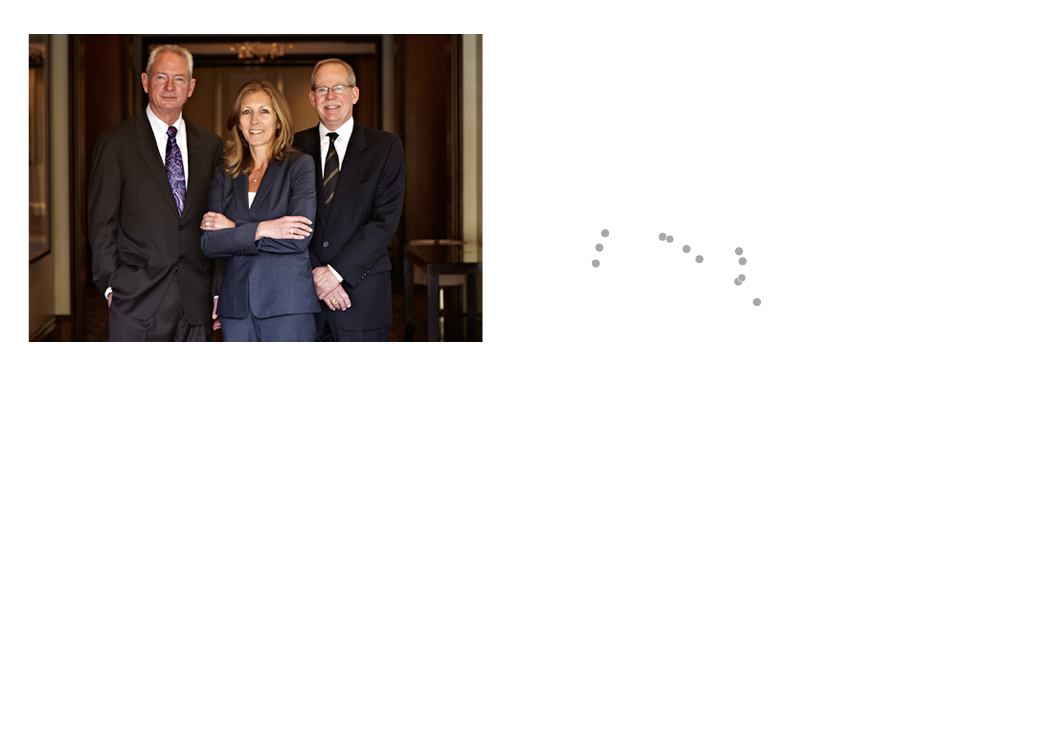
Gregg J. Mollins
President and Chief Operating Officer,
Karla R. Lewis
Executive Vice President and Chief Financial Officer,
David H. Hannah
Chairman of the Board and Chief Executive Officer
Concurrent with our acquisition and organic growth
strategies, we have consistently returned capital to
shareholders through quarterly cash dividends. Reliance
has paid common stock dividends for 54 consecutive
years, including consecutive quarterly dividends since
December 13, 1994, and we have increased our dividend
21 separate times since 1994. Reliance paid cash
dividends totaling $1.26 per share in 2013, an increase
of 57.5% compared to 2012. In addition to providing
investors with a consistently increasing dividend, the
performance of our stock price has been exceptional,
with a compound annual growth rate of nearly 18% in
stock value from our 1994 IPO through December 2013.
Looking ahead, we expect 2014 will be a milestone year
for Reliance as we celebrate our 75th anniversary as
well as our 20th year as an NYSE listed public company.
We continue to look to grow our family of companies
and believe Reliance is well-positioned to take full yet
disciplined advantage of any and all opportunities that
may arise. The major industries that we support are
continuing to improve and we will make every effort to
grow our business with them. Our management teams
and employees in the field have a proven track record of
growing their businesses profitably. We are excited about
the future and want to thank our shareholders, employees,
customers and suppliers for their continued support.
Carbon steel plate
12%
Carbon steel structurals
10%
Carbon steel tubing
9%
Carbon steel bar
8%
Hot rolled steel sheet & coil
7%
Galvanized steel sheet & coil
4%
Cold rolled steel sheet & coil
3%
Aluminum bar & tube
5%
Heat treated aluminum plate
4%
Common alloy aluminum sheet & coil
4%
Common alloy aluminum plate
1%
Heat treated aluminum sheet & coil
1%
Stainless steel bar & tube
7%
Stainless steel sheet & coil
5%
Stainless steel plate
2%
Alloy bar, rod & tube
9%
Alloy plate, sheet & coil
1%
Miscellaneous, including brass, copper & titanium
6%
Toll processing of aluminum, carbon and stainless steel
2%
SALES BY PRODUCT
GEOGRAPHIC PRESENCE
SALES AND LOCATIONS
Alabama
Arizona
Arkansas
California
Colorado
Connecticut
Florida
Georgia
Idaho
Illinois
Indiana
Iowa
Kansas
Kentucky
Louisiana
Maryland
Massachusetts
Michigan
Minnesota
Mississippi
Missouri
Montana
Nevada
New Hampshire
New Jersey
New Mexico
New York
North Carolina
Ohio
Oklahoma
Oregon
Pennsylvania
South Carolina
Tennessee
Texas
Utah
Virginia
Washington
Wisconsin
Australia
Belgium
Canada
China
Malaysia
Mexico
Singapore
South Korea
Turkey
The U.A.E.
United Kingdom
SALES BY REGION
SALES BY COMMODITY
Carbon steel 53%
Aluminum 15%
Stainless steel 14%
Alloy 10%
Other 6%
Toll processing 2%
Midwest 28%
Southeast 18%
West/Southwest 18%
California 10%
Northeast 7%
Mid-Atlantic 6%
International 6%
Pacific Northwest 4%
Mountain 3%
INTERNATIONAL STATES
David H. Hannah,
Chairman of the Board and Chief Executive Officer
Karla R. Lewis,
Executive Vice President and Chief Financial Officer