

COMPENSATION DISCUSSION AND ANALYSIS
| |||||||||||||||||||||||||||||||||||||||||||||||||||||||||||||||||||||||||||||||||||||||||||||||||||||||||||||||||||||||||||||||||||||||||||
| COMPENSATION ELEMENT & TYPE OF COMPENSATION | KEY OBJECTIVES | |
|---|---|---|
Base Salary
|
|
|
| Annual Incentive Awards Results-Based Incentive (RBI)
|
|
|
| Long-Term Incentive Equity Awards Restricted Stock
|
|
Our executives’ total direct compensation reflects a mix of these three elements that meets our compensation objectives. These direct compensation elements are rounded out with certain perquisites and other executive benefits. See “Perquisites and Other Executive Benefits” on page 44. To reinforce the link with shareholders’ interests, we require our executives to own a meaningful amount of stock. See “Stock Ownership and Retention Guidelines” on page 47.
2017 COMPENSATION PROGRAM REVIEW
In 2017, the MDCC requested that its new independent compensation consultant perform a comprehensive review of our executive compensation program, including each element discussed above as well as the indirect elements of compensation. This review confirmed that our executive compensation program and practices, including the program structure and pay mix, were generally aligned with typical peer and recognized market best practices. The review also confirmed general peer and market alignment of the selection of financial performance metrics, their weightings, and Raytheon’s practices for setting performance goals for our short- and long-term incentive plans. The independent compensation consultant also assisted the MDCC in making certain program revisions, as described under “Compensation Program Changes for 2018” on page 33, to further support our compensation philosophy and principles.
OUR 2017 PERFORMANCE
In 2017, our growth strategy continued to deliver results for our shareholders and customers, and we also maintained strong program performance and operating margins. Our global team built upon Raytheon’s return to growth in 2015, driven by increases in both domestic and international sales. 2017 was the 14th consecutive year of international sales growth, which reflects the continued success of our differentiated international strategy. Highlights of our 2017 performance include:
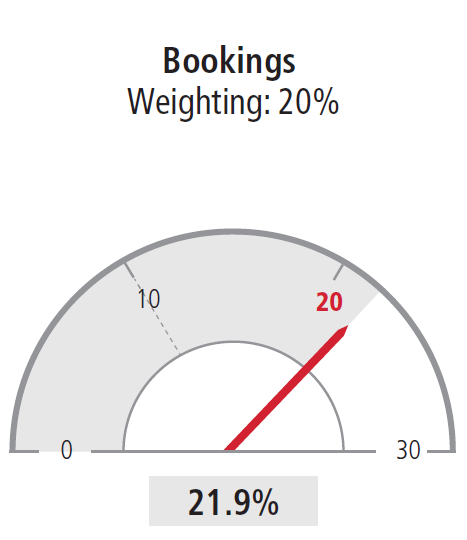
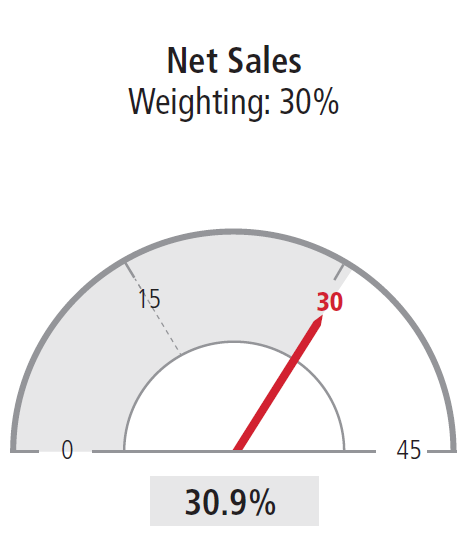
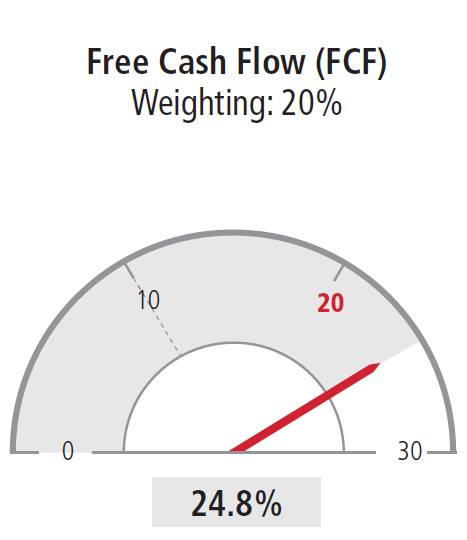
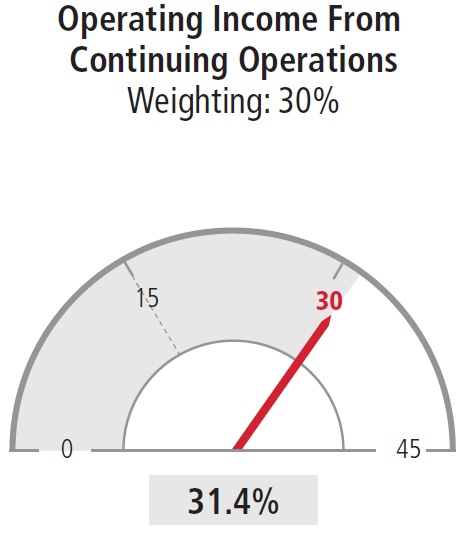
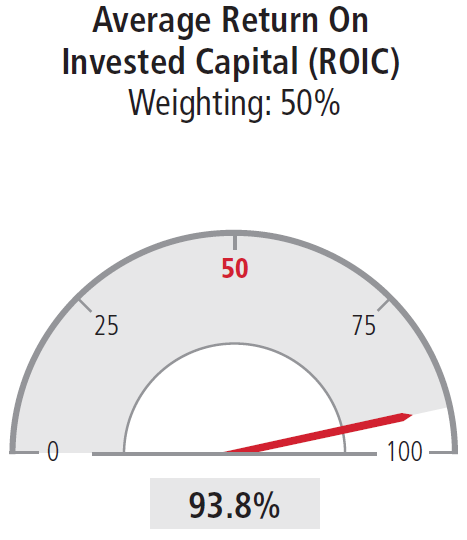
These achievements led us to exceed our 2017 targets on all RBI and LTPP metrics, resulting in the funding levels shown below.
For complete information, see “Executive Compensation in 2017—Annual Cash Incentives—RBI” on page 38.
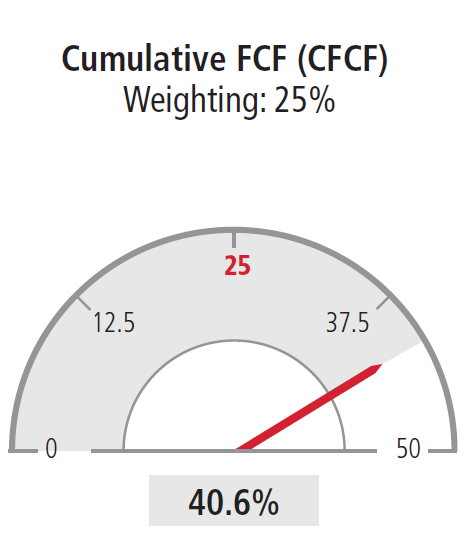
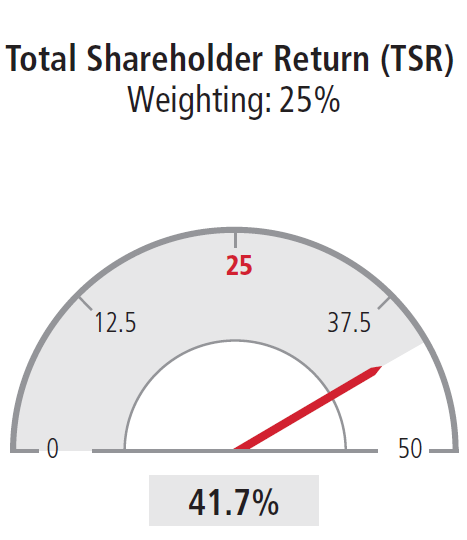
For complete information, see “Executive Compensation in 2017—Long-Term Equity Incentives—LTPP and Restricted Stock” on page 42.
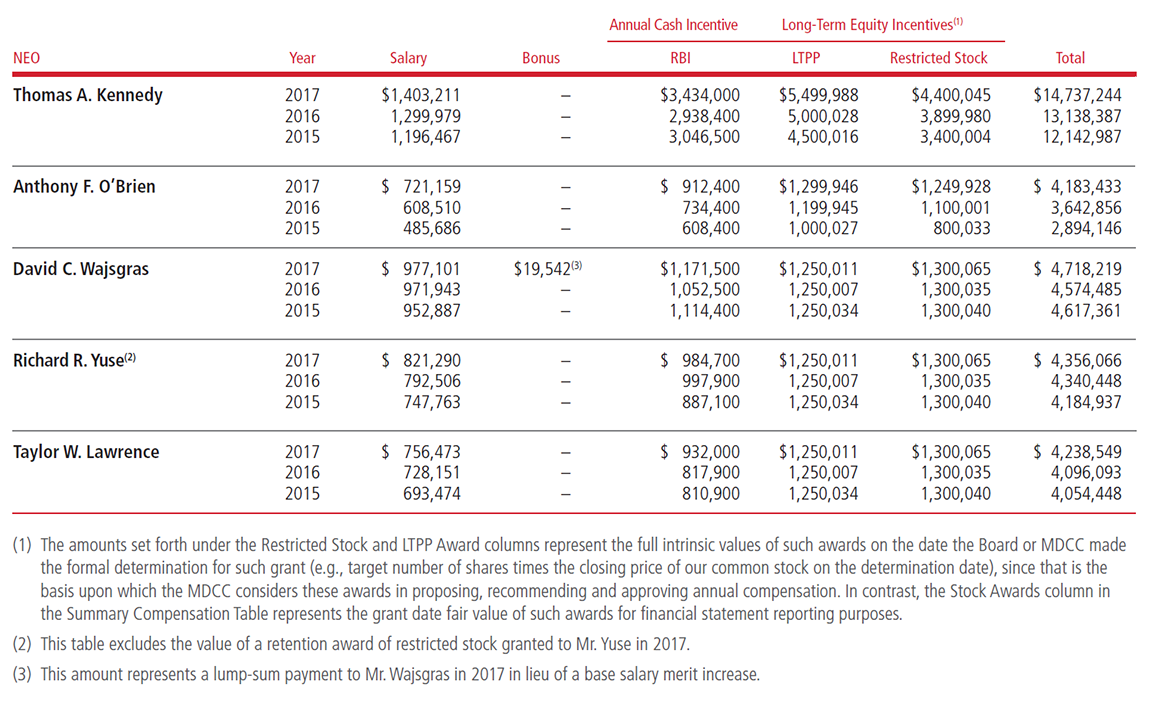
2017 TOTAL DIRECT COMPENSATION
The table below shows the base salary earned, annual cash incentive paid, and equity awards granted to our NEOs for 2015-2017. This supplemental information is not a substitute for the information appearing in the Summary Compensation Table on page 49.
| Annual Cash Incentive | Long-Term Equity |
||||||
| NEO | Year | Salary | Bonus | RBI | LTPP | Restricted Stock | Total |
| Thomas A. Kennedy | 2017 | $1,403,211 | – | $3,434,000 | $5,499,988 | $4,400,045 | $14,737,244 |
| 2016 | 1,299,979 | – | 2,938,400 | 5,000,028 | 3,899,980 | 13,138,387 | |
| 2015 | 1,196,467 | – | 3,046,500 | 4,500,016 | 3,400,004 | 12,142,987 | |
| Anthony F. O’Brien | 2017 | $721,159 | – | $912,400 | $1,299,946 | $1,249,928 | $4,183,433 |
| 2016 | 608,510 | – | 734,400 | 1,199,945 | 1,100,001 | 3,642,856 | |
| 2015 | 485,686 | – | 608,400 | 1,000,027 | 800,033 | 2,894,146 | |
| David C. Wajsgras | 2017 | $977,101 | $1,171,500 | $1,250,011 | $1,300,065 | $4,718,219 | |
| 2016 | 971,943 | – | 1,052,500 | 1,250,007 | 1,300,035 | 4,574,485 | |
| 2015 | 952,887 | – | 1,114,400 | 1,250,034 | 1,300,040 | 4,617,361 | |
| Richard R. |
2017 | $821,290 | – | $984,700 | $1,250,011 | $1,300,065 | $4,356,066 |
| 2016 | 792,506 | – | 997,900 | 1,250,007 | 1,300,035 | 4,340,448 | |
| 2015 | 747,763 | – | 887,100 | 1,250,034 | 1,300,040 | 4,184,937 | |
| Taylor W. Lawrence | 2017 | $756,473 | – | $932,000 | $1,250,011 | $1,300,065 | $4,238,549 |
| 2016 | 728,151 | – | 817,900 | 1,250,007 | 1,300,035 | 4,096,093 | |
| 2015 | 693,474 | – | 810,900 | 1,250,034 | 1,300,040 | 4,054,448 | |
(1) The amounts set forth under the Restricted Stock and LTPP Award columns represent the full intrinsic values of such awards on the date the Board or MDCC made
the formal determination for such grant (e.g., target number of shares times the closing price of our common stock on the determination date), since that is the
basis upon which the MDCC considers these awards in proposing, recommending and approving annual compensation. In contrast, the Stock Awards column in
the Summary Compensation Table represents the grant date fair value of such awards for financial statement reporting purposes.
(2) This table excludes the value of a retention award of restricted stock granted to Mr. Yuse in 2017.
(3) This amount represents a lump-sum payment to Mr. Wajsgras in 2017 in lieu of a base salary merit increase.