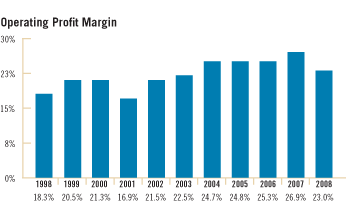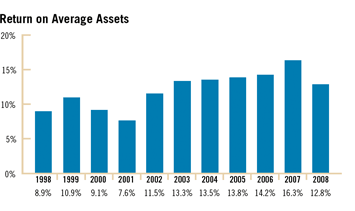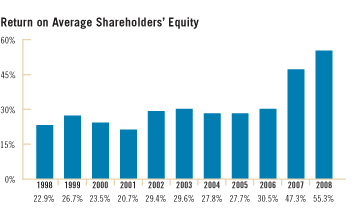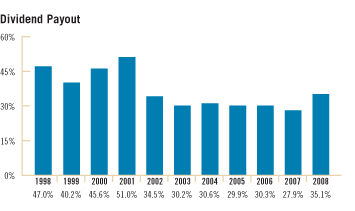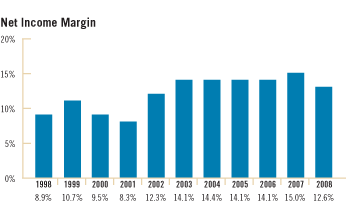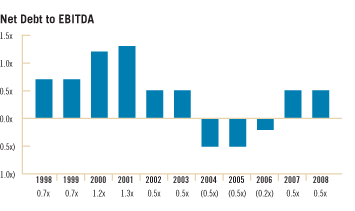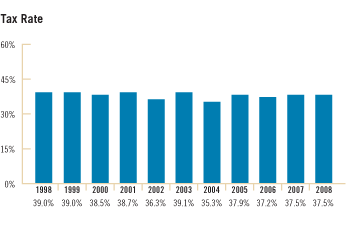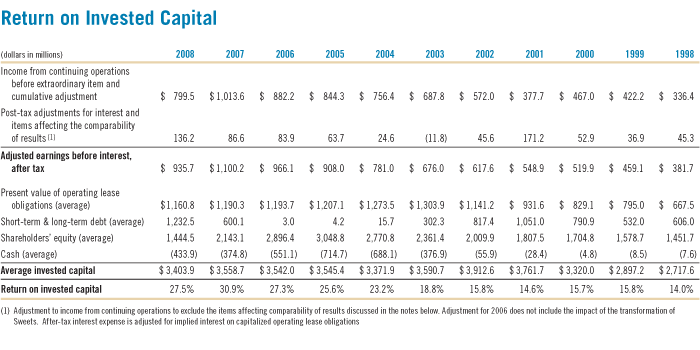
Eleven-Year Key Ratios
Click for notes
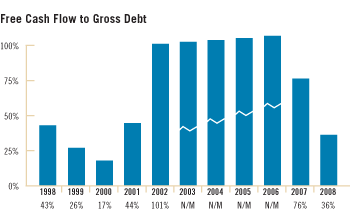
Please refer to free
cash flow table
N/M indicates a non-meaningful or non-calculable variance
Notes for Eleven-Year Key Ratios:
| Certain prior year amounts have been reclassified for comparability purposes | |
| The following items affecting comparability of results were included in the calculation of the eleven-year key ratios: | |
| 2008: | Includes a $73.4 million pre-tax restructuring charge ($45.9 million after-tax, or $0.14 per diluted share) |
| The Corporation adopted Statement of Financial Accounting Standards No. 160, “Noncontrolling interests in Consolidated Financial Statements, an amendment of ARB 51” (SFAS 160), in the first quarter of 2009. Please refer to 2008 Operating Profit/(Loss) and Operating Profit Margin by Segment, as adjusted for SFAS 160 | |
| 2007: | Includes a $43.7 million pre-tax restructuring charge ($27.3 million after-tax, or $0.08 per diluted share) and a $17.3 million pre-tax gain ($10.3 million after-tax, or $0.03 per diluted share) on the sale of the Corporation’s mutual fund data business and the impact of the Sweets transformation (see 2006 note below) |
| 2006: | Includes a $31.5 million pre-tax restructuring charge ($19.8 million after-tax, or $0.06 per diluted share) and a $21.1 million pre-tax deferral of operating profit ($13.3 million after-tax charge, or $0.04 per diluted share) due to a change in revenue recognition related to the transformation of the Sweets building products database from a primarily print catalog offering to an integrated online service, which was recognized ratably over 2007. In 2006, the Corporation adopted Financial Accounting Standards Board Statement No. 123(R), “Share Based Payment.” The Corporation incurred stock-based compensation expense of $136.2 million ($85.5 million after-tax, or $0.23 per diluted share). Included in this expense is a one-time charge for the elimination of the Corporation’s restoration stock option program of $23.8 million ($14.9 million after-tax, or $0.04 per diluted share) |
| 2005: | Includes a $6.8 million pre-tax gain ($4.2 million after-tax, or $0.01 per diluted share) on the sale of the Corporate Value Consulting business, a $5.5 million loss ($3.3 million after-tax) on the sale of the Healthcare Information Group, and a $23.2 million pre-tax restructuring charge ($14.6 million after-tax, or $0.04 per diluted share) |
| Includes a $10.0 million ($0.03 per diluted share) increase in income taxes on the repatriation of funds | |
| 2004: | The Corporation reclassified revenue in accordance with Emerging Issues Task Force 00-10, “Accounting for Shipping and Handling Fees and Costs,” resulting in an increase in revenue in all years presented |
| Includes a non-cash benefit of approximately $20.0 million ($0.05 per diluted share) as a result of the Corporation’s completion of various federal, state and local, and foreign tax audit cycles | |
| In the first quarter of 2004 the Corporation accordingly removed approximately $20.0 million from its accrued income tax liability accounts. This non-cash item resulted in a reduction to the overall effective tax rate from continuing operations to 35.3% | |
| 2003: | Income from continuing operations includes a pre-tax gain on sale of real estate of $131.3 million ($58.4 million after-tax gain, or $0.15 per diluted share) |
| 2002: | $14.5 million pre-tax loss on the disposition of MMS International. The variance between the $14.5 million pre-tax loss and the $2.0 million after-tax benefit on the sale of MMS International is the result of previous book write-downs and the inability of the Corporation to take a tax benefit for the write-downs until the unit was sold. This transaction reduced the effective tax rate by 1.2 percentage points |
| 2001: | $159.0 million pre-tax charge for restructuring and asset write-down ($112.0 million after-tax, or $0.29 per diluted share). A $26.3 million after-tax gain ($8.8 million pre-tax, or $0.07 per diluted share) from the divestiture of DRI. The variance between the pre-tax gain and the after-tax benefit—which reduced the effective tax rate by 3.4 percentage points—is the result of previous book write-downs and the inability of the Corporation to take a tax benefit for the write-downs until the unit was sold. Also included in the effective tax rate was the write-down of certain assets, the shutdown of the Blue List, and the contribution of Rational Investors to mPower.com in exchange for an equity position in the company. The total charge for these items was $21.9 million after-tax ($22.8 million pre-tax, or $0.06 per diluted share). This transaction increased the effective tax rate by 1.3 percentage points due to the Corporation’s inability to take a benefit for these write-downs. Also included in income from continuing operations is a $6.9 million pre-tax gain on the sale of real estate ($4.2 million after-tax, or $0.01 per diluted share) |
| 2000: | $16.6 million pre-tax gain ($10.2 million after-tax) on the sale of Tower Group International; $68.1 million after-tax cumulative change in accounting related to the implementation of SAB 101, “Revenue Recognition in Financial Statements” |
| 1999: | $39.7 million pre-tax gain ($24.2 million after-tax) on the sale of the Petrochemical publications |
| 1998: | $26.7 million pre-tax gain ($16.3 million after-tax) on the sale of a building; $16.0 million pre-tax charge ($9.8 million after-tax) at Continuing Education Center for write-down of assets; $8.7 million after-tax loss on the early extinguishment of debt |
For More Information
