

 |
 |
 |
||||||||||
 |
||||||||||||
 |
||||||||||||
 |
||||||||||||
Download 2000 MD&A and Consolidated Financial Statements PDF (file size 258k)
| <Previous> |
Download 2000 MD&A and Consolidated Financial Statements PDF (file size 258k)
| For the years ended December 31, |
Increase/(Decrease)
|
||||||||
| (Millions, except per share amounts, customers in thousands) |
2000
|
1999
|
Amount
|
%
|
1998
|
||||
|
|
|||||||||
| FROM CURRENT BUSINESSES: | |||||||||
| Revenues and Sales | |||||||||
|
|
|
|
|||||||
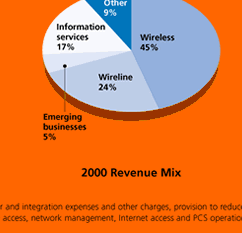
| Wireless |
$3,332.6
|
$2,902.2
|
$430.4
|
15
|
$2,493.7
|
||||
| Wireline |
1,757.4
|
1,677.5
|
79.9
|
5
|
1,499.2
|
||||
| Emerging businesses |
399.7
|
280.4
|
119.3
|
43
|
167.3
|
||||
|
––––––––
|
––––––––
|
–––––
|
––––––––
|
||||||
| Total communications |
5,489.7
|
4,860.1
|
629.6
|
13
|
4,160.2
|
||||
| Information services |
1,279.9
|
1,245.5
|
34.4
|
3
|
1,161.8
|
||||
| Other operations |
634.2
|
579.8
|
54.4
|
9
|
601.3
|
||||
|
––––––––
|
––––––––
|
–––––
|
––––––––
|
||||||
| Total business segments |
7,403.8
|
6,685.4
|
718.4
|
11
|
5,923.3
|
||||
| Less: intercompany eliminations |
325.4
|
224.0
|
101.4
|
45
|
142.6
|
||||
|
––––––––
|
––––––––
|
–––––
|
––––––––
|
||||||
| Total revenues and sales |
$7,078.4
|
$6,461.4
|
$617.0
|
10
|
$5,780.7
|
||||
|
|
|||||||||
| EBITDA: | |||||||||
| Wireless |
$1,317.2
|
$1,237.8
|
$79.4
|
6
|
$994.2
|
||||
| Wireline |
1,024.5
|
942.8
|
81.7
|
9
|
820.1
|
||||
| Emerging businesses |
10.1
|
(19.9)
|
30.0
|
151
|
(23.8)
|
||||
|
––––––––
|
––––––––
|
–––––
|
––––––––
|
||||||
| Total communications |
2,351.8
|
2,160.7
|
191.1
|
9
|
1,790.5
|
||||
| Information services |
339.1
|
319.4
|
19.7
|
6
|
301.4
|
||||
| Other operations |
23.8
|
22.8
|
1.0
|
4
|
27.7
|
||||
|
––––––––
|
––––––––
|
–––––
|
––––––––
|
||||||
| Total business segments |
2,714.7
|
2,502.9
|
211.8
|
8
|
2,119.6
|
||||
| Less: corporate expenses |
21.9
|
25.1
|
(3.2)
|
(13)
|
12.1
|
||||
|
––––––––
|
––––––––
|
–––––
|
––––––––
|
||||||
| Total EBITDA |
$2,692.8
|
$2,477.8
|
215.0
|
9
|
$2,107.5
|
||||
|
|
|||||||||
| Operating income (loss): | |||||||||
| Wireless |
$879.2
|
$886.5
|
$(7.3)
|
(1)
|
$674.6
|
||||
| Wireline |
679.3
|
619.1
|
60.2
|
10
|
530.6
|
||||
| Emerging businesses |
(23.9)
|
(47.3)
|
23.4
|
49
|
(38.0)
|
||||
|
––––––––
|
––––––––
|
–––––
|
––––––––
|
||||||
| Total communications |
1,534.6
|
1,458.3
|
76.3
|
5
|
1,167.2
|
||||
| Information services |
185.0
|
175.3
|
9.7
|
6
|
162.7
|
||||
| Other operations |
22.1
|
21.6
|
0.5
|
2
|
25.9
|
||||
|
––––––––
|
––––––––
|
–––––
|
––––––––
|
||||||
| Total business segments |
1,741.7
|
1,655.2
|
86.5
|
5
|
1,355.8
|
||||
| Less: corporate expenses |
37.3
|
39.6
|
(2.3)
|
(6)
|
22.9
|
||||
|
––––––––
|
––––––––
|
–––––
|
––––––––
|
||||||
| Total operating income |
$1,704.4
|
$1,615.6
|
$88.8
|
5
|
$1,332.9
|
||||
|
|
|||||||||
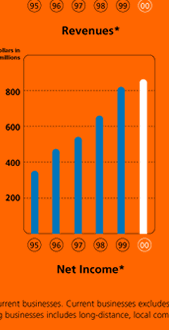
| Net income |
$863.1
|
$822.5
|
$40.6
|
5
|
$660.1
|
||||
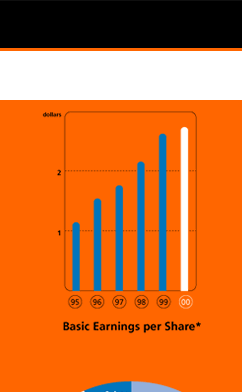
| Basic earnings per share |
$2.74
|
$2.63
|
$.11
|
4
|
$2.16
|
||||
| Diluted earnings per share |
$2.72
|
$2.59
|
$.13
|
5
|
$2.14
|
||||
|
|
|||||||||
| AS REPORTED: | |||||||||
| Revenues and sales |
$7,067.0
|
$6,461.4
|
$605.6
|
9
|
$5,780.7
|
||||
| Operating income |
$1,667.5
|
$1,525.1
|
$142.4
|
9
|
$1,025.9
|
||||
| Net income |
$1,928.8
|
$783.6
|
$1,145.2
|
146
|
$603.1
|
||||
| Basic earnings per share |
$6.13
|
$2.50
|
$3.63
|
145
|
$1.97
|
||||
| Diluted earnings per share |
$6.08
|
$2.47
|
$3.61
|
146
|
$1.95
|
||||
| EBITDA |
$2,655.9
|
$2,387.3
|
$268.6
|
11
|
$1,800.5
|
||||
|
|
|||||||||
| Weighted average common shares: | |||||||||
| Basic |
314.4
|
312.8
|
1.6
|
1
|
305.3
|
||||
| Diluted |
317.2
|
316.8
|
0.4
|
—
|
308.4
|
||||
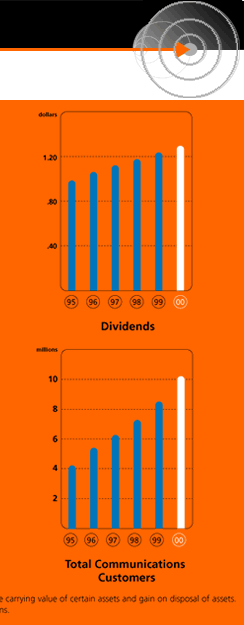
| Annual dividend per common share |
$1.32
|
$1.28
|
$.04
|
3
|
$1.22
|
||||
|
|
|||||||||
| CAPITAL EXPENDITURES |
$1,164.7
|
$1,006.5
|
$158.2
|
16
|
$998.0
|
||||
|
|
|||||||||
| AT YEAR END: | |||||||||
| Total assets |
$12,182.0
|
$10,774.2
|
$1,407.8
|
13
|
$10,155.5
|
||||
| Wireless customers |
6,300.0
|
5,018.6
|
1,281.4
|
26
|
4,452.0
|
||||
| Wireline customers |
2,572.3
|
2,433.1
|
139.2
|
6
|
2,181.9
|
||||
| Long-distance customers |
1,119.0
|
894.2
|
224.8
|
25
|
576.5
|
||||
| Current businesses excludes merger and integration
expenses and other charges, provision to reduce carrying value of certain
assets and gain on disposal of assets. Emerging businesses includes long-distance, local competitive access, network management, Internet access and PCS operations. EBITDA represents earnings before interest, taxes, depreciation and amortization. |
|
| <Previous> | |