| Our net earnings were $935 million in 1998, compared with $751 million in 1997 and $463 million in 1996. Earnings per share were $1.98 in 1998, $1.59 in 1997 and $.97 in 1996. (References to earnings per share refer to diluted earnings per share. Earnings per share, dividends per share and common shares outstanding reflect our 1998 two-for-one share split and our three-for-one share split in 1996.) | 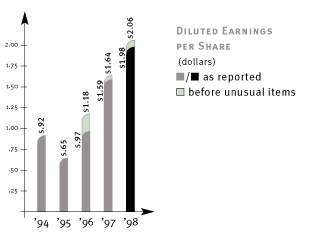 |
| Earnings Analysis | ||||||
| (Millions of Dollars, Except per Share Data) | ||||||
| Earnings | Diluted Earnings per Share | |||||
| 1998 | 1997 | 1996 | 1998 | 1997 | 1996 | |
| Net earnings before unusual items | $970 | $775 | $555 | $2.06 | $1.64 | $1.18 |
| Favorable outcome of inventory shortage tax matter | 20 | – | – | .04 | – | – |
| Securitization gain (pre-tax 1998 $35 mil, 1997 $45 mil) | 21 | 27 | – | .05 | .06 | – |
| Securitization loss (pre-tax 1998 $38 mil) | (23) | – | – | (.05) | – | – |
| Net securitization gain/(loss) | (2) | 27 | – | – | .06 | – |
| Mainframe outsourcing (pre-tax 1998 $42 mil) | (26) | – | – | (.06) | – | – |
| Real estate repositioning (pre-tax 1996 $134 mil) | – | – | (81) | – | – | (.18) |
| Net earnings before extraordinary charges | 962 | 802 | 474 | 2.04 | 1.70 | 1.00 |
| Extraordinary charges — debt repurchase | (27) | (51) | (11) | (.06) | (.11) | (.03) |
| Net earnings | $935 | $751 | $463 | $1.98 | $1.59 | $ .97 |
Pre-tax Segment Profit
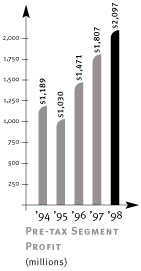 Pre-tax segment profit increased 16 percent in 1998 to $2,097 million, compared with $1,807 million in 1997 and $1,471 million in 1996. Pre-tax segment profit is first-in, first-out (FIFO) earnings before securitization effects, interest, corporate and other expense, and unusual items. Target and the Department Store Division (DSD) both contributed to our pre-tax profit growth, which was partially offset by Mervyn's performance. We expect growth in profitability at all three operating companies in 1999.
Target's pre-tax profit rose 23 percent in 1998 to $1,578 million. Target's full-year profit margin rate increased to 6.8 percent in 1998 from 6.3 percent in 1997, reflecting continued strong comparable-store sales growth of 6.1 percent and modest improvement in the gross margin rate due primarily to favorable markdown performance. The operating expense rate improved slightly from 1997, reflecting favorable sales leverage and store productivity, offset by higher wage rates. Continued growth in guest credit also contributed to improved sales and earnings. In 1999, we expect our profit margin rate to remain essentially unchanged and total revenues are expected to grow due to mid-single-digit comparable-store sales increases combined with new store sales growth.
Mervyn's pre-tax profit declined 14 percent in 1998 to $240 million. Comparable-store sales grew 0.9 percent. The gross margin rate declined due to unfavorable markdown performance, partially offset by improved markup, and the expense rate increased due to lower sales leverage. Guest credit continued to positively impact Mervyn's sales and earnings in 1998. Continuing the improved trend from fourth quarter 1998, we expect measurable improvement in our 1999 profit margin rate and a low to mid-single-digit comparable-store sales increase.
DSD's pre-tax profit in 1998 was $279 million, a 16 percent increase over 1997, reflecting comparable-store sales growth of 4.5 percent and a significant improvement in the gross margin rate, due to improved markdowns and markup. Comparable-store sales are expected to grow in the low-single-digits in 1999 and our profit margin rate is expected to increase modestly from 1998.
Revenues and Comparable-Store Sales
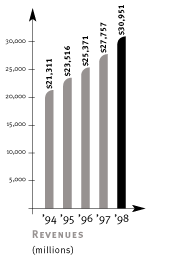 In 1998, our total revenues increased 11.5 percent and comparable-store sales increased 5.2 percent. Revenues include retail sales, finance charges, late fees and other revenues. Comparable-store sales are sales from stores open longer than one year. Target's revenue growth reflected strong comparable-store sales and new store expansion. Mervyn's 1998 total revenues declined, due in part to store closings during 1997. Mervyn's sales trend improved in the fourth quarter, reflecting continued focus on merchandising and marketing initiatives. DSD's total revenue growth reflected strong comparable-store sales. Increased finance charge and late fee revenues also contributed to revenue growth.
Revenue growth in 1997 reflected a combination of new store and comparable-store sales growth at Target and comparable-store sales growth at Mervyn's and DSD, somewhat offset by a decline in Mervyn's total revenue due to closed stores.
The impact of inflation on our consolidated operations was minimal and, as a result, the overall comparable-store sales increase closely approximated real growth.
| Revenues and Comparable-Store Sales Growth | ||||||||
| 1998 | 1997 | |||||||
| Revenues | Comparable Store Sales | Revenues | Comparable Store Sales | |||||
| Target | 13.2 | % | 6.1 | % | 14.1 | % | 5.7 | % |
| Mervyn's | (1.2) | 0.9 | (3.3) | 1.9 | ||||
| DSD | 3.9 | 4.5 | 0.4 | 1.0 | ||||
| Total | 11.5 | % | 5.2 | % | 9.4 | % | 4.5 | % |
| Revenues per Square Foot* | |||
| (Dollars) | 1998 | 1997 | 1996 |
| Target | $253 | $244 | $235 |
| Mervyn's | 192 | 187 | 179 |
| DSD | 235 | 224 | 223 |
| *Thirteen-month average retail square feet. | |||
Gross Margin Rate
In 1998, our overall gross margin rate improved modestly from the prior year. Gross margin includes cost of retail sales and excludes buying and occupancy costs. Strong growth at Target, our lowest gross margin rate division, continues to impact our business mix.
Target's gross margin rate increased modestly in 1998 primarily due to lower markdowns. In 1999, we anticipate the gross margin rate to be essentially even with 1998.
Mervyn's gross margin rate decreased reflecting unfavorable markdown performance, partially offset by higher markup. In 1999, we expect Mervyn's gross margin rate to increase as we continue to improve the quality and trend content of our merchandise.
DSD's gross margin rate increased significantly over 1997 due to improved markdowns and markup. In 1999, we anticipate DSD's gross margin rate will increase modestly.
In 1997, our overall gross margin rate was essentially even with the prior year, reflecting improved markup, partially offset by higher markdowns, at all three divisions.
The LIFO provision, included in cost of retail sales, was as follows:
| LIFO Provision: Credit/(Expense) | ||||||
| (Millions of Dollars, Except per Share Data) | ||||||
| 1998 | 1997 | 1996 | ||||
| Target | $ | – | $ | – | $ | – |
| Mervyn's | 6 | – | 5 | |||
| DSD | 12 | (6) | (14) | |||
| Total | $ | 18 | $ | (6) | $ | (9) |
| Per share | $ | .02 | $ | (.01) | $ | (.01) |
The LIFO provision is calculated based on inventory levels, markup rates and internally generated retail price indices. The 1998 LIFO credit at Mervyn's resulted primarily from higher inventory levels, reflecting an investment in certain categories to improve basic in-stock positions. The LIFO credit at DSD resulted from higher markup. The 1997 LIFO charge at DSD resulted from lower inventory levels.
Operating Expense Rate
Our overall operating expense rate was essentially even with 1997. Operating expense includes selling, publicity and administrative expenses (excluding start-up, and corporate and other expense), depreciation and amortization, buying and occupancy costs, and taxes other than income taxes. Target's strong growth continues to impact our overall expense rate structure.
Target's operating expense rate improved slightly over 1997. In 1998, we completed our three-year program to remove $200 million from operating expenses. As previously disclosed, wage rate pressure within our competitive markets somewhat offset our 1998 savings. In 1999, we will remain focused on controlling our expenses, principally through improved productivity.
Mervyn's operating expense rate increased in 1998 due to lower sales leverage. We anticipate an improved rate in 1999 due to our expectation of improved comparable-store sales results.
DSD's operating expense rate was essentially unchanged from 1997. In 1999, we expect DSD's operating expense rate to be even with 1998.
The operating expense rate in 1997 improved over 1996 due to the favorable effect of Target's increased impact on the overall expense rate structure and significant operating expense rate improvements at DSD.
Interest Expense
We consider payments to holders of our sold securitized receivables as "interest equivalent." In 1998, combined interest expense and interest equivalent was $446 million, $3 million lower than 1997 due to a lower average portfolio interest rate, partially offset by higher average funded balances. The average portfolio interest rate in 1998 was 7.8 percent. In 1997, combined interest expense and interest equivalent was $18 million lower than 1996 due to a lower average portfolio rate and lower average funded balances. The average portfolio interest rate in 1997 was 8.1 percent. Combined interest expense and interest equivalent in 1999 is expected to be similar to 1998. The average portfolio interest rate is expected to continue to decline, offset by higher average funded balances.
During 1998, we repurchased $127 million of debt for $170 million, resulting in an after-tax extraordinary charge of $27 million ($.06 per share). The debt repurchased had a weighted-average interest rate of 9.2 percent and an average remaining life of 21 years. The replacement of this debt with lower interest rate financing will have a favorable impact on interest expense going forward. In 1997 and 1996, we repurchased $503 and $325 million of long-term debt, resulting in after-tax extraordinary charges of $51 million ($.11 per share) and $11 million ($.03 per share), respectively.
Income Tax Rate
The effective tax rate was 38.2 percent in 1998 and 39.5 percent in both 1997 and 1996. The 1998 effective tax rate reflects the beneficial effect of $20 million ($.04 per share), resulting from the favorable outcome of our inventory shortage tax matter. Our 1999 tax rate is expected to approximate 39.0 percent.
Securitized Receivables
During third quarter 1998, Dayton Hudson Receivables Corporation (DHRC), a special-purpose subsidiary, sold to the public $400 million of securitized receivables. This issue of asset-backed securities had an expected maturity of five years and a stated rate of 5.90 percent. Proceeds from the sale were used for general corporate purposes, including funding the growth of receivables. As required by Statement of Financial Accounting Standards (SFAS) No. 125, the sale transaction resulted in a $35 million pre-tax gain ($.05 per share). This gain was offset by a $38 million pre-tax charge ($.05 per share) related to the maturity of our 1995 securitization. The net impact was a $3 million (less than $.01 per share) reduction of 1998 finance charge revenues and pre-tax earnings.
In 1997, DHRC sold to the public $400 million of securitized receivables, with an expected maturity of five years and a stated rate of 6.25 percent. This transaction resulted in a $32 million pre-tax gain. Additionally, 1997 results included a $13 million pre-tax gain attributable to the application of SFAS No. 125 to our 1995 securitization. Combined, these gains resulted in a $45 million ($.06 per share) increase in finance charge revenues and pre-tax earnings.
Our Consolidated Results of Operations also include reductions of finance charge revenues and bad debt expense related to the sold securitized receivables. These amounts represent payments to holders of our sold securitized receivables and are included in our pre-tax earnings reconciliation as interest equivalent. Interest equivalent was $48 million in 1998, $33 million in 1997 and $25 million in 1996. During 1999, our current $800 million of sold securitized receivables will result in approximately $12 million of interest equivalent per quarter.
Mainframe Outsourcing
In fourth quarter 1998, we obtained Board of Directors approval and announced our plan to outsource our mainframe computer data center functions. Subsequently, we finalized a contract with a vendor to provide us with these functions. As part of the plan, we will sell our mainframe equipment to the vendor and eliminate approximately 110 employee positions. The fourth quarter 1998 associated expenses were $42 million ($.06 per share) and are included in selling, publicity and administrative expenses.
The expenses recognized in the fourth quarter include $36 million for the write-down of mainframe equipment, $4 million in one-time, incremental fees and $2 million in employee severance. In 1999, we expect to expense an additional $5 million to $10 million related to the outsourcing and to complete the transition by the third quarter.
Real Estate Repositioning
In 1996, we recorded a pre-tax charge of $134 million ($.18 per share) for real estate repositioning at Mervyn's and DSD to strengthen competitive positions and achieve improved long-term results. The charge included $114 million for Mervyn's to sell or close its 25 stores in Florida and Georgia, and approximately ten other under-performing stores throughout the chain. Also included was a net pre-tax charge of $20 million for DSD's sale of its Texas stores and the closure of two other stores.
As of year-end 1998, we have substantially completed our repositioning activities. Mervyn's has sold 24 stores and closed eight under-performing stores, while DSD has sold all stores included in the plan. Exit costs incurred in 1998 and 1997 (approximately $5 million and $17 million, respectively) were charged against the reserve. The reserve remaining at year-end 1998 was $20 million, representing the estimated costs that will be incurred to sell the closed stores.
Start-up Expense
In first quarter 1999, we will adopt Statement of Position (SOP) 98-5, "Reporting on the Costs of Start-Up Activities." The adoption will not impact total year start-up expense, but will shift approximately $15 million of start-up expense out of first quarter 1999 into the remaining quarters. Substantially all of this effect will be at Target.
Year 2000 Readiness Disclosure
We began mitigating the risks associated with the year 2000 date conversion in 1993. In 1997, we established a corporate-wide, comprehensive plan of action designed to achieve an uninterrupted transition into the year 2000. This project includes three major elements: 1) information technology (IT) systems, 2) non-IT, or embedded technology, systems and 3) relationships with our key business partners. The project is divided into five phases: awareness, assessment, renovation, validation and implementation. We have completed the awareness and assessment phases for all three elements, and are currently at different points in the renovation, validation and implementation phases for each of the elements. We are using both internal and external resources to implement our plan.
For our IT systems, we have assessed both existing and newly implemented hardware and applications (software and operating systems), and have finalized the development of plans to address all assessed risks. Approximately 95 percent of our hardware is year 2000 compliant, and the remainder is currently in the renovation phase. Approximately 80 percent of our applications are compliant, with 20 percent in the renovation and validation phases. We anticipate completion of the validation, or testing, phase for our software and all key operating systems by mid 1999. Our year 2000 readiness in this area has been significantly enhanced by our recent, substantial common systems development initiatives through which we have invested heavily in IT over the past three years.
We began addressing non-IT systems, or embedded technology/infrastructure, risks at our stores, distribution centers and headquarters facilities early in our initiative. Approximately 85 percent of our non-IT systems are compliant and the remainder are currently in the renovation phase. Validation and implementation are approximately 80 percent complete and we anticipate finishing the balance by mid 1999.
We have identified our key business partners and have been working closely with them to assess their readiness and mitigate the risk to us if they are not prepared for the year 2000. We have installed the year 2000 compliant version of Electronic Data Interchange (EDI) software and expect to finalize testing of EDI and other electronic transmissions with key business partners by mid/late 1999.
In planning for the most reasonably likely worst case scenarios, we have addressed all three major elements in our project. We believe our IT systems will be ready for the year 2000, but we may experience isolated incidences of non-compliance. We plan to allocate internal resources and retain dedicated consultants and vendor representatives to be ready to take action if these events occur. Our contingency plans for non-IT systems are currently in process, and we are simultaneously putting the required resources in place to carry out those plans for key non-IT systems, such as those within our stores. We are contacting many critical business partners to assess their readiness and will finish developing appropriate contingency plans by mid 1999. Although we value our established relationships with key vendors, substitute products for most of the goods we sell in our stores may be obtained from other vendors. If certain vendors are unable to deliver product on a timely basis, due to their own year 2000 issues, we anticipate there will be others who will be able to deliver similar goods. However, the lead time involved in sourcing certain goods may result in temporary shortages of relatively few items. We also recognize the risks to us if other key suppliers in areas such as utilities, communications, transportation, banking and government are not ready for the year 2000, and are developing contingency plans to minimize the potential adverse impacts of these risks.
In 1998, we expensed $27 million related to year 2000 readiness. Prior to 1998, we expensed approximately $5 million. We estimate approximately another $20 million will be expensed as incurred to complete the year 2000 readiness program, with most of the spending occurring in the first half of 1999. In addition, this program has accelerated the timing of approximately $25 million of planned capital expenditures. All expenditures related to our year 2000 readiness initiative will be funded by cash flow from operations and will not materially impact our other operating or investment plans.
Information Systems
We have invested heavily in information services (IS) in the past three years. We consolidated our IS operations in 1996 and are developing and implementing common systems across all three divisions to better leverage our resources. As a result of our common systems initiatives, the growth in our IS expense substantially outpaced our revenue growth in recent years. Net IS expense growth in 1999 is expected to be similar to our revenue growth.
We adopted SOP 98-1, "Accounting for the Costs of Computer Software Developed or Obtained for Internal Use," in first quarter 1998. The adoption resulted in decreased expense, which increased pre-tax earnings by approximately $68 million, net of depreciation, for 1998 ($.09 per share), partially offsetting our other systems expenses. The annual impact of software capitalization will diminish significantly over the next few years.
Fourth Quarter Results
Due to the seasonal nature of the retail industry, fourth quarter operating results typically represent a substantially larger share of total year revenues and earnings due to the inclusion of the holiday shopping season.
Fourth quarter 1998 net earnings were $423 million, compared with $356 million in 1997. Earnings per share were $.90 for the quarter, compared with $.76 in 1997.
Target's pre-tax profit increased 26 percent to $646 million, reflecting a 13.9 percent total revenue increase, a modestly higher gross margin rate due to lower markdowns and an operating expense rate essentially even with last year. Continued growth in the profitability of guest credit also contributed to Target's fourth quarter profit improvement. Comparable-store sales increased 6.8 percent.
Mervyn's pre-tax profit was equal to a year ago at $104 million, reflecting a 3.4 percent total revenue increase, offset by a lower gross margin rate due to higher markdowns. The operating expense rate improved slightly primarily due to favorable sales leverage. Comparable-store sales increased 4.4 percent.
DSD's pre-tax profit increased 12 percent to $115 million, reflecting a 4.2 percent total revenue increase and a significantly higher gross margin rate due to favorable markdowns and markup. The operating expense rate increased slightly over 1997. Comparable-store sales increased 3.5 percent.