|
2010 Annual Letter From the Chairman and the Chief Executive Officer    1MB
In addition, you will find information about your company in the 2011 Proxy Statement and our quarterly letters to shareholders, as they become available. Together with the detailed analysis of the 2010 Annual Report on Form 10-K, these documents comprise a package of information similar to what appeared in our previous annual reports.
March 18, 2011
To Our Shareholders, Friends and Associates:
FINANCIAL HIGHLIGHTS
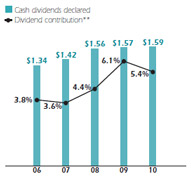
Your company's operating income* rose 27 percent in 2010, covering shareholder dividends that have increased each and every one of the past 50 years. Only 10 other publicly traded U.S. companies can claim this long record of cash dividend growth; its preservation reflects the board's recognition of our progress, its confidence in our plans and its vision of the opportunities before us.
With 50 consecutive years of dividend increases, Cincinnati Financial
Corporation again qualified as a 2010 S&P 500 Dividend Aristocrat and
a 2010 Mergent's Dividend Achiever.
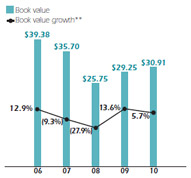
While 2010 pretax investment income rose 3 percent and underwriting results improved, the contribution to net income from net realized investment gains fell $114 million. This resulted in net income of $377 million, $55 million lower than the $432 million we earned in 2009. We chose to retain $755 million of pretax unrealized investment gains in our $3 billion equity portfolio at year-end. The equity portfolio accounted for just over a fourth of our year-end invested assets. While that level is roughly half of the pre-2008 level, it is higher than industry norms. Equity investing remains a key strategy for your company. Income from our dividend-paying stocks helps offset low bond yields. The long-term growth potential of stocks also serves as a hedge against rising interest rates and inflation. Appreciation of common stocks contributes to your shareholders' equity. Fair value of the equity portfolio rose 13 percent in 2010 on appreciation and higher invested assets. Book value per share rose 6 percent over 2009, an increase of $1.66 after dividends to shareholders of $1.59 per share.
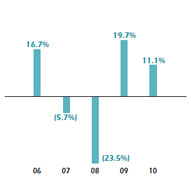
Our value creation ratio shows how we are doing for shareholders, summing the growth rate of book value per share and the ratio of dividends declared per share to beginning book value per share. Our long-term target is an annual average of 12 percent to 15 percent for the period 2010 through 2014, and our 11.1 percent ratio for 2010 came within a percentage point of that range. We expect several initiatives to further improve our insurance underwriting profitability and premium growth, creating stronger value. STEPPING UP TO THE STARTING LINE
Having reached major milestones for several initiatives over the past two years, we stand ready and eager to continue executing our plans. In January, we marked the 60th anniversary of the first policy issued by The Cincinnati Insurance Company, a residential fire policy with total premium of $17.50 for three years. From that beginning, four independent agents with a good idea and a lot of determination started a company that now writes almost $3 billion of annual premium and has more than $15 billion of consolidated assets. Page 1
FINANCIAL REVIEW
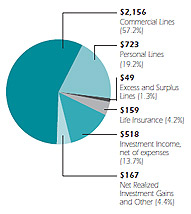
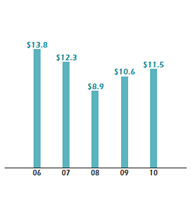
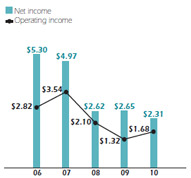
While commercial lines continues to be our largest operating segment based on revenues, each of our other insurance operating segments grew nicely in 2010, demonstrating the success of strategic initiatives for profitable growth. Invested assets continued a steady upward trend since the 2008 U.S. financial market decline, due to disciplined investing and a two-year rally in financial markets. Income contributed by our operations grew stronger in 2010, primarily from improved property casualty underwriting results, plus after-tax investment income growth of 2 percent despite declining investment yields.
Book value per share grew in 2010, reflecting better operating results in addition to higher valuation for our investment portfolio. We increased our shareholder dividend in 2010, marking the 50th consecutive year of increases. The value creation ratio, our primary long-term performance measure, averaged just over 15 percent for 2009 and 2010, in line with our target range of 12 percent to 15 percent on average annually for 2010 through 2014. To calculate the value creation ratio, we add the percentage of year-over-year growth in book value per share to the annual contribution of dividends (the percentage of declared dividends per share to beginning book value per share). Page 2
On January 25, 2011, the 60th anniversary of your company's first policy, we
announced an updated company logo to our associates and agents.
We will officially launch it at the Annual Meeting of Shareholders on
April 30, 2011.
Sixty years later, we are stepping up to be a stronger competitor than ever, just as determined as our founders to be the best insurance company serving independent agents in the United States. The business model and marketplace advantages they nurtured remain strong, and our efforts are adding new advantages as we take our position on the starting line ready to take that model into a new era. Our initiatives are already having an impact - regardless of economic uncertainty and the stubborn commercial insurance market - and any positive change in these respects would be wind at our backs. We see opportunity ahead. Over the past three years, we have taken decisive actions that stabilized our investment portfolio and our coastal catastrophe exposures; brought our technology systems up to date; improved our data management and embraced predictive modeling and analytics; developed robust enterprise risk management and business planning frameworks; expanded our operations and agency force; and invested in training and expertise of our associates. These ongoing efforts are making us nimble and fit to provide our agents with more ease and efficiency in doing business with us. That ease has historically risen from the availability of our field representatives in their offices and communities, our respect for local knowledge and efforts to push decision making to the local level, and our commitments to provide outstanding claims service and a stable market for their business while controlling expenses. We continue this agency-centered approach, bringing new tools, capabilities and services to bear as we seek profitable growth for our agencies and your company. Stepping Up
With policies backed by our financial strength, policyholders can safely rise above risk and forge ahead to meet their business and personal insurance goals, confident that Cincinnati Insurance is providing quality coverage and service. This is the right time to refresh our logo. Cincinnati is at a turning point, more focused and more ready than ever before to be a strong competitor. We are stepping up to help our agencies get the most benefit from our expanded operations, increased efficiencies, focused expertise and strong ethics and engagement. And we know they are ready to work together and seize the opportunities that an improving economy will bring. A simple, elegant logo helps prepare us for the higher consumer profile that is evolving as we increase our direct policyholder touches by providing more services that meet the high customer service standards of our agents. In line with the vision of our founders, the logo's symbolism reinforces the value of the independent agent and communicates the value and uniqueness of your company. Page 3
Stepping Up - Expertise
Cincinnati aims to be a market for approximately 75 percent of the typical insurable risks of our agencies' clients. While we are committed to this generalist approach, our agents are writing increasingly complex risks. In 2010, we added or shifted staff to provide higher levels of specialization and professional expertise:
FOCUS ON UNDERWRITING
Our 2 percent growth of written premiums in 2010 exceeded industry average growth estimated at 0.5 percent by A.M. Best, primarily due to our expansion activities. Our combined ratio improved almost 3 percentage points to 101.7 percent while the estimated industry average ratio deteriorated to 103.0 percent. We see limited prospects in the coming year for increased investment income; rather, we expect to achieve our performance objectives for earnings and book value growth primarily by continuing to execute on strategic initiatives to improve property casualty underwriting results. Each percentage point improvement on our overall property casualty combined ratio can add approximately $29 million to underwriting gains. This is where we will apply our main efforts to improve performance in 2011. In 2010, we maintained a healthy level of profitability in most lines of business. For all lines except workers' compensation, homeowners, and excess and surplus lines, the combined ratio averaged 95 percent. That profitable core of business represented almost 80 percent of our property casualty premium volume. We will keep those lines healthy by staying disciplined and avoiding underpriced business. Broader use of predictive analytics will help us price all risks with sufficient profit margin. Most importantly, we will continue supporting our strong agency relationships with knowledgeable, local field staff, profit sharing and superior claims service. For each of the three challenging lines, specific plans and initiatives already under way make us confident we can achieve profitability as those initiatives mature: Page 4
Workers' Compensation:
The 2010 loss and loss
expense ratio improved 29.6 percentage points,
reflecting favorable development this year after a
reserve charge for this line in 2009. We expect that
use of predictive modeling will be the primary
driver of further improvement, as analytics assist
our decisions both on individual risks and on the
overall book.
A multidisciplinary task force of claims, underwriting, loss control and sales associates has implemented additional initiatives such as our program to systematically act on policies with the highest loss ratios, increasing rates or nonrenewing this business as indicated by a detailed, case-by-case review. Use of a new supplemental application informs underwriters about aspects of the applicant's risk management including return-to-work programs, safety practices, pre-employment physicals and drug screenings. Claims initiatives involve medical repricing; increased use of workers' compensation claims specialists; and use of new claims kits to educate employers about safety, claims reporting and cost control. Our new workers' compensation claims reporting center, launched in January 2010, has significantly decreased the lag between an injury and its first report to us, leading to a faster response that benefits the employee, the employer and your company. We are expanding our loss control staff to allow for more onsite inspections, both to gather underwriting information and to assist employers with loss prevention. Our representatives now provide detailed quantitative and qualitative assessments of employers' workers' compensation practices to accounts with workers' compensation premiums over $50,000. Stepping up - Expansion
Your company continued in 2010 to invest in expansions of our operating territories, the agency force that markets our policies and our product lines. In the near term, these new sources of premium revenues allow us to maintain premium volume while walking away from underpriced business. Longer term, they present huge opportunities to diversify premium sources, improve our spread of catastrophe risk and grow profitably:
In 2011, we will expand personal lines marketing to a total of 32 states by adding agents and personal lines field representatives in New York, Connecticut and Oregon. Across the 39 states where we market commercial insurance, we are planning to appoint approximately 120 new agencies, taking care to respect franchise value within each territory for established agencies that are growing profitably. Page 5
Cincinnati earned the 2010 Vanguard in Insurance Best Practices Award
for technology innovation; qualified as an InformationWeek Top 500
innovative corporate user of information technology; and ranked among
the top eight companies for ease of doing business in an agent/broker
survey sponsored by ACORD User Groups.
Homeowners:
The 2010 homeowner loss and loss
expense ratio improved 18.8 percentage points,
benefiting from lower catastrophe losses and
improved pricing. We expect incremental
benefits from use of our tiered rating structure
and annual rate changes. Increases averaged
5 percent for policies renewing beginning
October 2009, with a slightly higher average
increase effective for renewals beginning in late
2010. These changes target rates more precisely to
correspond to the quality of each risk and improve
the quality of our homeowner book as confirmed
by insurance scores.
Catastrophe risk management actions also have improved our book. Over the past three years, we reduced our homeowner coastal exposures in Alabama, Florida, Georgia and North Carolina while introducing hurricane deductibles, tighter underwriting guidelines and rate increases. We targeted states with less volatility for personal lines growth in order to diversify our book. We made progress toward achieving scale, increasing personal lines new business 20 percent in 2010. Technology upgrades are now available in all 29 states where we market personal lines products, increasing our overall ease of doing business through improved workflows. These changes are a competitive advantage, fully supporting our desire to grow the business and improve profitability. Excess and Surplus Lines:
In its third year of operations, start-up expenses have leveled off. The
combined ratio improved nearly 40 percentage
points to 115.4 percent, meeting our expectations
for 2010. Our initiatives to move the ratio under
100 percent include claims reviews that add to our
ability to react quickly to adjust coverages in response to observed trends and to amend our
training, pricing or terms and conditions.
Stepping up - Efficiency
Technology advances brought new levels of efficiency to our agency customers and your company in 2010. We released a new version of our Diamond personal lines policy administration system, completed delivery of our new e-CLAS®CPP system for commercial package and auto policies to 30 states and deployed a new life insurance sales system. These major systems speed up service and processing time, promote paperless electronic communications and records and create staffing and cost efficiencies for agencies. Our systems continue to incorporate Real-Time technology that supports data sharing and prefilling of form fields, as well as fast personal lines quotes the agent can request without leaving the agency's management system or comparative rater. Predictive analytics tools are strategically important to your company. We used them in 2010 to model and manage our capital and enterprise risk, to increase pricing precision and to improve loss ratios in lines of business including workers' compensation, homeowners and personal auto. In 2011, we will integrate predictive tools for general liability and commercial property into our policy administration systems. With improved data capabilities, tools and performance metrics, we expect to produce plans that support state-, territory- and agency-level profitability and to streamline internal processes reducing the need for underwriter actions on selected policies. Page 6
Stepping Up - Ethics and Engagement
Your company actively promotes an ethical culture and the Golden Rule in all of our relationships and transactions. Our claims representatives have the most frequent opportunities to demonstrate this approach, and they do. Your company consistently receives high satisfaction rankings for fair claims service, as seen in an agent survey published by the Professional Insurance Agents Association of Ohio (November 2010) and in an Insurance Journal (October 5, 2010) article naming Cincinnati among the top performing homeowner insurance companies for consumer satisfaction. Because insurance is a financial promise, we take great care to achieve and accurately report on the financial strength that backs our policies. According to Audit Integrity on Forbes.com (November 8, 2010), your company is one of the Most Trustworthy Companies demonstrating conservative accounting practices, transparent reporting and sound governance practices over five years or more. Our associates engage in their communities as volunteers and leaders, bringing that same spirit to work where they collaborate to help others. We continue to have a vibrant school partnership program and high participation in blood drives, our community arts fund campaign and United Way campaign. In 2010, your company was named the Distinguished Organization for Art Education by the Southwest Ohio Art Education Association. In 2011, we plan to coordinate and support the activities of our many volunteers in a new volunteer council. Additionally, we conduct reinsurer reviews of this book, confirming that our underwriting appetite, risk profile and reserving are conservative, our use of deductibles is aggressive and our pricing is adequate. We are shortening our exposure on risks with traditionally long liability tails by actively managing prior acts coverage and retroactive dates on claims-made policies. And we are staffing to enhance new business as agents become more familiar with our new products and expansion of eligible classes. Excess and surplus lines contributed $49 million of our nearly $3 billion of property casualty premium revenues. Growth in 2011 will be disciplined, as pricing remains soft. Fully 30 percent of our staff now works in agency communities where they
provide the personal touch. We expanded our expertise and operating
territory while trimming overall staff to 4,060 at year-end 2010, down from
4,170 in 2009. Outstanding associate efforts and automation advances led
to economies at headquarters.
Maximizing Effectiveness
These challenging lines of business give us plenty of room to improve our results. As we aggressively pursue improvements, we will also work to amplify some proven advantages:
Page 7
Ward Group (July 13, 2010) named Cincinnati among only five companies
with a record of 20 consecutive years on the Ward's 50 list for balancing
strong policyholder safety and consistent shareholder rewards.
Getting the Basics Right
We pay close attention to insurance basics and work to get them right, year after year. Insurance Reserves:
Industry observers are voicing
concerns that carriers have cut corners by releasing
prior year reserves too soon, in effect subsidizing
current earnings with amounts that may be needed
to fund future liabilities. Our reserving philosophy
and practices remain unchanged. Our consistent
approach has resulted in 22 consecutive years of
favorable development on prior accident years'
reserves. We continue to target total reserves in the
upper half of the actuarial range, and we believe
our carried reserves are in the same solid position
at the end of 2010 as they were a year ago.
Investments:
Our practice is to cover insurance
reserve liabilities by investing in a diversified,
high-quality bond portfolio that far exceeds
those liabilities. These fixed income securities
assure our ability to fulfill our obligations to
policyholders, while we set the stage for long-term
growth by holding stocks that steadily increase
their dividends.
Reinsurance:
Catastrophe reinsurance is a
particularly important tool to control the
variability inherent in our business. After
reinsurance, our maximum exposure to a 2011
catastrophic event that caused $500 million in
covered losses would be $88 million. $500 million
is more than three times the amount of damage
caused to our policyholders by any single event in
our history. In negotiating agreements with our
highly rated reinsurers, we applied savings to the
catastrophe program, prudently reducing our
maximum retention.
These practices protect your company's high-quality balance sheet, positioning us with formidable financial strength. As 2010 came to a close in December, A.M. Best affirmed our ratings, including the A+ Superior awarded to our standard market property casualty companies. Over the past two years, we have stepped up our initiatives to build capital, improve profitability and drive premium growth. We believe these efforts position us to create long-term value for you, our shareholders, and for agents, policyholders and associates. Thank you for your support. Respectfully,
Page 8
Condensed Balance Sheets and Income Statements
Page 9
Six-Year Summary Financial Information
Page 10
This report contains forward-looking statements that involve potential risks and uncertainties. For factors that
could cause results to differ materially from those discussed, please see the most recent edition of our safe
harbor statement under the Private Securities Litigation Reform Act of 1995. To view or print the edition in
effect as of this report's initial publication date, please view this document as a printable PDF.
|
|||||||||||||||||||||||||||||||||||||||||||||||||||||||||||||||||||||||||||||||||||||||||||||||||||||||||||||||||||||||||||||||||||||||||||||||||||||||||||||||||||||||||||||||||||||||||||||||||||||||||||||||||||||||||||||||||||||||||||||||||||||||||||||||||||||||||||||||||||||||||||||||||||||||||||||||||||||||||||||||||||||||||||||||||||||||||||||||||||||||||||||||||||||||||||||||||||||||||||||||||||||||||||||||||||||||||||||||||||||||||||||||||||||||||||||||||||||||||||||||||||||||||||||||||||||||||||||||||||||||||||||||||||||||||||||||||||||||||||||||||||||||||||||||||||||||||||||||||||||||||||||||||||||||||||||||||||||||||||||||||||||||||||||||||||||||||||||||||||||||||||||||||||||||||||||||||||||||||||||||||||||||||||||||||||||||||||||||||||||||||||||||||||||||||||||||||||||||||||||||||||||||||||||||||||||||||||||||||||||||||||||||||||||||||||||||||||||||||||||||||||||||||||||||||||||||||||||||||||||||||||||||||||||||||||||||||||||||||||||||||||||||||||||||||||||||||||||||||||||||
|
Shareholder Information |
Financials & Analysis |
Business Information |
Ratings |
Electronic Delivery |
Investor Contacts |
Safe Harbor | Individuals & Families | Businesses & Organizations | Investors | Independent Agents | Career Seekers | Identity Protection, Phishing and Fraud Home Terms and Conditions Privacy Policies Copyright © 2011, Cincinnati Financial Corporation Investor Contacts |
|||||||||||||||||||||||||||||||||||||||||||||||||||||||||||||||||||||||||||||||||||||||||||||||||||||||||||||||||||||||||||||||||||||||||||||||||||||||||||||||||||||||||||||||||||||||||||||||||||||||||||||||||||||||||||||||||||||||||||||||||||||||||||||||||||||||||||||||||||||||||||||||||||||||||||||||||||||||||||||||||||||||||||||||||||||||||||||||||||||||||||||||||||||||||||||||||||||||||||||||||||||||||||||||||||||||||||||||||||||||||||||||||||||||||||||||||||||||||||||||||||||||||||||||||||||||||||||||||||||||||||||||||||||||||||||||||||||||||||||||||||||||||||||||||||||||||||||||||||||||||||||||||||||||||||||||||||||||||||||||||||||||||||||||||||||||||||||||||||||||||||||||||||||||||||||||||||||||||||||||||||||||||||||||||||||||||||||||||||||||||||||||||||||||||||||||||||||||||||||||||||||||||||||||||||||||||||||||||||||||||||||||||||||||||||||||||||||||||||||||||||||||||||||||||||||||||||||||||||||||||||||||||||||||||||||||||||||||||||||||||||||||||||||||||||||||||||||||||||||||

 The new logo icon acknowledges our heritage from our founding agents by incorporating the arch from the previous Cincinnati
skyline design. That arch represents the strength and stability we seek to bring to our independent agencies and their clients - and
to all of our relationships. Just as a bridge takes its purpose from connecting to the shore, we take our purpose from connecting to our agents and their local communities.
The new logo icon acknowledges our heritage from our founding agents by incorporating the arch from the previous Cincinnati
skyline design. That arch represents the strength and stability we seek to bring to our independent agencies and their clients - and
to all of our relationships. Just as a bridge takes its purpose from connecting to the shore, we take our purpose from connecting to our agents and their local communities.