 |
 |
 |
 |
 |
 |
 |
 |
 |
 |
 |
| |
|
|
|
2007 |
2006 |
2005 |
2004 |
2003 |
2002 |
2001 |
| Number of shares in issue (millions) * |
|
Number of authorised shares that are sold to and held by the shareholders of PPC Company Limited on the JSE Limited |
|
510 |
510 |
510 |
510 |
501 |
501 |
500 |
| Volume of shares traded (millions) * |
|
Number of shares transacted during the year |
|
302 |
127 |
147 |
133 |
75 |
59 |
72 |
| Market price (cents) * |
|
|
|
|
|
|
|
|
|
|
| – high |
|
Highest prevailing price at which share was sold |
|
5 300 |
4 498 |
2 943 |
1 830 |
1 220 |
820 |
720 |
| – low |
|
Lowest prevailing price at which share was sold |
|
3 360 |
2 770 |
1 716 |
1 100 |
770 |
587 |
480 |
| – at year-end |
|
Prevailing price at which share was sold on 30 September |
|
4 780 |
3 479 |
2 910 |
1 810 |
1 135 |
780 |
620 |
| Value of shares traded (Rm) |
|
Number of shares transacted during the year times prevailing price |
|
14 448 |
4 516 |
3 367 |
1 877 |
715 |
411 |
453 |
| Volume of shares traded as a percentage of total issued shares (%) |
|
Number of shares transacted during the year
Number of shares in issue |
|
59,2 |
24,9 |
28,8 |
26,1 |
15,0 |
11,8 |
14,4 |
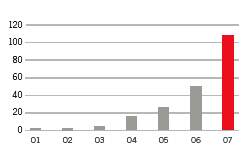
| Number of transactions |
|
Number of exchanges of PPC Company Limited shares between a buyer and a seller |
|
108 130 |
47 543 |
25 789 |
16 280 |
4 028 |
2 668 |
1 977 |
| Earnings yield (%) |
|
| Earnings per share excluding exceptional items for the most recent 12 months |
| Market price per share at year-end |
|
|
5,6 |
6,5 |
6,0 |
8,0 |
10,2 |
10,7 |
11,5 |
| Dividend yield (%) |
|
| Total dividends paid out of current year’s earnings |
| Market price per share at year-end |
|
|
5,6 |
6,3 |
6,5 |
12,8 |
12,1 |
14,6 |
15,5 |
| Price-earnings ratio |
|
| Market value per share at year-end |
| Earnings per share excluding exceptional items for the most recent 12 months |
|
|
18,0 |
15,4 |
16,9 |
12,4 |
9,8 |
9,4 |
8,7 |
| FTSE/JSE All Share Industrial index |
|
Average prices of a selected number of shares listed on the JSE Limited |
|
29 959 |
22 375 |
16 876 |
11 761 |
8 926 |
9 465 |
8 126 |
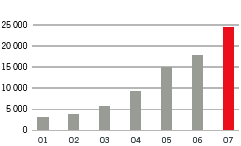
| Market capitalisation at 30 September (Rm) |
|
Number of shares in issue times market price per share at year-end |
|
24 392 |
17 756 |
14 853 |
9 246 |
5 684 |
3 906 |
3 101 |
|
| * Restated for effect of the 10:1 share subdivision |
| |
| Market capitalisation (Rm) |
|
|
| Number of shares transacted (thousands) |
|
 |
|
 |
|
|