| Financial Highlights (dollars are in thousands) |
2005(1) | 2006(2) | 2007(3) | 2008(4) | 2009(5) | ||||||||||
|---|---|---|---|---|---|---|---|---|---|---|---|---|---|---|---|
| Net product sales | $ | 133,696 | $ | 202,438 | $ | 278,226 | $ | 402,233 | $ | 449,072 | |||||
| Research collaboration revenue | — | — | $ | 5,957 | $ | 19,895 | — | ||||||||
| Net sales | $ | 133,696 | $ | 202,438 | $ | 284,183 | $ | 422,128 | $ | 449,072 | |||||
| Gross profit | $ | 78,602 | $ | 131,117 | $ | 183,239 | $ | 279,230 | $ | 328,459 | |||||
| Gross margin | 58.8 | % | 64.8 | % | 64.5 | % | 66.1 | % | 73.1 | % | |||||
| Net income (loss) | $ | (110,024 | ) | $ | (52,371 | ) | $ | (165,744 | ) | $ | (335,622 | ) | $ | 41,917 | |
| Accretion of preferred membership units to redemption value | $ | 12,061 | — | — | — | — | |||||||||
| Net income (loss) attributable to common share/unit holders | $ | (122,085 | ) | $ | (52,371 | ) | $ | (165,744 | ) | $ | (335,622 | ) | $ | 41,917 | |
| Non-GAAP adjusted net income (loss) attributable to common share/unit holders | $ | (106,539 | ) | $ | (27,995 | ) | $ | (63,611 | ) | $ | 9,872 | $ | 66,834 | ||
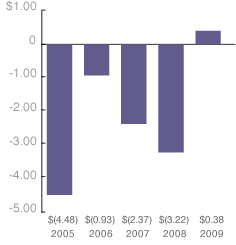
| GAAP earnings (loss) per diluted share/unit | $ | (4.48 | ) | $ | (0.93 | ) | $ | (2.37 | ) | $ | (3.22 | ) | $ | 0.38 | |
| Non-GAAP adjusted earnings (loss) per diluted share/unit | $ | (3.91 | ) | $ | (0.50 | ) | $ | (0.91 | ) | $ | 0.09 | $ | 0.61 | ||
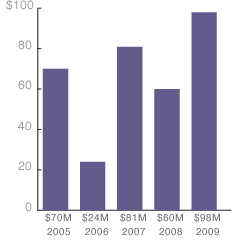
| Cash & cash equivalents | $ | 69,592 | $ | 24,053 | $ | 81,060 | $ | 59,652 | $ | 98,050 | |||||
| Total debt | — | $ | 7,500 | $ | 10,000 | $ | 8,958 | $ | 6,458 | ||||||
(in millions)
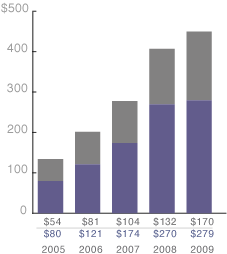
= Peripheral Vascular
= Neurovascular
per Diluted Share/Unit
(in millions)
(1) 2005 non-GAAP adjusted results presented above exclude $10.7 million of amortization expense ($0.39 per diluted share/unit) and $4.9 million of non-cash stock-based compensation expense ($0.18 per diluted share/unit). Net loss per common share/unit attributable to common holders reflect the June 21, 2005 1-for-6 reverse stock split.
(2) 2006 non-GAAP adjusted results presented above exclude $17.2 million of amortization expense ($0.30 per diluted share/unit) and $7.2 million of non-cash stock-based compensation expense ($0.13 per diluted share/unit).
(3) 2007 non-GAAP adjusted results presented above exclude $20.3 million of amortization expense ($0.29 per diluted share/unit), $11.1 million of non-cash stock-based compensation expense ($0.16 per diluted share/unit), and $70.7 million of acquired in-process research & development expense ($1.01 per diluted share/unit).
(4) 2008 non-GAAP adjusted results presented above exclude $31.1 million of amortization expense ($0.31 per diluted share/unit), $15.2 million of non-cash stock-based compensation expense ($0.14 per diluted share/unit), and $299.3 non-cash goodwill and other intangible asset impairment charges ($2.86 per diluted share/unit).
(5) 2009 non-GAAP adjusted results presented above exclude $25.1 million of amortization expense ($0.24 per diluted share/unit), $14.6 million of non-cash stock-based compensation expense ($0.13 per diluted share/unit), $4.9 million of contingent consideration ($0.04 per diluted share/unit), $3.4 million of FoxHollow lease reserve adjustment ($0.03 per diluted share/unit), $(4.1) million of realized gain on investment ($(0.04) per diluted share/unit), and $(19.0) of non-cash tax benefit from acquisitions ($(0.17) per diluted share/unit).
Non-GAAP Financial Measures
To supplement our consolidated financial statements prepared in accordance with U.S. generally accepted accounting principles (GAAP), we use certain non-GAAP financial measures, such as adjusted net income (loss) and adjusted net earnings (loss) per share, in this report. Our management believes that the presentation of these measures provides useful information to investors. These measures may facilitate operating performance comparisons from period to period and company to company by excluding such items as amortization, stock-based compensation and other non-cash charges and unusual or infrequent charges not related to our regular, ongoing business, all of which may be highly variable, difficult to predict and of a size that could have substantial impact on our reported results of operations for a period. Our management uses these measures internally to analyze the underlying trends in our business, assess the performance of our core operations, establish operational goals and forecasts that are used in allocating resources and evaluate our performance period over period and in relation to our competitors. Non-GAAP financial measures have limitations as analytical tools and should not be considered in isolation or as a substitute for our financial results prepared in accordance with GAAP. Reconciliations of the non-GAAP financial measures used in this report to the most comparable U.S. GAAP measures for the respective periods can be found in the notes to the financial table above and are otherwise available in the “Investor Relations—Non-GAAP Measures” section of our website located at www.ev3.net.