Financials
| Year ended December 31 | 2,009 | 2,008 | 2,007 |
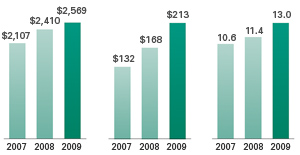
| Net revenue | $ 2,569,685 | $ 2,409,864 | $ 2,106,993 |
| Compensation and benefits | 1,796,779 | 1,637,425 | 1,455,970 |
| Operating expenses | 334,328 | 383,359 | 317,518 |
| Insurance expense | 97,610 | 82,221 | 66,308 |
| Selling, general and administrative expenses | 63,481 | 69,658 | 61,893 |
| Depreciation and amortization expense | 64,351 | 68,980 | 70,483 |
| Restructuring charges | — | — | 2,242 |
| Income from operations | 213,136 | 168,221 | 132,579 |
| Interest income from restricted assets | 4,516 | 6,407 | 7,143 |
| Interest expense | (40,996) | (42,087) | (46,948) |
| Realized gain (loss) on investments | 2,105 | 2,722 | 245 |
| Interest and other income | 1,816 | 2,055 | 2,055 |
| Loss on early debt extinguishment | — | (241) | — |
| Income before income taxes and equity in earnings of unconsolidated subsidiary | 180,577 | 137,077 | 95,074 |
| Income tax expense | (65,685) | (52,530) | (36,104) |
| Equity in earnings of unconsolidated subsidiary | 347 | 300 | 848 |
| Net income | $ 115,239 | $ 84,847 | $ 59,818 |
| Basic earnings per common share | $ 2.71 | $ 2.04 | $ 1.44 |
| Diluted earnings per common share | $ 2.64 | $ 1.97 | $ 1.39 |
| Weighted average common shares outstanding, basic | 42,552,716 | 41,652,783 | 41,551,207 |
| Weighted average common shares outstanding, diluted | 43,623,800 | 43,130,782 | 43,146,881 |
Reconciliation of Income from Operations to Adjusted EBITDA |
|||
| Income from operations | $ 213,136 | $ 168,221 | $ 132,579 |
| Depreciation and amortization expense | 64,351 | 68,980 | 70,483 |
| Interest income from restricted assets | 4,516 | 6,407 | 7,143 |
| Adjusted EBITDA | $ 282,003 | $ 243,608 | $ 210,205 |
Form 10-K
View Form 10-K (PDF)(in thousands) Income From Operations
(in thousands) Total Patient Encounters
(in millions)
Comparison of Cumulative Total Return Among Emergency Medical Services Corp., Russell 2000 Index and DJ U.S. Healthcare Providers
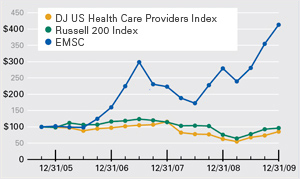
Assumes $100 invested on Dec. 16, 2005
Assumes dividend reinvested
Fiscal year ended Dec. 31, 2009
The preceding line graph compares the percentage change in the cumulative total stockholder return on EMSC’s class A common stock with the cumulative total return on (i) the Dow Jones U.S. Healthcare Providers Index and (ii) the Russell 2000 Index, for the period commencing December 16, 2005 (the date upon which EMSC’s shares of class A common stock began trading on the New York Stock Exchange) and ending December 31, 2009 (the last day of EMSC’s most recently completed fiscal year). The comparison assumes $100 was invested on December 16, 2005 in EMSC’s class A common stock and in the foregoing indexes, and further assumes the reinvestment of dividends.