(216kb)

Financial
Highlights
|
in thousands, except share and per share data |
2011 |
2010 |
2009 |
|
Revenue |
$134,000 |
$77,362 |
$19,808 |
|
Gross profit (loss) |
69,635 |
41,157 |
(3,619) |
|
Total operating expenses |
14,884 |
12,463 |
6,749 |
|
income (loss) from operations |
54,751 |
28,694 |
(10,368) |
|
Net income (loss) |
38,059 |
29,111 |
(9,630) |
|
Net income (loss) per common share |
|
||
|
Basic |
$1.67 |
$1.34 |
$(0.48) |
|
Diluted |
$1.61 |
$1.28 |
$(0.48) |
|
Shares used in computing net income (loss) per common share |
|||
|
Basic |
22,852,205 |
21,726,090 |
20,117,543 |
|
Diluted |
23,596,162 |
22,790,896 |
20,117,543 |
|
Cash and cash equivalents and short term investments |
54,818 |
82,204 |
44,576 |
|
Working capital |
119,056 |
106,524 |
55,121 |
|
Long-term investments |
2.000 |
2.000 |
2,000 |
|
Stockholders' equity |
228,231 |
192,094 |
97,440 |
|
Net cash from (used in) operations |
24,612 |
24,059 |
(3,292) |
|
Capital expenditures |
48,228 |
49,429 |
5,530 |
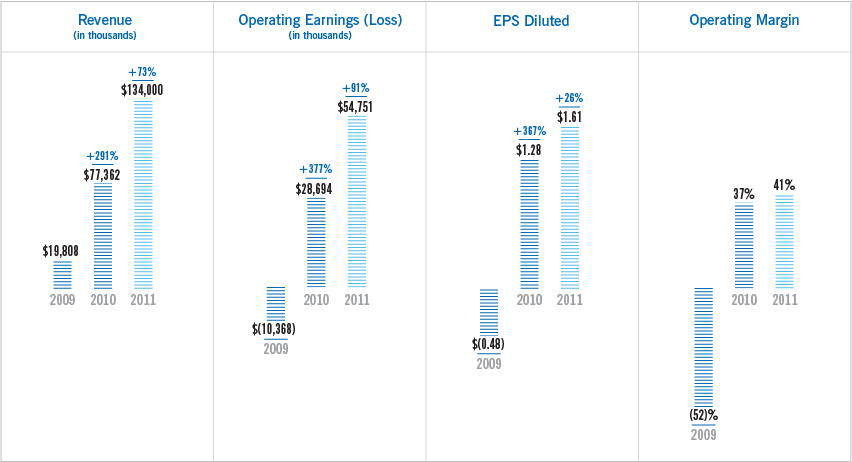
>Revenue grew to $134 million, a 73% increase compared with 2010.
>Pretax income nearly doubled, growing from $29.0 million in 2010 to $54.6 million in 2011.
>Diluted earnings per share increased from $1.28 to $1.61.