Shareowner Return Performance Graph
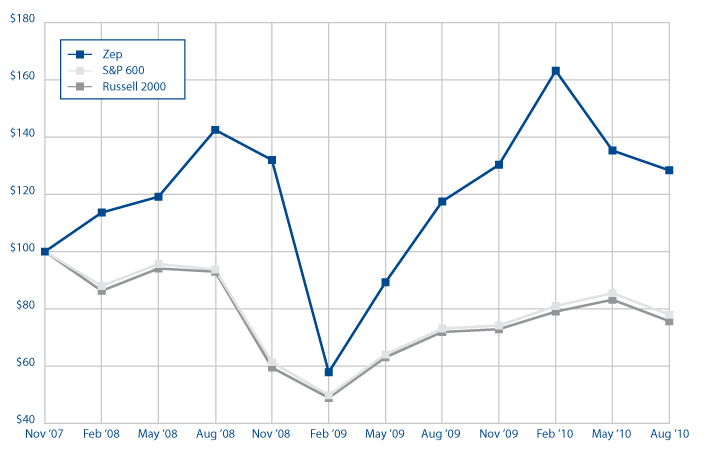
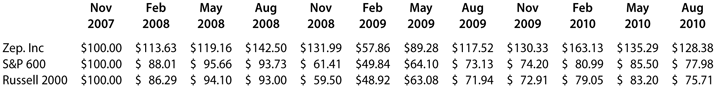
The graph compares the change in cumulative total stockholders’ return on our common stock with (a) the S&P Smallcap 600 Index and (b) the Russell 2000 Index, each for the period from November 1, 2007 (the date our stock first traded other than on a when-issued basis) through August 31, 2010. The graph assumes an initial investment of $100 at the closing price on November 1, 2007 and assumes all dividends were reinvested. We have presented the Russell 2000 Index, in lieu of an industry index or peer group, because we believe there is no published index or peer group that adequately compares to our business. Except for the initial measurement date (November 1, 2007), the figures for the chart and graph set forth above have been calculated based on the closing prices on the last trading day on the New York Stock Exchange for each period indicated.