Industry review
Coal is vital for today’s global energy requirements. The World Coal Institute calculates that coal currently provides 26 per cent of the world’s primary energy needs.
Reserves are available in almost every country worldwide, with recoverable reserves in around 70 countries. At current production levels* proven coal reserves are estimated to last 133 years. By contrast, proven oil and gas reserves are equivalent to around 42 and 60 years respectively at current production levels.
Many countries rely heavily on coal for their electricity generation. For example, the U.S. produces 50 per cent of its electricity from this fuel source, while in both Poland and South Africa the figure exceeds 90 per cent.
According to the BP Statistical Review of World Energy 2008, world coal consumption in 2007 increased by 4.5 per cent, well above the ten-year average; and it was the world’s fastest growing fuel in terms of usage for the fifth consecutive year. Growth in China’s consumption accounted for more than two-thirds of global growth. Other rapidly industrialising countries including India and Brazil further added to this increasing demand.
Towards the end of 2008, according to the review, the weakening world economy interrupted this trend. Chinese GDP growth slowed in the third quarter to around 9.5 per cent year-on-year, the slowest since 2004, down from 10.1 per cent in the second quarter. The International Monetary Fund’s forecast, published in February 2009, is for Chinese GDP growth to be 6.7 per cent in 2009. In November 2008, Chinese industrial output slowed to 5.4 per cent, a fall of 11.9 per cent over the year. In the same month, China’s coal imports declined to a near three-year low as demand from its domestic power plants weakened.
However, there remains an optimistic, positive sentiment for the long-term global prospects of the coal industry.
The Central European market
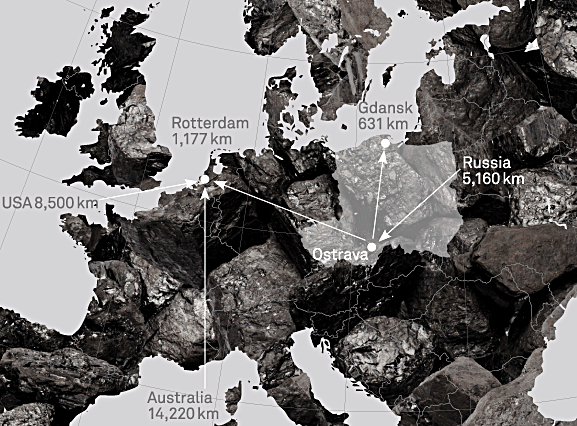
The market for coal in Central Europe is isolated to some extent from the global coal market due to its landlocked nature. The region also constitutes a largely localised commercial zone. For instance, even though seaborne coal might be mined at lower production cost, the cost of transporting this coal into the region makes it less competitive.
In the third quarter of 2008, Czech GDP growth was down to 3.8 per cent year-on-year from 6.6 per cent in 2007 while Polish GDP was 4.8 per cent year on year, down from 5.8 per cent in the previous quarter. In line with slower GDP growth, the region has also seen lower demand for cars and white goods which has subsequently reduced demand for steel and the need for coking coal.
Regional demand is also underpinned by the use of thermal coal needed to produce electricity and heat generation. For example, coal powers 66 per cent of electricity generation in the Czech Republic.
While the global and Central European downturn will undoubtedly make things more challenging, we have confidence in the resilience of our business. Tight operational focus, strong leadership, modern investment programmes, large reserve bases and our strong regional market position all serve to ensure that NWR is well positioned to weather the current environment and take full advantage of future opportunities.
* In 2008 the total global hard coal production was over 5.5 billion tonnes.

Landlocked position of customersand close proximity of mines to customers and transportation
NWR benefits significantly from the landlocked location of the production facilities of its customers in the Czech Republic and Central Europe and the proximity of its reserves and its facilities to its customers.
The limited reach of navigable waterways near many industrialised areas of Central Europe provides a competitive cost advantage to coal producers, such as NWR, with its coal mines being located near the sites of steel mills and electricity generating facilities in the region.
The landlocked location of customers in Central Europe makes importing coal from outside the region generally more expensive than using locally sourced coal. Higher transportation costs associated with such overseas coal provides NWR with a competitive cost advantage in servicing its customers’ needs.
Industrial growth data by region in per cent
| 2005 | 2006 | 2007 | 2008 Est |
2009 Forecast |
2010 Forecast |
2005 – 2010 Av Growth |
|
|---|---|---|---|---|---|---|---|
| EU | 0.4 | 1.6 | 1.9 | (0.5) | (4.5) | 2.5 | 0.5 |
| Other Europe | 3.9 | 4.0 | 6.0 | 3.2 | (3.8) | 2.5 | 4.0 |
| C.I.S. | 4.7 | 5.6 | 7.2 | 2.9 | (4.0) | 3.0 | 4.4 |
| North America | 3.4 | 2.1 | (1.4) | (0.4) | (4.7) | 1.9 | 0.8 |
| South America | 4.2 | 3.6 | 6.3 | 2.5 | 1.8 | 4.5 | 5.3 |
| Africa | 3.1 | 4.5 | 4.4 | (1.6) | (1.6) | 3.0 | 2.6 |
| Middle East | 4.0 | 4.0 | 4.8 | 2.0 | 1.0 | 3.0 | 3.8 |
| Asia | 6.0 | 7.1 | 5.8 | 3.5 | (0.6) | 4.8 | 5.9 |
| Oceania | 2.5 | 0.6 | 3.8 | (0.1) | 1.0 | 1.4 | 1.6 |
| Weighted average | 3.2 | 3.3 | 2.2 | 0.9 | (3.0) | 3.0 | 1.6 |
| The above constitutes 42 countries which account for about 99 per cent of world blast-furnace pig iron production. Source: McCloskey Report February 2009, The Economist, U.S. Department of Energy, Organisation for Economic Cooperation and Development. |
|||||||

