Flavored for Global Growth

2012 Annual Report

We are committed to making food taste great. Around the globe, home cooks and professional chefs alike turn to McCormick for flavor and culinary inspiration. We have substantial and sustained investment in the science and art of flavor.

We are committed to making food taste great. Around the globe, home cooks and professional chefs alike turn to McCormick for flavor and culinary inspiration. We have substantial and sustained investment in the science and art of flavor.
There is something inspiring about working at McCormick. Employee engagement and a high performance culture are rooted in an environment of respect, recognition, inclusion and collaboration. In addition, since the founding of the company, we have had a commitment to give back to the communities in which we operate.
Our unrivaled focus on quality sets us apart. We are leaders in global sourcing and have years of experience impacting local growing practices to ensure the high quality of spices, herbs and other crops. These world-class standards extend throughout our global supply chain and across all of our internal processes.
Our high quality products not only make food taste better, they often make food better for you. Whether funding research on the potential health benefits of herbs and spices or developing reduced-sodium and gluten-free products, we continue to explore new ways to provide healthy eating choices.
We are committed to achieving a superior level of performance in everything we do. This is especially true in the financial realm where we have achieved compound annual growth rates of 9% for earnings per share and 10% for cash flow from operations during the past decade.

Financial Highlights

Dividends Paid Per Share

1986–2012

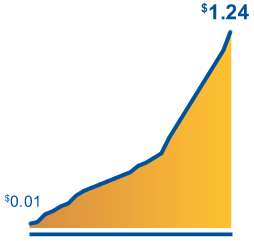
We have increased the dividend
annually since 1986,
reaching $1.24 per share
in 2012.

Sales

(dollars in billions)

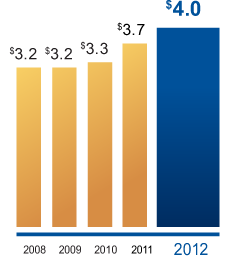
We have grown sales at
a 6% compound annual
growth rate during the past
five years and in 2012,
reached $4 billion in sales.
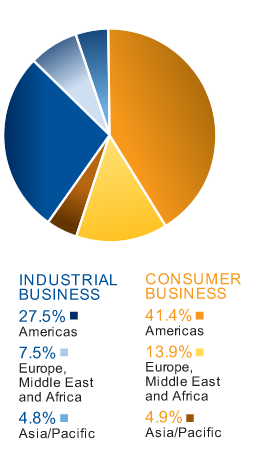
2012 Net Sales
by Segment and Region

For the year ended November 30 (millions except per share data)

2012

2011

% Change

Net sales

$4,014.2

$3,697.8

8.6%

Gross profit

1,617.8

1,522.5

6.3%

Gross profit margin

40.3%

41.2%


Operating income

578.3

540.3

7.0%

Operating income margin

14.4%

14.6%


Net income

407.8

374.2

9.0%

Earnings per share—diluted

3.04

2.79

9.0%

Dividends paid

164.7

148.5

10.9%

Dividends paid per share

1.24

1.12

10.7%

BACK TO TOP >>

Facebook