 |
The value of convenience.
A store location near you.
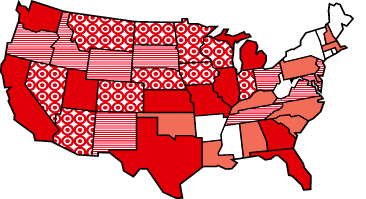
Click on a state to see its group density.
We continue to open Target stores across the country, adding net square footage
at an average annual growth rate of 8-10%, steadily increasing market penetration. Since 1997, total store density has increased over 50%. Even in our most densely populated states, our market presence has expanded nearly 40%, indicating ample opportunity for profitable growth well into the future.
Year-end Store Count and Square Footage by State
|
|
2002 |
1997 |
|
|
|
 |
|
|
Density
Group |
|
Sq. Ft. per
Thousand Population |
Number of Stores |
Retail
Sq. Ft. (in thousands) |
Sq. Ft. per
Thousand Population |
Retail
Sq. Ft.(in thousands) |
|
 |
Minnesota |
1,594 |
62 |
7,973 |
1,131 |
5,372 |
| |
Iowa |
853 |
19 |
2,497 |
614 |
1,769 |
| |
Colorado |
802 |
28 |
3,595 |
592 |
2,352 |
| |
North Dakota |
793 |
4 |
505 |
682 |
437 |
| |
Arizona |
748 |
35 |
4,050 |
528 |
2,451 |
| |
Nebraska |
735 |
10 |
1,265 |
642 |
1,072 |
| |
Nevada |
730 |
13 |
1,584 |
490 |
841 |
| |
Montana |
704 |
6 |
639 |
344 |
299 |
| |
Indiana |
647 |
34 |
3,969 |
482 |
2,853 |
| |
Wisconsin |
619 |
29 |
3,358 |
447 |
2,334 |
 |
Group 1 Total |
845 |
240 |
29,435 |
613 |
19,780 |
|
 |
California |
606 |
175 |
21,133 |
469 |
15,291 |
| |
Michigan |
576 |
52 |
5,765 |
492 |
4,796 |
| |
Illinois |
574 |
59 |
7,188 |
451 |
5,466 |
| |
Texas |
568 |
98 |
12,273 |
452 |
8,854 |
| |
Utah |
567 |
8 |
1,303 |
511 |
1,055 |
| |
Georgia |
555 |
37 |
4,714 |
366 |
2,795 |
| |
Washington |
545 |
29 |
3,293 |
431 |
2,401 |
| |
Missouri |
535 |
24 |
3,021 |
252 |
1,374 |
| |
Kansas |
531 |
11 |
1,435 |
423 |
1,109 |
| |
Florida |
530 |
73 |
8,823 |
456 |
6,846 |
|
Group 2 Total |
571 |
566 |
68,948 |
445 |
49,987 |
|
 |
Maryland |
524 |
23 |
2,843 |
294 |
1,509 |
| |
South Dakota |
520 |
4 |
394 |
531 |
391 |
| |
Oregon |
504 |
15 |
1,766 |
363 |
1,174 |
| |
Virginia |
496 |
29 |
3,597 |
317 |
2,153 |
| |
New Mexico |
473 |
8 |
872 |
424 |
730 |
| |
Ohio |
426 |
41 |
4,842 |
233 |
2,609 |
| |
Idaho |
401 |
5 |
536 |
338 |
406 |
| |
Tennessee |
392 |
20 |
2,266 |
358 |
1,945 |
| |
New Jersey |
384 |
26 |
3,276 |
62 |
509 |
| |
Wyoming |
377 |
2 |
187 |
378 |
182 |
|
Group 3 Total |
445 |
173 |
20,579 |
263 |
11,608 |
|
 |
South Carolina |
354 |
12 |
1,450 |
102 |
393 |
| |
Oklahoma |
334 |
9 |
1,160 |
235 |
790 |
| |
Delaware |
334 |
2 |
268 |
- |
0 |
| |
North Carolina |
326 |
24 |
2,694 |
285 |
2,161 |
| |
Kentucky |
323 |
12 |
1,316 |
287 |
1,129 |
| |
Alabama |
317 |
9 |
1,417 |
27 |
117 |
| |
New Hampshire |
312 |
3 |
397 |
- |
0 |
| |
Massachusetts |
299 |
15 |
1,914 |
- |
0 |
| |
Louisiana |
291 |
9 |
1,303 |
46 |
203 |
| |
Pennsylvania |
268 |
26 |
3,289 |
- |
0 |
|
Group 4 Total |
307 |
121 |
15,208 |
100 |
4,793 |
|
 |
Rhode Island |
238 |
2 |
254 |
- |
0 |
| |
New York |
222 |
32 |
4,214 |
38 |
717 |
| |
Connecticut |
189 |
5 |
649 |
- |
0 |
| |
West Virginia |
139 |
2 |
250 |
- |
0 |
| |
Arkansas |
131 |
3 |
354 |
72 |
186 |
| |
Maine |
97 |
1 |
125 |
- |
0 |
| |
Mississippi |
83 |
2 |
239 |
42 |
116 |
| |
Vermont |
- |
0 |
0 |
- |
0 |
|
Group 5 Total |
189 |
47 |
6,085 |
32 |
1,019 |
|
| |
Total |
494 |
1,147 |
140,255 |
325 |
87,187 |
|