Financial Report
Exhibit 13
- Management's Discussion and Analysis of Financial Condition and Results of Operations
- Overview
- Results of Operations—Consolidated
- Results of Operations—Wireless
- Results of Operations—Wireline
- Inflation
- Recent Accounting Pronouncements
- Financial Resources
- Liquidity and Capital Resources
- Application of Critical Accounting Policies and Estimates
- Certain Relationships and Related Transactions
- Private Securities Litigation Reform Act of 1995 Safe Harbor Cautionary Statement
- Market Risk
- Consolidated Statement of Operations
- Consolidated Statement of Cash Flows
- Consolidated Balance Sheet—Assets
- Consolidated Balance Sheet—Liabilities and Equity
- Consolidated Statement of Changes in Equity
- Consolidated Statement of Comprehensive Income
- Notes to Consolidated Financial Statements
- Reports of Management
- Report of Independent Registered Public Accounting Firm
- Selected Consolidated Financial Data
- Five-Year Statistical Summary
- Consolidated Quarterly Information (Unaudited)
- Shareholder Information
Telephone and Data Systems, Inc. ("TDS") is a diversified telecommunications company providing high-quality telecommunications services in 36 states to approximately 6.1 million wireless customers and 1.1 million wireline equivalent access lines at December 31, 2009. TDS conducts substantially all of its wireless operations through its 82%-owned subsidiary, United States Cellular Corporation ("U.S. Cellular"), and provides wireline services through its incumbent local exchange carrier ("ILEC") and competitive local exchange carrier ("CLEC") operations under its wholly owned subsidiary, TDS Telecommunications Corporation ("TDS Telecom"). TDS conducts printing and distribution services through its 80%-owned subsidiary, Suttle-Straus, Inc. ("Suttle-Straus") which represents a very small portion of TDS' operations.
The following discussion and analysis should be read in conjunction with TDS' audited consolidated financial statements and the description of TDS' business included in Item 1 of the TDS Annual Report on Form 10-K ("Form 10-K") for the year ended December 31, 2009.
The following is a summary of certain selected information contained in the comprehensive Management's Discussion and Analysis of Financial Condition and Results of Operations that follows. The summary does not contain all of the information that may be important. You should carefully read the entire Management's Discussion and Analysis of Financial Condition and Results of Operations and not rely solely on the overview.
U.S. Cellular
U.S. Cellular provides wireless telecommunications services to more than 6.1 million customers in five geographic market areas in 26 states. As of December 31, 2009, U.S. Cellular's average penetration rate in its consolidated operating markets, calculated by dividing U.S. Cellular's total customers by the total population of 46.3 million in such markets, was 13.3%. U.S. Cellular operates on a customer satisfaction strategy, meeting customer needs by providing a comprehensive range of wireless products and services, excellent customer support, and a high-quality network. U.S. Cellular's business development strategy is to operate controlling interests in wireless licenses in areas adjacent to or in proximity to its other wireless licenses, thereby building contiguous operating market areas. U.S. Cellular believes that operating in contiguous market areas will continue to provide it with certain economies in its capital and operating costs.
Financial and operating highlights in 2009 included the following:
- Total customers were 6,141,000 at December 31, 2009, including 5,744,000 retail customers.
- Retail customer net additions were 37,000 in 2009 compared to 149,000 in 2008. The decrease year-over-year reflected higher churn rates, due to the weak economy and very competitive industry conditions which included the initiation of service by unlimited prepay service providers in certain of U.S. Cellular's markets.
- Postpay customers comprised approximately 95% of U.S. Cellular's retail customer base as of December 31, 2009. Postpay net additions were 62,000 in 2009 compared to 158,000 in 2008. The postpay churn rate was 1.6% in 2009 compared to 1.5% in 2008.
- Service revenues of $3,927.9 million decreased $12.5 million year-over-year, due primarily to a decrease of $76.4 million (23%) in inbound roaming revenues. Retail service revenue grew by $33.2 million (1%) due primarily to an increase in the average monthly retail service revenue per customer, driven by higher data usage. Data revenues grew 33% year-over-year to $683.0 million.
- On June 30, 2009, U.S. Cellular entered into a new $300 million revolving credit agreement with certain lenders and other parties. As a result, U.S. Cellular's $700 million revolving credit agreement, which was due to expire in December 2009, was terminated on June 30, 2009 as a condition of entering into the new agreement. The new revolving credit agreement provides U.S. Cellular with a $300 million senior revolving credit facility for working capital, acquisitions and other corporate purposes and to refinance any existing debt of U.S. Cellular.
- On December 24, 2009, U.S. Cellular redeemed all of its outstanding 8.75% Senior Notes due November 1, 2032. The $130.0 million aggregate principal amount of the outstanding notes was redeemed at a redemption price equal to 100% of the principal amount plus accrued and unpaid interest, which resulted in a total redemption payment of $131.7 million.
- Additions to property, plant and equipment totaled $546.8 million, including expenditures to construct cell sites, increase capacity in existing cell sites and switches, expand mobile broadband services based on third generation Evolution-Data Optimized technology ("3G") to additional markets, outfit new and remodel existing retail stores and continue the development and enhancement of U.S. Cellular's office systems. Total cell sites in service increased 6% year-over-year to 7,279.
- As part of its customer satisfaction strategy and Believe in Something Better® brand message, U.S. Cellular launched its Battery Swap program in May 2009. Under this new program, a customer can exchange a battery that is dead or dying for one that is fully charged, at no cost to the customer. U.S. Cellular was the first wireless company to offer this service in the United States, and completed over one million battery swaps in 2009.
- In November 2009, U.S. Cellular launched Overage Protection, a customer satisfaction strategy that allows customers to opt into receiving alerts when they come close to reaching their allowable plan minutes or text messages for the month in order to avoid overage charges. Approximately 600,000 of U.S. Cellular's customers signed up for this service in 2009.
- U.S. Cellular began efforts on a number of multi-year initiatives including the development of: a Billing and Operational Support System ("BSS/OSS") including a new point-of-sale system to consolidate billing on one platform; an Electronic Data Warehouse/Customer Relationship Management System to collect and analyze information more efficiently to build and improve customer relationships; and a new Internet/Web platform to enable customers to complete a wide range of transactions and, eventually, to manage their accounts online.
- U.S. Cellular recognized a loss on impairment of licenses of $14.0 million in 2009. In 2008, a loss on impairment of $386.7 million was recognized. See "Results of Operations—Consolidated" and "Results of Operations—Wireless" for a further discussion of losses on impairment. U.S. Cellular anticipates that future growth in its operating income will be affected by the following factors:
- Overall demand for U.S. Cellular's products and services, including potential growth in revenues from data products and services;
- Increasing penetration in the wireless industry;
- Increased competition in the wireless industry, including potential reductions in pricing for products and services overall and impacts associated with the expanding presence of carriers offering low-priced, unlimited prepay service;
- Uncertainty related to current economic conditions and their impact on customer purchasing and payment behaviors;
- Costs of customer acquisition and retention, such as equipment subsidies and advertising;
- Industry consolidation and the resultant effects on roaming revenues, service and equipment pricing and other effects of competition;
- Providing service in recently launched areas or potential new market areas;
- Potential increases or decreases in prepay and reseller customers as a percentage of U.S. Cellular's customer base;
- Costs of developing and introducing new products and services;
- Costs of developing and enhancing office and customer support systems, including costs and risks associated with the completion of important multi-year initiatives such as those described above;
- Continued enhancements to its wireless networks, including expansion of 3G services and potential deployments of new technology;
- Increasing costs of regulatory compliance; and
- Uncertainty in future eligible telecommunication carrier ("ETC") funding.
See "Results of Operations—Wireless."
2010 Wireless Estimates
U.S. Cellular expects the factors described above to impact revenues and operating income for the next several quarters. Any changes in the above factors, as well as the effects of other drivers of U.S. Cellular's operating results, may cause revenues and operating income to fluctuate over the next several quarters.
U.S. Cellular's estimates of full-year 2010 results are shown below. Such estimates represent U.S. Cellular's views as of the date of filing of U.S. Cellular's Form 10-K for the year ended December 31, 2009. Such forward-looking statements should not be assumed to be accurate as of any future date. U.S. Cellular undertakes no duty to update such information whether as a result of new information, future events or otherwise. There can be no assurance that final results will not differ materially from such estimated results.
| |
2010 Estimated Results |
2009 Actual Results |
||
|---|---|---|---|---|
Service revenues |
$3,975 - $4,075 million | $3,927.9 million | ||
Operating income |
$250 - $350 million | $326.4 million | ||
Depreciation, amortization and accretion expenses, and losses on disposals and impairment of assets(1) |
Approx. $600 million | $599.8 million | ||
Capital expenditures |
Approx. $600 million | $546.8 million |
| (1) | 2009 Actual Results include losses on asset disposals of $15.2 million and impairments of assets of $14.0 million. The 2010 Estimated Results include only the estimate for Depreciation, amortization and accretion expenses and losses on disposals of assets, and do not include any estimate for losses on impairment of assets (since these can not be predicted). |
U.S. Cellular management believes that the foregoing estimates represent a reasonable view of what is achievable considering current economic and competitive conditions as well as actions that U.S. Cellular has taken and will be taking. U.S. Cellular expects to continue its focus on customer satisfaction by delivering a high quality network, attractively priced service plans, a broad line of handsets and other products, and outstanding customer service in its company-owned and agent retail stores and customer care centers. U.S. Cellular believes that future growth in its revenues will result primarily from selling additional products and services to its existing customers, increasing the number of multi-device users among its existing customers, and attracting wireless users switching from other wireless carriers, rather than by adding users that are new to wireless service. U.S. Cellular is focusing on opportunities to increase revenues, pursuing cost reduction initiatives in various areas and implementing a number of initiatives to enable future growth. The initiatives are intended, among other things, to allow U.S. Cellular to accelerate its introduction of new products and services, better segment its customers for new services and retention, sell additional services such as data, expand its Internet sales and customer service capabilities, and improve its prepay products and services.
TDS Telecom
TDS Telecom provides high-quality telecommunication services, including full-service local exchange service, long-distance telephone service and broadband access, to rural and suburban area communities. TDS Telecom's business plan is designed for a full-service telecommunications company, including both ILEC and CLEC operations. TDS Telecom's strategy is to be the preferred provider of telecommunications services—including voice, broadband and video services—in its chosen markets. This strategy encompasses many components, including:
- Developing services and products;
- Formulating market and customer strategies;
- Investing in networks and deploying advanced technologies;
- Monitoring the competitive environment;
- Advocating with respect to state and federal regulations for positions that support its ability to provide advanced telecommunications services to its customers; and
- Exploring transactions to acquire or divest properties that would result in strengthening its operations.
Both ILECs and CLECs are faced with significant challenges, including the industry-wide decline in use of second lines by customers, growing competition from wireless and other wireline providers (other CLECs and cable providers), changes in regulation, technologies such as Voice over Internet Protocol ("VoIP"), and the uncertainty in the economy. These challenges could have a material adverse effect on the financial condition, results of operations and cash flows of TDS Telecom in the future.
Financial and operating highlights for 2009 include the following:
- Equivalent access lines decreased 3% to 1,131,800 as compared to December 31, 2008. Equivalent access lines are the sum of physical access lines and high-capacity data lines adjusted to estimate the equivalent number of physical access lines in terms of capacity. A physical access line is an individual circuit connecting a customer to a telephone company's central office facilities. Each digital subscriber line ("DSL") is treated as an equivalent access line in addition to a voice line that may operate on the same copper loop. Additionally, each managed IP handset is considered an equivalent access line.
- Operating revenues decreased $34.4 million or 4% to $789.9 million in 2009. The decrease was primarily due to a decline in ILEC and CLEC physical access lines as well as a decline in voice network usage by inter-exchange carriers. These decreases were partially offset by the increase in revenues derived from an increase in ILEC data customers and the acquisition of one ILEC company in 2009 and three ILEC companies in 2008.
- Operating expenses increased $15.2 million or 2% to $697.3 million in 2009. The increase was primarily due to an increase in legal, excise and sales tax expenses arising from discrete matters totaling $3.5 million and severance of $5.1 million incurred as a result of workforce reduction initiatives. Additional costs were also incurred from operating the four ILEC companies acquired in 2008 and 2009. Partially offsetting these increases in expenses were discrete events related to employee compensation modifications which reduced expenses by $4.1 million.
- Operating income decreased to $92.6 million during 2009 compared to $142.2 million in 2008, as a result of decreased operating revenues and increased expenses noted above.
- Additions to property, plant and equipment totaled $120.5 million in 2009.
See "Results of Operations—Wireline."
2010 Wireline Estimates
TDS Telecom's estimates of full-year 2010 results are shown below. Such forward-looking statements should not be assumed to be accurate as of any future date. Such estimates represent TDS Telecom's view as of the filing date of TDS' Form 10-K for the year ended December 31, 2009. TDS undertakes no duty to update such information whether as a result of new information, future events or otherwise. There can be no assurance that final results will not differ materially from these estimated results.
| |
2010 Estimated Results |
2009 Actual Results |
|||
|---|---|---|---|---|---|
ILEC and CLEC operations: |
|||||
Operating revenues |
$740 - $780 million | $789.9 million | |||
Operating income |
$70 - $100 million | $92.6 million | |||
Depreciation, amortization and accretion expenses and losses on asset disposals(1) |
Approx. $170 million | $169.7 million | |||
Capital expenditures |
Approx. $140 million | $120.5 million | |||
| (1) | 2009 Actual Results include losses on disposals of $2.4 million. The 2010 Estimated Results include only the estimate for Depreciation, amortization and accretion expenses and losses on asset disposals, and do not include any estimate for losses on impairment of assets since these cannot be predicted. |
The above estimates reflect the expectations of TDS Telecom's management considering the current general economic conditions. During this challenging business environment, TDS Telecom will continue to focus on its cost-reduction initiatives through product cost improvement and process efficiencies. TDS Telecom also plans to continue to focus on customer retention programs, including "triple-play" bundles involving voice, DSL and satellite TV.
Cash Flows and Investments—TDS and its subsidiaries had cash and cash equivalents totaling $671.0 million, short-term investments in the form of certificates of deposit aggregating $113.3 million and borrowing capacity under their revolving credit facilities of $696.4 million as of December 31, 2009. In addition to U.S. Cellular's new $300 million revolving credit agreement, as previously discussed, on June 30, 2009, TDS entered into a new $400 million revolving credit agreement with certain lenders and other parties. As a result, TDS' $600 million revolving credit agreement, which was due to expire in December 2009, was terminated on June 30, 2009 as a condition of entering into the new agreement. TDS' and U.S. Cellular's new revolving credit agreements provide TDS with an aggregate $700 million of availability for general corporate purposes. Also, during 2009, TDS and its subsidiaries generated $1,102.6 million of cash flows from operating activities. Management believes that cash on hand, expected future cash flows from operating activities and sources of external financing provide substantial liquidity and financial flexibility and are sufficient to permit TDS and its subsidiaries to finance their contractual obligations and anticipated capital and operating expenditures for the foreseeable future.
See "Financial Resources" and "Liquidity and Capital Resources" below for additional information related to cash flows and investments, including information related to TDS' and U.S. Cellular's new revolving credit agreements.
Recent Developments—Congress recently enacted the American Recovery and Reinvestment Act of 2009, or the Recovery Act, which provides, among other things, for an aggregate appropriation of $7.2 billion to fund grants and loans to provide broadband infrastructure, access and equipment to consumers residing in rural, unserved or underserved areas of the United States. TDS Telecom and U.S. Cellular submitted applications for grants in the first round of funding in the amounts of $62.6 million and $23.5 million, respectively. TDS Telecom received approval for two of its applications in the aggregate amount of $12.5 million while U.S. Cellular has been notified that none of its applications were granted. TDS Telecom and U.S. Cellular are currently considering submitting additional applications for grants in the second round of funding, which applications are due March 15, 2010. There is no assurance TDS Telecom and/or U.S. Cellular will receive any additional grants of Recovery Act funds. The distribution of Recovery Act funds to other telecommunications service providers could impact competition in certain of TDS Telecom's and U.S. Cellular's service areas.
December 31,
|
2009 | Increase/ (Decrease) |
Percentage Change |
2008 | Increase/ (Decrease) |
Percentage Change |
2007 | |||||||||||||||||||
|---|---|---|---|---|---|---|---|---|---|---|---|---|---|---|---|---|---|---|---|---|---|---|---|---|---|---|
| |
(Dollars in thousands, except per share amounts) |
|||||||||||||||||||||||||
Operating revenues |
||||||||||||||||||||||||||
U.S. Cellular |
$ | 4,214,611 | $ | (28,574 | ) | (1) | % | $ | 4,243,185 | $ | 296,921 | 8 | % | $ | 3,946,264 | |||||||||||
TDS Telecom |
789,852 | (34,430 | ) | (4) | % | 824,282 | (35,929 | ) | (4) | % | 860,211 | |||||||||||||||
All other(1) |
16,211 | (8,341 | ) | (34) | % | 24,552 | 2,043 | 9 | % | 22,509 | ||||||||||||||||
Total operating revenues |
5,020,674 | (71,345 | ) | (1) | % | 5,092,019 | 263,035 | 5 | % | 4,828,984 | ||||||||||||||||
Operating expenses |
||||||||||||||||||||||||||
U.S. Cellular |
3,888,204 | (327,271 | ) | (8) | % | 4,215,475 | 665,410 | 19 | % | 3,550,065 | ||||||||||||||||
TDS Telecom |
697,287 | 15,249 | 2 | % | 682,038 | (36,971 | ) | (5) | % | 719,009 | ||||||||||||||||
All other(1) |
27,377 | (38,975 | ) | (59) | % | 66,352 | 34,340 | >100 | % | 32,012 | ||||||||||||||||
Total operating expenses |
4,612,868 | (350,997 | ) | (7) | % | 4,963,865 | 662,779 | 15 | % | 4,301,086 | ||||||||||||||||
Operating income (loss) |
||||||||||||||||||||||||||
U.S. Cellular |
326,407 | 298,697 | >100 | % | 27,710 | (368,489 | ) | (93) | % | 396,199 | ||||||||||||||||
TDS Telecom |
92,565 | (49,679 | ) | (35) | % | 142,244 | 1,042 | 1 | % | 141,202 | ||||||||||||||||
All other(1) |
(11,166 | ) | 30,634 | 73 | % | (41,800 | ) | (32,297 | ) | >100 | % | (9,503 | ) | |||||||||||||
Total operating income |
407,806 | 279,652 | >100 | % | 128,154 | (399,744 | ) | (76) | % | 527,898 | ||||||||||||||||
Other income and (expenses) |
||||||||||||||||||||||||||
Equity in earnings of unconsolidated entities |
90,732 | 920 | 1 | % | 89,812 | (2,019 | ) | (2) | % | 91,831 | ||||||||||||||||
Interest and dividend income |
11,121 | (28,010 | ) | (72) | % | 39,131 | (160,304 | ) | (80) | % | 199,435 | |||||||||||||||
Interest expense |
(124,557 | ) | 13,342 | 10 | % | (137,899 | ) | 70,837 | 34 | % | (208,736 | ) | ||||||||||||||
Gain on investments and financial instruments |
— | (31,595 | ) | N/M | 31,595 | (49,828 | ) | (61) | % | 81,423 | ||||||||||||||||
Other, net |
2,000 | (213 | ) | (10) | % | 2,213 | 8,614 | >100 | % | (6,401 | ) | |||||||||||||||
Total other income (expenses) |
(20,704 | ) | (45,556 | ) | >100 | % | 24,852 | (132,700 | ) | (84) | % | 157,552 | ||||||||||||||
Income before income taxes and extraordinary item |
387,102 |
234,096 |
>100 |
% |
153,006 |
(532,444 |
) |
(78) |
% |
685,450 |
||||||||||||||||
Income tax expense |
133,376 | 103,283 | >100 | % | 30,093 | (238,961 | ) | (89) | % | 269,054 | ||||||||||||||||
Income before extraordinary item |
253,726 | 130,813 | >100 | % | 122,913 | (293,483 | ) | (70) | % | 416,396 | ||||||||||||||||
Extraordinary item, net of tax |
— | — | N/M | — | (42,827 | ) | N/M | 42,827 | ||||||||||||||||||
Net income |
253,726 | 130,813 | >100 | % | 122,913 | (336,310 | ) | (73) | % | 459,223 | ||||||||||||||||
Less: Net income attributable to noncontrolling interests, net of tax |
(59,824 | ) | (30,452 | ) | >100 | % | (29,372 | ) | 43,739 | 60 | % | (73,111 | ) | |||||||||||||
Net income attributable to TDS shareholders |
193,902 | 100,361 | >100 | % | 93,541 | (292,571 | ) | (76) | % | 386,112 | ||||||||||||||||
Preferred dividend requirement |
(51 | ) | 1 | 2 | % | (52 | ) | — | — | (52 | ) | |||||||||||||||
Net income available to common |
$ | 193,851 | $ | 100,362 | >100 | % | $ | 93,489 | $ | (292,571 | ) | (76) | % | $ | 386,060 | |||||||||||
Basic earnings per share attributable to TDS shareholders |
$ | 1.77 | $ | 0.96 | >100 | % | $ | 0.81 | $ | (2.47 | ) | (75) | % | $ | 3.28 | |||||||||||
Diluted earnings per share attributable to TDS shareholders |
$ | 1.77 | $ | 0.97 | >100 | % | $ | 0.80 | $ | (2.42 | ) | (75) | % | $ | 3.22 | |||||||||||
| (1) | Consists of non-reportable segment, corporate operations and intercompany eliminations. |
N/M—Percentage change not meaningful
Operating Revenues and Expenses
See "Results of Operations—Wireless" and "Results of Operations—Wireline" below for factors that affected Operating revenues and expenses.
Operating expenses included impairment losses on licenses held at U.S. Cellular in 2009, 2008 and 2007, and are discussed in "Results of Operations—Wireless". An additional $27.7 million impairment loss on licenses was recognized at the TDS consolidated level in 2008 due to the fact that TDS accounted for U.S. Cellular's share repurchases as step acquisitions, allocating a portion of the repurchase value to TDS licenses, as required by GAAP in effect at that time.
The impact of impairment losses related to licenses was as follows:
| |
2009 | 2008 | 2007 | |||||||
|---|---|---|---|---|---|---|---|---|---|---|
| |
(Dollars in millions, except per share amounts) |
|||||||||
Net income attributable to TDS shareholders, excluding licenses impairments(1) |
$ | 201.0 | $ | 302.7 | $ | 397.9 | ||||
Loss on impairment of intangible assets related to licenses(2) |
(14.0 | ) | (414.4 | ) | (23.0 | ) | ||||
Income tax and noncontrolling interest impact of licenses impairment(1) |
6.9 | 205.2 | 11.2 | |||||||
Impact of licenses impairments on Net income attributable to TDS shareholders(1) |
(7.1 | ) | (209.2 | ) | (11.8 | ) | ||||
Net income attributable to TDS shareholders |
$ | 193.9 | $ | 93.5 | $ | 386.1 | ||||
Diluted earnings per share attributable to TDS shareholders, excluding licenses impairments(1) |
$ | 1.84 | $ | 2.60 | $ | 3.32 | ||||
Impact of licenses impairments on Diluted earnings per share attributable to TDS shareholders(1) |
(0.07 | ) | (1.80 | ) | (0.10 | ) | ||||
Diluted earnings per share attributable to TDS shareholders |
$ | 1.77 | $ | 0.80 | $ | 3.22 | ||||
| (1) | These amounts are non-GAAP financial measures. The purpose of presenting these measures is to provide information on the impact of losses on impairment related to licenses on results of operations. Such impairments are discrete, significant amounts that impact the comparability of the results of operations, and TDS believes it is useful to disclose these impacts. The income tax and noncontrolling interest impact is calculated by allocating the losses on impairment to the respective consolidated subsidiaries, and applying the income tax rate and noncontrolling interest percentages applicable to these respective subsidiaries. |
| (2) | Loss on impairment of intangible assets on the Consolidated Statement of Operations for 2007 also included a $1.9 million loss on impairment related to customer lists. |
Equity in earnings of unconsolidated entities
Equity in earnings of unconsolidated entities represents TDS' share of net income from markets in which it has a noncontrolling interest and that are accounted for by the equity method. TDS follows the equity method of accounting for unconsolidated entities over which it has the ability to exercise significant influence, generally entities in which its ownership interest is less than or equal to 50% but equals or exceeds 20% for corporations and 3% for partnerships and limited liability companies.
TDS' investment in the Los Angeles SMSA Limited Partnership ("LA Partnership") contributed $64.7 million, $66.1 million and $71.2 million to Equity in earnings of unconsolidated entities in 2009, 2008 and 2007, respectively. TDS also received cash distributions from the LA Partnership of $66.0 million in each of 2009, 2008 and 2007.
Interest and dividend income
Interest income decreased $18.0 million in 2009 compared to 2008 and $42.2 million in 2008 compared to 2007 primarily due to a lower interest rate earned on cash balances. The weighted average return on cash investments declined due to both a decline in short-term interest rates and a change in the composition of TDS' cash investments. TDS invested substantially all of its cash balances in prime money market funds from January 2007 through August 2007 and in money market funds that invest exclusively in short-term U.S. Treasury securities or repurchase agreements backed by U.S. Treasury securities thereafter. In addition, lower average investment balances in 2009 compared to 2008 contributed to the interest income decline.
Dividend income decreased by $10.0 million in 2009 and by $118.1 million in 2008 primarily due to a decrease in dividends from Deutsche Telekom Ordinary Shares. A portion of these shares were disposed of in 2007, and the remainder of these shares were disposed of in 2008.
Interest expense
The decrease in interest expense in 2009 and 2008 was primarily attributable to variable prepaid forward contracts. TDS settled a portion of these contracts in 2007, and the remainder in 2008.
Interest expense is summarized by related debt instrument in the following table:
Year Ended December 31,
|
2009 | 2008 | 2007 | |||||||
|---|---|---|---|---|---|---|---|---|---|---|
| |
(Dollars in thousands) |
|||||||||
Forward contracts |
$ | — | $ | 12,028 | $ | 77,543 | ||||
U.S. Cellular 6.7% senior notes |
37,084 | 37,085 | 37,084 | |||||||
U.S. Cellular 7.5% senior notes |
25,114 | 25,113 | 25,113 | |||||||
U.S. Cellular 8.75% senior notes(1) |
11,166 | 11,383 | 11,380 | |||||||
TDS 7.6% notes |
38,414 | 38,414 | 38,414 | |||||||
TDS 6.625% notes |
7,798 | 7,798 | 7,798 | |||||||
U.S. Cellular revolving credit facility |
3,011 | 3,061 | 4,967 | |||||||
TDS revolving credit facility |
2,547 | 1,695 | 2,765 | |||||||
Other |
(577 | ) | 1,322 | 3,672 | ||||||
Total interest expense |
$ | 124,557 | $ | 137,899 | $ | 208,736 | ||||
| (1) | The 8.75% senior notes were due November 1, 2032. Interest was paid quarterly. U.S. Cellular redeemed the notes in whole at the redemption price equal to 100% of the principal amount plus accrued and unpaid interest on December 24, 2009, which resulted in a total redemption payment of $131.7 million. |
Gain on investments and financial instruments
In 2008, Gain on investments and financial instruments consisted primarily of a $31.7 million gain realized upon the disposition of Rural Cellular Corporation Common Shares.
In 2007, Gain on investments and financial instruments included an aggregate net gain of $75.1 million related the investments in Vodafone American Depository Receipts, VeriSign Common Shares and Deutsche Telekom Ordinary Shares, including the settlement and disposition of a portion of these investments and related collars. Also included in 2007 was a $6.3 million additional gain from the sale of U.S. Cellular's interest in Midwest Wireless Communications, LLC ("Midwest Wireless").
See Note 3—Fair Value Measurements in the Notes to Consolidated Financial Statements for more information on the gains and losses on investments and financial instruments.
Income tax expense
The effective tax rates on Income before income taxes and extraordinary item ("pre-tax income") for 2009, 2008 and 2007 were 34.5%, 19.7% and 39.3%, respectively. The following significant discrete and other items impacted income tax expense for these years:
2009—Includes a tax benefit of $8.4 million resulting from a state tax law change.
2008—Includes tax benefits of $19.7 million and $7.4 million recorded upon the final disposition of the Deutsche Telekom Ordinary Shares and from a change in filing positions in certain states, respectively. The percentage impact of these items was magnified due to the 2008 Loss on impairment of intangible assets of $414.4 million, which decreased pre-tax income.
2007—Includes tax expense of $6.1 million, $4.6 million and $11.4 million primarily due to the increase in valuation allowances resulting from to the restructuring of certain legal entities, a write-off of deferred tax assets for certain partnerships, and foreign taxes related to dividend income on the Deutsche Telekom Ordinary Shares, respectively.
Net income attributable to noncontrolling interests, net of tax
Net income attributable to noncontrolling interests, net of tax includes the noncontrolling public shareholders' share of U.S. Cellular's net income, the noncontrolling shareholders' or partners' share of certain U.S. Cellular subsidiaries' net income or loss and other TDS noncontrolling interests.
Year Ended December 31,
|
2009 | 2008 | 2007 | |||||||||
|---|---|---|---|---|---|---|---|---|---|---|---|---|
| |
(Dollars in thousands) |
|||||||||||
Net income attributable to noncontrolling interest, net of tax |
||||||||||||
U.S. Cellular |
||||||||||||
Noncontrolling public shareholders' |
$ | (40,151 | ) | $ | (6,629 | ) | $ | (60,600 | ) | |||
Noncontrolling shareholders' or partners' |
(19,673 | ) | (22,743 | ) | (12,398 | ) | ||||||
|
(59,824 | ) | (29,372 | ) | (72,998 | ) | ||||||
Other |
— | — | (113 | ) | ||||||||
|
$ | (59,824 | ) | $ | (29,372 | ) | $ | (73,111 | ) | |||
Extraordinary Item
The extraordinary item was attributable to TDS Telecom's discontinuance of application of accounting for regulated enterprises prescribed by FASB ASC 980, Regulated Operations ("FASB ASC 980"), in the third quarter of 2007. See Note 5—Extraordinary Item in the Notes to Consolidated Financial Statements for more information.
TDS provides wireless telephone service through U.S. Cellular, an 82%-owned subsidiary. U.S. Cellular owns, manages and invests in wireless markets throughout the United States.
Following is a table of summarized operating data for U.S. Cellular's consolidated operations.
As of December 31,(1)
|
2009 | 2008 | 2007 | |||||||
|---|---|---|---|---|---|---|---|---|---|---|
Total market population of consolidated operating markets(2) |
46,306,000 | 46,009,000 | 44,955,000 | |||||||
Customers(3) |
6,141,000 | 6,196,000 | 6,102,000 | |||||||
Market penetration(2) |
13.3 | % | 13.5 | % | 13.6 | % | ||||
Total full-time equivalent employees(4) |
8,867 | 8,712 | 8,067 | |||||||
Cell sites in service |
7,279 | 6,877 | 6,383 | |||||||
For the Year Ended December 31,(5) |
2009 |
2008 |
2007 |
|||||||
Net retail customer additions(6) |
37,000 | 149,000 | 333,000 | |||||||
Net customer additions (losses)(6) |
(55,000 | ) | 91,000 | 281,000 | ||||||
Average monthly service revenue per customer(7) |
$ | 53.00 | $ | 53.23 | $ | 51.17 | ||||
Postpay churn rate(8) |
1.6 | % | 1.5 | % | 1.4 | % | ||||
| (1) | Amounts include results for U.S. Cellular's consolidated operating markets as of December 31. |
| (2) | Calculated using 2008, 2007 and 2006 Claritas population estimates for 2009, 2008 and 2007, respectively. "Total market population of consolidated operating markets" is used only for the purposes of calculating market penetration of consolidated operating markets, which is calculated by dividing customers by the total market population (without duplication of population in overlapping markets). |
The total market population and penetration measures for consolidated operating markets apply to markets in which U.S. Cellular provides wireless service to customers. For comparison purposes, total market population and penetration related to all consolidated markets in which U.S. Cellular owns an interest were 89,712,000 and 6.8%, 83,014,000 and 7.5%, and 82,371,000 and 7.4% as of December 31, 2009, 2008 and 2007, respectively.
A wholly owned subsidiary of U.S. Cellular is a limited partner in King Street Wireless, L.P. ("King Street Wireless"), an entity which participated in the auction of wireless spectrum in the 700 megahertz band designated by the FCC as Auction 73. At the conclusion of the auction on March 20, 2008, King Street Wireless was the provisional winning bidder with respect to 152 licenses. These 152 license areas cover portions of 27 states and are in markets which are either adjacent to or overlap current U.S. Cellular license areas. On December 30, 2009, the FCC granted the licenses to King Street Wireless which increased total market population of consolidated markets by 4,549,000 in 2009, but had no impact on the population of consolidated operating markets.
As a result of exchange transactions with AT&T that closed in August 2003, U.S. Cellular obtained rights to acquire additional licenses, and all except one of such licenses have been acquired and are reflected in the total market population of consolidated markets as of December 31, 2009. During 2009, U.S. Cellular acquired licenses pursuant to this exchange agreement which increased total market population of consolidated markets by 1,392,000, but had no impact on the population of consolidated operating markets. The acquisition of these licenses did not require U.S. Cellular to provide any consideration to AT&T beyond that already provided in conjunction with the August 2003 exchange transaction and, thus, did not cause a change in U.S. Cellular's Licenses balance in 2009. U.S. Cellular continues to have a right under the August 2003 exchange agreement to acquire a majority interest in one additional license; that right does not have a stated expiration date.
(3)
U.S. Cellular's customer base consists of the following types of customers:
| |
2009 | 2008 | 2007 | |||||||
|---|---|---|---|---|---|---|---|---|---|---|
Customers on postpay service plans in which the end user is a customer of U.S. Cellular ("postpay customers") |
5,482,000 | 5,420,000 | 5,269,000 | |||||||
Customers on prepay service plans in which the end user is a customer of U.S. Cellular ("prepay customers") |
262,000 | 287,000 | 295,000 | |||||||
Total retail customers |
5,744,000 | 5,707,000 | 5,564,000 | |||||||
End user customers acquired through U.S. Cellular's agreements with third parties ("reseller customers") |
397,000 | 489,000 | 538,000 | |||||||
Total customers |
6,141,000 | 6,196,000 | 6,102,000 | |||||||
(4)
Part-time employees are calculated at 70% of full-time employees. Prior year numbers were adjusted to conform to current year presentation.
(5)
Amounts include results for U.S. Cellular's consolidated operating markets for the period January 1 through December 31; operating markets acquired during a particular period are included as of the acquisition date.
(6)
"Net retail customer additions" represents the number of net customers added to U.S. Cellular's retail customer base through its marketing distribution channels; this measure excludes activity related to reseller customers and customers transferred through acquisitions, divestitures or exchanges. "Net customer additions (losses)" represents the number of net customers added to (deducted from) U.S. Cellular's overall customer base through its marketing distribution channels; this measure includes activity related to reseller customers but excludes activity related to customers transferred through acquisitions, divestitures or exchanges.
(7)
Management uses this measurement to assess the amount of service revenue that U.S. Cellular generates each month on a per customer basis. Variances in this measurement are monitored and compared to variances in expenses on a per customer basis. Average monthly service revenue per customer is calculated as follows
| |
2009 | 2008 | 2007 | |||||||
|---|---|---|---|---|---|---|---|---|---|---|
Service revenues per Consolidated Statement of Operations (000s) |
$ | 3,927,859 | $ | 3,940,326 | $ | 3,679,237 | ||||
Divided by average customers during period (000s)* |
6,176 | 6,169 | 5,992 | |||||||
Divided by number of months in each period |
12 | 12 | 12 | |||||||
Average monthly service revenue per customer |
$ | 53.00 | $ | 53.23 | $ | 51.17 | ||||
* "Average customers during period" is calculated by adding the number of total customers at the beginning of the first month of the period and at the end of each month in the period and dividing by the number of months in the period plus one. Acquired and divested customers are included in the calculation on a prorated basis for the amount of time U.S. Cellular included such customers during each period.
(8)
Postpay churn rate represents the percentage of the postpay customer base that disconnects service each month.
Components of Operating Income
Year Ended December 31,
|
2009 | Increase/ (Decrease) |
Percentage Change |
2008 | Increase/ (Decrease) |
Percentage Change |
2007 | ||||||||||||||||
|---|---|---|---|---|---|---|---|---|---|---|---|---|---|---|---|---|---|---|---|---|---|---|---|
| |
(Dollars in thousands) |
||||||||||||||||||||||
Retail service |
$ | 3,478,939 | $ | 33,177 | 1 | % | $ | 3,445,762 | $ | 191,800 | 6 | % | $ | 3,253,962 | |||||||||
Inbound roaming |
252,775 | (76,421 | ) | (23 | )% | 329,196 | 35,430 | 12 | % | 293,766 | |||||||||||||
Other |
196,145 | 30,777 | 19 | % | 165,368 | 33,859 | 26 | % | 131,509 | ||||||||||||||
Service revenues |
3,927,859 | (12,467 | ) | — | 3,940,326 | 261,089 | 7 | % | 3,679,237 | ||||||||||||||
Equipment sales |
286,752 | (16,107 | ) | (5 | )% | 302,859 | 35,832 | 13 | % | 267,027 | |||||||||||||
Total operating revenues |
4,214,611 | (28,574 | ) | (1 | )% | 4,243,185 | 296,921 | 8 | % | 3,946,264 | |||||||||||||
System operations (excluding Depreciation, amortization and accretion reported below) |
796,617 | 12,560 | 2 | % | 784,057 | 66,982 | 9 | % | 717,075 | ||||||||||||||
Cost of equipment sold |
742,993 | (413 | ) | — | 743,406 | 106,109 | 17 | % | 637,297 | ||||||||||||||
Selling, general and administrative |
1,748,760 | 47,710 | 3 | % | 1,701,050 | 142,482 | 9 | % | 1,558,568 | ||||||||||||||
Depreciation, amortization and accretion |
570,658 | (6,273 | ) | (1 | )% | 576,931 | (1,255 | ) | — | 578,186 | |||||||||||||
Loss on impairment of intangible assets |
14,000 | (372,653 | ) | (96 | )% | 386,653 | 361,730 | >100 | % | 24,923 | |||||||||||||
Loss on asset disposals, net |
15,176 | (8,202 | ) | (35 | )% | 23,378 | (10,638 | ) | (31 | )% | 34,016 | ||||||||||||
Total operating expenses |
3,888,204 | (327,271 | ) | (8 | )% | 4,215,475 | 665,410 | 19 | % | 3,550,065 | |||||||||||||
Operating income |
$ | 326,407 | $ | 298,697 | >100 | % | $ | 27,710 | $ | (368,489 | ) | (93 | )% | $ | 396,199 | ||||||||
N/M—Percentage change not meaningful
Operating Revenues
Service revenues
Service revenues consist primarily of: (i) charges for access, airtime, roaming, recovery of regulatory costs and value-added services, including data products and services and long distance, provided to U.S. Cellular's retail customers and to end users through third-party resellers ("retail service"); (ii) charges to other wireless carriers whose customers use U.S. Cellular's wireless systems when roaming, including long-distance roaming ("inbound roaming"); and (iii) amounts received from the Federal Universal Service Fund ("USF").
Retail service revenues
The increase in Retail service revenues in 2009 was due primarily to an increase in average monthly retail service revenue per customer. The increase in 2008 was due primarily to growth in U.S. Cellular's average customer base and an increase in average monthly retail service revenue per customer.
The average number of customers in 2009 was relatively flat compared to 2008. The increase in the average number of customers in 2008 was driven primarily by the net retail customer additions that U.S. Cellular generated from its marketing distribution channels and by the timing of acquisitions.
Average monthly retail service revenue per customer increased 1% to $46.94 in 2009 from $46.55 in 2008, and increased 3% in 2008 from $45.25 in 2007. The increase in average monthly retail service revenue was driven primarily by growth in revenues from data products and services.
Revenues from data products and services totaled $683.0 million in 2009, $511.7 million in 2008, and $367.9 million in 2007 and represented 17% of total service revenues in 2009 compared to 13% and 10% of total service revenues in 2008 and 2007, respectively. Such growth, which positively impacted average monthly retail service revenue per customer, reflected customers' continued and increasing usage of U.S. Cellular's text, picture, and video messaging services, easyedgeSM service and applications, premium mobile Internet services, and smartphone handsets and services. In 2009, U.S. Cellular introduced unlimited messaging plans and unlimited messaging and mobile Internet plans that further drove data usage and revenues. U.S. Cellular expects that the growth in revenues from data products and services will continue as customers increasingly purchase premium and smartphone devices along with data plans and applications and utilize U.S. Cellular's 3G network. U.S. Cellular's 3G network covered approximately 75% of its customers as of December 31, 2009. U.S. Cellular expects to expand its 3G network to cover approximately 98% of its customers by the end of 2010.
Revenues from voice services declined year-over-year primarily due to a reduction in average voice revenue per customer. The reduction in average voice revenue per customer reflects industry competition which has resulted in lower pricing for voice services as well as growth in family plans and service plans with enhanced coverage areas and value (such as free incoming calls, free mobile-to-mobile and unlimited minutes). Also, decreases in the prepay customer base and the average revenue per prepay customer contributed to a decline in prepay voice revenues. U.S. Cellular expects continued pressure on revenues from voice services in the foreseeable future due to industry competition related to service plan offerings.
Inbound roaming revenues
The decrease in Inbound roaming revenues in 2009 was due primarily to a decline in roaming revenues from the combined entity of Verizon Wireless ("Verizon") and Alltel Corporation ("Alltel"). In January 2009, Verizon acquired Alltel. As a result of this transaction, the network footprints of Verizon and Alltel were combined. This has resulted in a decrease in inbound roaming revenues for U.S. Cellular, since the combined Verizon and Alltel entity has reduced its usage of U.S. Cellular's network in certain coverage areas that were used by Verizon and Alltel (as separate entities). U.S. Cellular anticipates that inbound roaming revenues will stabilize in 2010 compared to 2009 due to the positive impact of increasing minutes of use and increasing data usage from U.S. Cellular's roaming partners, partially offset by the negative impact of decreasing rates per minute or kilobyte of use.
In 2008, the increase in Inbound roaming revenues was related primarily to higher usage for both voice and data products and services, partially offset by a decline in rates per minute or kilobyte of use with key roaming partners. The increase in inbound usage was driven primarily by the overall growth in the number of customers and higher usage per customer throughout the wireless industry, including usage related to both voice and data products and services, which led to an increase in inbound traffic from other wireless carriers.
Other revenues
The increases in Other revenues in 2009 and 2008 were due primarily to increases in amounts that were received from the USF for states in which U.S. Cellular has been designated as an ETC. U.S. Cellular was eligible to receive ETC funds in sixteen states in 2009 and 2008 and eleven states in 2007. ETC revenues recorded in 2009, 2008 and 2007 were $150.7 million, $127.5 million and $98.0 million, respectively.
In May 2008, the FCC adopted a state-by-state temporary cap to funding for competitive ETCs based on the funding level available as of March 31, 2008. The cap has had the effect of reducing the amount of support that U.S. Cellular would otherwise have been eligible to receive. During 2010, the FCC will likely issue a notice of proposed rulemaking to consider reform of the USF program in conjunction with the issuance of a National Broadband Plan in March 2010. Adoption of a USF reform proposal by the FCC could have a significant, and adverse, impact on the amount of support, if any, wireless ETCs continue to receive. As a result U.S. Cellular's ETC revenues may decline significantly in future periods.
Equipment sales revenues
Equipment sales revenues include revenues from sales of handsets and related accessories to both new and existing customers, as well as revenues from sales of handsets and accessories to agents. All equipment sales revenues are recorded net of rebates.
U.S. Cellular strives to offer a competitive line of quality handsets to both new and existing customers. U.S. Cellular's customer retention efforts include offering new handsets, such as smartphones and premium handsets, at discounted prices to existing customers as the expiration date of the customer's service contract approaches. U.S. Cellular also continues to sell handsets to agents; this practice enables U.S. Cellular to provide better control over the quality of handsets sold to its customers, establish roaming preferences and earn quantity discounts from handset manufacturers which are passed along to agents. U.S. Cellular anticipates that it will continue to sell handsets to agents in the future.
The decrease in 2009 Equipment sales revenues was driven primarily by a decline of 8% in average revenue per handset sold due to aggressive promotional pricing across all categories of handsets, partially offset by an increase in the total number of handsets sold. The increase in 2008 Equipment sales revenues was driven by an increase of 10% in average revenue per handset sold, primarily reflecting the sale of more expensive handsets with expanded capabilities, including smartphones and premium handsets.
Operating Expenses
System operations expenses (excluding Depreciation, amortization and accretion)
System operations expenses (excluding Depreciation, amortization and accretion) include charges from wireline telecommunications service providers for U.S. Cellular's customers' use of their facilities, costs related to local interconnection to the wireline network, charges for maintenance of U.S. Cellular's network, long-distance charges, outbound roaming expenses and payments to third-party data product and platform developers.
Key components of the overall increases in system operations expenses were as follows:
- Maintenance, utility and cell site expenses increased $14.4 million, or 5%, in 2009 and $24.6 million, or 9% in 2008, driven primarily by increases in the number of cell sites within U.S. Cellular's network. The number of cell sites totaled 7,279 in 2009, 6,877 in 2008 and 6,383 in 2007, as U.S. Cellular continued to grow by expanding and enhancing coverage in its existing markets. In 2008 and 2007, growth also included acquisitions of existing wireless operations. The increase in 2009 and 2008 also was due to an increase in software maintenance costs to support rapidly growing data needs.
- Expenses incurred when U.S. Cellular's customers used other carriers' networks while roaming increased $4.3 million, or 2%, in 2009 and $28.0 million, or 17%, in 2008. The increase in 2009 was due primarily to higher data usage. The increase in 2008 was due to an increase in roaming minutes of use driven by customer migration to national and wide area plans.
- In 2009, the cost of network usage on U.S. Cellular's systems decreased $6.1 million, or 2%, due primarily to reduced interconnection costs, which reflected a change in estimate during the fourth quarter (as disclosed in Note (4) to the Consolidated Quarterly Information (Unaudited) below), partially offset by an increase in data usage. In 2008, cost of network usage increased $14.4 million, or 5%, as voice and data usage on U.S. Cellular's systems increased driven primarily by continued migration to voice plans with a larger number of packaged minutes, text messaging plans, and other data offerings. In both years, data network and developer costs also increased due to the increase in data usage.
U.S. Cellular expects total system operations expenses to increase in the foreseeable future, driven by the following factors:
- Increases in the number of cell sites and other network facilities within U.S. Cellular's systems as it continues to add capacity and enhance quality;
- Continued expansion of 3G services to additional markets; and
- Increases in total customer usage, driven by text messaging and other data usage, both on U.S. Cellular's network and by U.S. Cellular's customers on other carriers' networks when roaming.
Cost of equipment sold
Cost of equipment sold remained relatively flat in 2009 compared to 2008. A reduction in the average cost per handset sold, reflecting lower overall purchase costs, was offset by an increase in the total number of handsets sold. Cost of equipment sold increased in 2008 due primarily to a 13% increase in the average cost per handset sold as a result of sales of more expensive handsets with expanded capabilities, including smartphones and premium handsets.
U.S. Cellular expects loss on equipment, defined as equipment sales revenues less cost of equipment sold, to increase in the foreseeable future as wireless carriers continue to use handset availability and pricing as a means of competitive differentiation. New handsets with expanded capabilities, particularly smartphones and premium handsets, generally have higher purchase costs for carriers which, due to competitive market conditions, generally cannot be recovered through proportionately higher selling prices to customers.
Selling, general and administrative expenses
Selling, general and administrative expenses include salaries, commissions and expenses of field sales and retail personnel and facilities; telesales department salaries and expenses; agent commissions and related expenses; corporate marketing and merchandise management; and advertising. Selling, general and administrative expenses also include bad debts expense, costs of operating customer care centers and corporate expenses.
Key components of the net increases in Selling, general and administrative expenses were as follows:
2009—
- General and administrative expenses increased $57.4 million, or 7%, due primarily to higher bad debts expense as a result of higher bad debt write-offs and a change in estimate during the fourth quarter (as disclosed in Note (4) to the Consolidated Quarterly Information (Unaudited) below); higher employee related expenses; costs of the Battery Swap program; and investments in multi-year initiatives as described in the Overview section. Partially offsetting these and other increases were lower USF contributions (most of the USF contribution expenses are offset by revenues for amounts passed through to customers).
- Advertising expenses decreased $18.3 million, or 7%. Advertising expenses in 2008 included expenditures related to the launch in June 2008 of a new branding campaign, Believe in Something Better®.
- Other selling and marketing expenses increased $8.6 million, or 2%, reflecting higher commissions due to a greater number of retail sales and renewals.
2008—
- General and administrative expenses increased $63.3 million, or 8%, due to increases in employee related expenses; increases related to bad debts expense (reflecting both higher revenues and higher bad debts as a percent of revenues); and increases in USF contributions and other regulatory fees and taxes. Partially offsetting these expenses were decreases in consulting and outsourcing expenses and billing expenses.
- Advertising expenses increased $47.3 million, or 21%, due primarily to an increase in media purchases, including expenditures related to the launch in June 2008 of a new branding campaign, Believe in Something Better®.
- Other selling and marketing expenses increased $31.9 million, or 6%, reflecting more retail sales associates, higher retail facilities expenses and higher commissions due to a greater number of retail sales and renewals.
U.S. Cellular expects Selling, general and administrative expenses to increase in the foreseeable future driven primarily by increases in expenses associated with acquiring, serving and retaining customers, as well as costs related to its multi-year initiatives discussed previously.
Depreciation, amortization and accretion
Depreciation, amortization and accretion decreased $6.3 million, or 1%, due primarily to fully depreciating Time Division Multiple Access ("TDMA") and analog network equipment in 2008, partially offset by accelerating depreciation of certain cell site and switch equipment in 2009. U.S. Cellular discontinued its TDMA-based service in 2009; in connection with such discontinuance, property, plant and equipment in service and accumulated depreciation of $452.0 million were eliminated from the Consolidated Balance Sheet.
See "Financial Resources" and "Liquidity and Capital Resources" for a discussion of U.S. Cellular's capital expenditures.
Loss on impairment of intangible assets
U.S. Cellular recognized impairment losses on licenses of $14.0 million and $386.7 million in 2009 and 2008, respectively. The impairment losses on licenses in 2009 were as a result of the annual impairment assessment of licenses and goodwill performed during the fourth quarter of 2009. The 2008 impairment loss was attributable to the deterioration in the credit and financial markets and the accelerated decline in the overall economy in the fourth quarter of 2008. These factors impacted U.S. Cellular's calculation of the estimated fair value of licenses in the fourth quarter of 2008 through the use of a higher discount rate when projecting future cash flows and lower than previously projected earnings in the wireless industry.
In 2007, $20.8 million of the impairment loss was recognized in conjunction with the exchange of personal communication licenses with Sprint Nextel. Of the remaining 2007 impairment loss, $2.1 million related to other licenses and $1.9 million related to impairments of customer lists.
See the section below entitled, "Application of Critical Accounting Policies and Estimates—Goodwill and Licenses" for a further discussion of the 2009 and 2008 licenses impairments.
Loss on asset disposals, net
These amounts represent charges related to disposals of assets, trade-ins of older assets for replacement assets and other retirements of assets from service. In 2007, U.S. Cellular conducted a physical inventory of its significant cell site and switching assets. As a result, Loss on asset disposals, net included a charge of $14.6 million in 2007 to reflect the results of the physical inventory and related valuation and reconciliation.
TDS operates its wireline operations through TDS Telecom, a wholly owned subsidiary. The following table summarizes operating data for TDS Telecom's ILEC and CLEC operations:
As of December 31,
|
2009 | 2008 | 2007 | ||||||||
|---|---|---|---|---|---|---|---|---|---|---|---|
ILEC |
|||||||||||
Equivalent access lines(1) |
775,900 | 776,700 | 762,700 | ||||||||
Physical access lines(2) |
536,300 | 566,200 | 585,600 | ||||||||
High-speed data customers |
208,300 | 178,300 | 143,800 | ||||||||
Managed IP stations |
1,900 | 600 | — | ||||||||
Long-distance customers |
362,800 | 347,000 | 345,200 | ||||||||
CLEC |
|||||||||||
Equivalent access lines(3) |
355,900 | 393,000 | 435,000 | ||||||||
High-speed data customers |
36,900 | 40,800 | 43,900 | ||||||||
Managed IP stations |
12,000 | 2,100 | — | ||||||||
Full-time equivalent TDS Telecom employees |
2,547 |
2,703 |
2,703 |
||||||||
| (1) | In 2009 and 2008, TDS Telecom acquired 8,200 and 18,400 equivalent access lines, respectively, in ILEC acquisitions. |
| (2) | In 2009 and 2008, TDS Telecom acquired 6,300 and 14,600 physical access lines, respectively, in ILEC acquisitions. |
| (3) | The decline in 2009 and 2008 is primarily the result of a shift in marketing focus from residential and commercial customers to commercial customers. |
TDS Telecom
Components of Operating Income
Year Ended December 31,
|
2009 | Increase/ (Decrease) |
Percentage Change |
2008 | Increase/ (Decrease) |
Percentage Change |
2007 | |||||||||||||||||
|---|---|---|---|---|---|---|---|---|---|---|---|---|---|---|---|---|---|---|---|---|---|---|---|---|
| |
(Dollars in thousands) |
|||||||||||||||||||||||
Operating revenues |
||||||||||||||||||||||||
ILEC revenues |
$ | 599,527 | $ | (11,507 | ) | (2 | )% | $ | 611,034 | $ | (18,949 | ) | (3 | )% | $ | 629,983 | ||||||||
CLEC revenues |
199,375 | (20,627 | ) | (9 | )% | 220,002 | (16,527 | ) | (7 | )% | 236,529 | |||||||||||||
Intra-company elimination |
(9,050 | ) | (2,296 | ) | (34 | )% | (6,754 | ) | (453 | ) | (7 | )% | (6,301 | ) | ||||||||||
TDS Telecom operating revenues |
789,852 | (34,430 | ) | (4 | )% | 824,282 | (35,929 | ) | (4 | )% | 860,211 | |||||||||||||
Operating expenses |
||||||||||||||||||||||||
ILEC expenses |
510,142 | 23,669 | 5 | % | 486,473 | (16,120 | ) | (3 | )% | 502,593 | ||||||||||||||
CLEC expenses |
196,195 | (6,124 | ) | (3 | )% | 202,319 | (20,398 | ) | (9 | )% | 222,717 | |||||||||||||
Intra-company elimination |
(9,050 | ) | (2,296 | ) | (34 | )% | (6,754 | ) | (453 | ) | (7 | )% | (6,301 | ) | ||||||||||
TDS Telecom operating expenses |
697,287 | 15,249 | 2 | % | 682,038 | (36,971 | ) | (5 | )% | 719,009 | ||||||||||||||
TDS Telecom operating income |
$ | 92,565 | $ | (49,679 | ) | (35 | )% | $ | 142,244 | $ | 1,042 | 1 | % | $ | 141,202 | |||||||||
ILEC Operations
Components of Operating Income
Year Ended December 31,
|
2009 | Increase/ (Decrease) |
Percentage Change |
2008 | Increase/ (Decrease) |
Percentage Change |
2007 | |||||||||||||||
|---|---|---|---|---|---|---|---|---|---|---|---|---|---|---|---|---|---|---|---|---|---|---|
| |
(Dollars in thousands) |
|||||||||||||||||||||
Operating revenues |
||||||||||||||||||||||
Voice revenues |
$ | 187,223 | $ | (16,149 | ) | (8 | )% | $ | 203,372 | $ | (15,516 | ) | (7 | )% | $ | 218,888 | ||||||
Data revenues |
103,682 | 13,623 | 15 | % | 90,059 | 17,041 | 23 | % | 73,018 | |||||||||||||
Network access revenues |
271,276 | (7,208 | ) | (3 | )% | 278,484 | (22,803 | ) | (8 | )% | 301,287 | |||||||||||
Miscellaneous revenues |
37,346 | (1,773 | ) | (5 | )% | 39,119 | 2,329 | 6 | % | 36,790 | ||||||||||||
Total operating revenues |
599,527 | (11,507 | ) | (2 | )% | 611,034 | (18,949 | ) | (3 | )% | 629,983 | |||||||||||
Operating expenses |
||||||||||||||||||||||
Cost of services and products (excluding depreciation, amortization and accretion reported below) |
194,030 | 9,745 | 5 | % | 184,285 | (9,476 | ) | (5 | )% | 193,761 | ||||||||||||
Selling, general and administrative expenses |
171,250 | 4,463 | 3 | % | 166,787 | (8,605 | ) | (5 | )% | 175,392 | ||||||||||||
Depreciation, amortization and accretion |
142,913 | 7,978 | 6 | % | 134,935 | 1,495 | 1 | % | 133,440 | |||||||||||||
Loss on asset disposals, net |
1,949 | 1,483 | >100 | % | 466 | 466 | N/M | — | ||||||||||||||
Total operating expenses |
510,142 | 23,669 | 5 | % | 486,473 | (16,120 | ) | (3 | )% | 502,593 | ||||||||||||
Total operating income |
$ | 89,385 | $ | (35,176 | ) | (28 | )% | $ | 124,561 | $ | (2,829 | ) | (2 | )% | $ | 127,390 | ||||||
N/M—Percentage change not meaningful
Operating Revenues
Voice revenues (charges for the provision of local telephone exchange service and reselling long-distance service).
The decreases in Voice revenues in 2009 and 2008 were driven by successive declines in the average physical access lines served of 6% and 5%, which negatively impacted local service revenues by $10.6 million and $9.1 million, respectively. Second line disconnections accounted for 15% of the physical access line decline in 2009 and 28% in 2008 and in both years were significantly influenced by subscribers converting to digital subscriber line ("DSL") service. Additionally, local service and long-distance revenues decreased $9.9 million and $5.8 million in 2009 and 2008, respectively, due to discounts attributed to bundled offerings, which encourage customers to take multiple products such as local service, long-distance, advanced calling features and voice messaging services at a reduced price.
Acquisitions added $2.6 million and $1.3 million to Voice revenues in 2009 and 2008, respectively.
Data revenues (charges for providing Internet and other data related services).
The growth in Data revenues in 2009 and in 2008 was primarily due to the growth in average DSL customers which grew by 18% and 27% in 2009 and 2008, respectively. These additional customers resulted in increased revenues of $13.7 million in 2009 and $14.9 million in 2008. Customers converting to higher DSL speeds drove the average revenue per customer higher, increasing revenues, net of bundling discounts, by $0.9 million and $4.2 million in 2009 and 2008 respectively. Increase in usage of other data products increased revenues by $1.6 million in 2009 and $2.0 million in 2008. These increases were partially offset by decreases in dial-up Internet revenue of $4.0 million and $2.5 million in 2009 and 2008, respectively, due to lower average number of subscribers partially offset by higher rates.
Acquisitions added $1.4 million and $0.5 million to Data revenues in 2009 and 2008, respectively.
Network access revenues (compensation from other telecommunication carriers for carrying long-distance traffic on TDS Telecom's local telephone network and for local interconnection).
Network access revenues decreased $7.0 million in 2009 and $11.3 million in 2008 due to declines in intra-state minutes of use of 12% and 17%, respectively. A reduction in expenses recoverable through the interstate pools also reduced access revenues by $1.6 million in 2009 and $3.4 million in 2008. Revenues from special access circuits also declined $3.0 million in 2009 due to customers choosing lower cost alternatives. Lower interstate usage also lowered 2009 access revenues by $1.9 million. Partially offsetting the decline for 2009 was the settlement of the National Exchange Carrier Association's interstate revenue pool for the years 2003 through 2006, which contributed $1.7 million to the 2009 revenues. In addition, TDS Telecom's election in July of 2007 to exit certain national network access pools resulted in an additional $4.1 million reduction in access revenues in 2008. The decision to exit these pools correspondingly reduced operating expenses by $7.8 million in 2008, and resulted in a positive impact on operating income of $3.7 million in 2008.
Acquisitions added $5.3 million and $1.9 million to Access revenues in 2009 and 2008, respectively.
Miscellaneous revenues (charges for leasing, selling, installing and maintaining customer premise equipment, providing billing and collection services, and selling direct broadcast satellite service as well as other miscellaneous services).
Miscellaneous revenues are down primarily due to a decline in business systems sales. Acquisitions added $0.9 million and $0.5 million to Miscellaneous revenues in 2009 and 2008, respectively.
Operating Expenses
Cost of services and products
The increase in Cost of services and products in 2009 was primarily driven by the increased offering of incentives to attract new customers of $3.0 million and increased circuit bandwidth to support the growth in high-speed data products of $4.9 million. Higher employee related costs also contributed $1.4 million (including the impacts of severance and employee compensation modifications) to the increase. Cost of goods sold related to business systems sales decreased $1.6 million.
The reduction in cost of services and products expense in 2008 was primarily due to TDS Telecom's election to exit certain national network access pools in July 2007. As noted above under "Network access revenues," this decision decreased revenues by $4.1 million in 2008, while also reducing contributions to the pool by $7.8 million, resulting in a positive impact on operating income of $3.7 million. Additionally, the discontinuance of the accounting for regulatory enterprises prescribed by FASB Accounting Standards Codification 980 Regulated Operations ("FASB ASC 980") decreased costs by $1.0 million from 2007 to 2008. Under FASB ASC 980, telecommunications companies were required to recognize expenses associated with customer activation as incurred. Upon discontinuance of FASB ASC 980, costs associated with customer activation are required to be deferred and recognized over the estimated life of the subscriber.
Acquisitions added $3.5 million and $1.3 million to Cost of services and products in 2009 and 2008, respectively.
Selling, general and administrative expenses
The increase in Selling, general and administrative expenses in 2009 was primarily due to an increase in legal, sales and excise tax expenses arising from discrete matters totaling $3.1 million and severance of $1.8 million as a result of workforce reduction. Partially offsetting these charges were discrete events related to employee compensation modifications which reduced expenses $2.0 million. Also partially offsetting these increases were decreases in property taxes of $1.6 million, as well as a reduction in bad debts expense of $1.1 million.
The decrease in 2008 was primarily related to a reduction in payroll related costs of $8.2 million as well as other cost reduction efforts of $3.6 million. Partially offsetting these decreases was an increase in bad debt expense of $3.2 million caused by the reclassification of bad debts expense from miscellaneous revenues (where it was shown as a reduction in revenues) to an increase in Selling, general and administrative expense, as a result of the discontinuance of the application of FASB ASC 980 in the third quarter of 2007.
Acquisitions added $2.8 million and $1.0 million to Selling, general and administrative expense in 2009 and 2008, respectively.
Depreciation, amortization and accretion expense
ILEC acquisitions increased depreciation, amortization and accretion expense $4.5 million and $1.6 million in 2009 and 2008, respectively.
CLEC Operations
Components of Operating Income
Year Ended December 31,
|
2009 | Increase/ (Decrease) |
Percentage Change |
2008 | Increase/ (Decrease) |
Percentage Change |
2007 | |||||||||||||||
|---|---|---|---|---|---|---|---|---|---|---|---|---|---|---|---|---|---|---|---|---|---|---|
| |
(Dollars in thousands) |
|||||||||||||||||||||
Retail revenues |
$ | 178,611 | $ | (18,286 | ) | (9 | )% | $ | 196,897 | $ | (12,235 | ) | (6 | )% | $ | 209,132 | ||||||
Wholesale revenues |
20,764 | (2,341 | ) | (10 | )% | 23,105 | (4,292 | ) | (16 | )% | 27,397 | |||||||||||
Total operating revenues |
199,375 | (20,627 | ) | (9 | )% | 220,002 | (16,527 | ) | (7 | )% | 236,529 | |||||||||||
Cost of services and products (excluding depreciation, amortization and accretion reported below) |
104,057 |
(5,400 |
) |
(5 |
)% |
109,457 |
(7,155 |
) |
(6 |
)% |
116,612 |
|||||||||||
Selling, general and administrative expenses |
67,283 | (1,757 | ) | (3 | )% | 69,040 | (13,043 | ) | (16 | )% | 82,083 | |||||||||||
Depreciation, amortization and accretion |
24,403 | 972 | 4 | % | 23,431 | (591 | ) | (2 | )% | 24,022 | ||||||||||||
Loss on asset disposals, net |
452 | 61 | 16 | % | 391 | 391 | N/M | — | ||||||||||||||
Total operating expenses |
196,195 | (6,124 | ) | (3 | )% | 202,319 | (20,398 | ) | (9 | )% | 222,717 | |||||||||||
Total operating income |
$ | 3,180 | $ | (14,503 | ) | (82 | )% | $ | 17,683 | $ | 3,871 | 28 | % | $ | 13,812 | |||||||
N/M—Percentage change not meaningful
Prior
years amounts have been reclassified to conform to current year presentation.
Operating Revenues
Retail revenues (charges to CLEC customers for the provision of direct telecommunication services).
Average CLEC equivalent access lines in service decreased 10% in 2009 and 8% in 2008, which resulted in decreases in Retail revenues of $19.4 million and $15.4 million, respectively. Average residential equivalent access lines decreased 26% in 2009 and 21% in 2008 as the CLEC operation continues to implement its strategic shift towards serving primarily a commercial subscriber base. The average equivalent access lines related to commercial customers declined 4% and 1% for the same periods. Average revenue per subscriber increased in both 2009 and 2008 resulting in higher revenues of $1.1 million and $3.5 million, respectively.
Wholesale revenues (charges to other carriers for utilizing TDS Telecom's network infrastructure).
The decline in Wholesale revenues in 2009 was primarily driven by a 27% reduction in minutes of use partially offset by an increase in average rates resulting from a more favorable mixture of traffic carried. The decline in Wholesale revenues in 2008 was similarly driven by a 22% reduction in minutes of use.
Operating Expenses
Cost of services and products
Cost of services decreased by $7.0 million and $3.3 million in 2009 and 2008, respectively, primarily due to reductions in purchased network services, which have been driven by the decline in the residential customer base. The decrease in 2009 was partially offset by additional expenses of $1.6 million associated with the provisioning of managed Internet Protocol service to customers. Settlements with two inter-exchange carriers related to the pricing of certain services also reduced the cost of services in 2008 by $2.4 million. Additionally, lower circuit expenses primarily due to improvements made in the CLEC's network design decreased 2008 expenses by $1.1 million.
Selling, general and administrative expenses
Selling, general and administrative expenses decreased in 2009 due primarily to decreased Universal Service Fund contribution expense of $1.3 million caused by the decreased customer base. Decreases in bad debts contributed an additional $0.6 million of cost reduction.
The decrease in 2008 was primarily due to cost containment efforts, primarily a reduction in payroll costs, which reduced expenses by $7.9 million in 2008. Also, residential advertising expense decreased $3.1 million as TDS Telecom realigned its expenditures to focus mainly on its commercial markets. In addition, a restructuring of commission compensation decreased expenses $2.0 million.
Depreciation, amortization and accretion
Depreciation, amortization and accretion expense increased $1.0 million during 2009 primarily due to accelerated depreciation expense on certain circuit equipment due to technological obsolescence.
Management believes that inflation affects TDS' business to no greater or lesser extent than the general economy.
In general, recent accounting pronouncements did not have and are not expected to have a significant effect on TDS' financial condition and results of operations.
See Note 1—Summary of Significant Accounting Policies and Recent Accounting Pronouncements in the Notes to Consolidated Financial Statements for information on recent accounting pronouncements.
TDS operates a capital- and marketing-intensive business. TDS utilizes cash from its operating activities, cash proceeds from divestitures and disposition of investments, short-term credit facilities, long-term debt financing and cash on hand to fund its acquisitions (including licenses), construction costs, operating expenses and share repurchases. Cash flows may fluctuate from quarter to quarter and year to year due to seasonality, the timing of acquisitions, capital expenditures and other factors. The table below and the following discussion in this Financial Resources section summarize TDS' cash flow activities in 2009, 2008 and 2007.
| |
2009 | 2008 | 2007 | ||||||||
|---|---|---|---|---|---|---|---|---|---|---|---|
| |
(Dollars in thousands) |
||||||||||
Cash flows from (used in) |
|||||||||||
Operating activities |
$ | 1,102,594 | $ | 848,892 | $ | 941,032 | |||||
Investing activities |
(781,446 | ) | (902,752 | ) | (627,855 | ) | |||||
Financing activities |
(427,465 | ) | (343,277 | ) | (152,056 | ) | |||||
Net increase (decrease) in cash and cash equivalents |
$ | (106,317 | ) | $ | (397,137 | ) | $ | 161,121 | |||
Cash Flows From Operating Activities
The following table presents operating income before certain non-cash items and is included for purposes of analyzing changes in cash flows from operating activities:
| |
2009 | 2008 | 2007 | ||||||||
|---|---|---|---|---|---|---|---|---|---|---|---|
| |
(Dollars in thousands) |
||||||||||
Operating income |
$ | 407,806 | $ | 128,154 | $ | 527,898 | |||||
Non-cash items |
|||||||||||
Depreciation, amortization and accretion |
749,970 | 750,077 | 748,136 | ||||||||
Loss on impairment of intangible assets |
14,000 | 414,376 | 24,923 | ||||||||
Loss on asset disposals, net |
17,765 | 24,296 | 34,016 | ||||||||
Operating income before certain non-cash items(1) |
$ | 1,189,541 | $ | 1,316,903 | $ | 1,334,973 | |||||
| (1) | Operating income before certain non-cash items is a segment measure reported to the chief operating decision maker for purposes of making decisions about allocating resources to the segments and assessing their performance. TDS believes this measure provides useful information to investors regarding TDS' financial condition and results of operations because it highlights certain key cash and non-cash items and their impacts on cash flows from operating activities. See Note 19—Business Segment Information in the Notes to Consolidated Financial Statements. This amount may also be commonly referred to by management as operating cash flow. |
Cash flows from operating activities in 2009 were $1,102.6 million, an increase of $253.7 million from 2008. Significant changes included the following:
- Operating cash flow, as shown in the table above, decreased by $127.4 million.
- A $417.0 million decrease in income tax payments. Income tax payments, net of refunds, were $53.0 million and $470.0 million in 2009 and 2008, respectively. Income tax payments were higher in 2008 compared to 2009 primarily due to tax gains realized on the disposition of Deutsche Telekom marketable equity securities and related variable prepaid forward contracts during 2008; as well as a year-over-year decrease in forecasted income and an overpayment of income taxes in 2008.
- In 2009, a $38.0 million deposit was paid to the Internal Revenue Service (IRS) to eliminate any potential interest due to the IRS subsequent to the date of the deposit. The deposit was recorded in Change in other assets and liabilities in the Consolidated Statement of Cash Flows in 2009. See Note 4—Income Taxes for additional information.
Cash flows from operating activities in 2008 were $848.9 million, a decrease of $92.1 million from 2007. Significant changes included the following:
- A $160.3 million decrease in interest and dividend income offset by a $70.8 million decrease in interest expense. See "Results of Operations—Consolidated" for an explanation of these changes;
- A $30.9 million decrease in income tax payments. Income tax payments in 2008 and 2007 were $470.0 million and $500.9 million, respectively. The decrease in income tax payments during 2008 was primarily attributable to the timing of the disposition of marketable equity securities and the settlement of variable prepaid forward contracts during 2008 relative to 2007; and
- A $31.0 million decrease in the net cash flow related to Changes in assets and liabilities from operations other than accrued taxes. Such changes in assets and liabilities required cash of $96.1 million in 2008 and $65.1 million in 2007. The most significant change related to inventory which required $17.1 million in 2008 and provided $16.8 million in 2007. The change was attributable to more handsets on hand at December 31, 2008 relative to December 31, 2007, partially as a result of additional retail stores that commenced operations during 2008.
Cash Flows From Investing Activities
TDS makes substantial investments to acquire wireless licenses and properties and to construct, operate and upgrade modern high-quality communications networks and facilities as a basis for creating long-term value for shareholders. In recent years, rapid changes in technology and new opportunities have required substantial investments in potentially revenue-enhancing and cost-reducing upgrades to TDS' networks.
Cash used for property, plant and equipment and system development expenditures totaled $671.2 million in 2009, $734.9 million in 2008 and $699.6 million in 2007. These expenditures were made to provide for customer and usage growth, to upgrade service and to take advantage of service-enhancing and cost-reducing technological developments in order to maintain competitive services.
- U.S. Cellular's capital expenditures totaled $546.8 million in 2009, $585.6 million in 2008 and $565.5 million in 2007 representing expenditures to construct cell sites, increase capacity in existing cell sites and switches, upgrade technology including the overlay of 3G technology in certain markets, develop new and enhance existing office systems, and construct new and remodel existing retail stores.
- TDS Telecom's capital expenditures for its ILEC operations totaled $98.3 million in 2009, $120.9 million in 2008 and $111.8 million in 2007 representing expenditures to upgrade plant and equipment to provide enhanced services. TDS Telecom's capital expenditures for its CLEC operations totaled $22.2 million in 2009, $19.8 million in 2008 and $16.4 million in 2007 for switching and other network facilities; and
- Corporate and other capital expenditures totaled $3.9 million in 2009, $8.6 million in 2008 and $5.9 in 2007.
Acquisitions required cash payments of $29.3 million in 2009, $389.2 million in 2008 and $23.8 million in 2007, respectively, as summarized below:
Cash Payment for Acquisitions(1)
|
2009 | 2008 | 2007 | |||||||
|---|---|---|---|---|---|---|---|---|---|---|
| |
(Dollars in millions) |
|||||||||
Auction 73 licenses(2) |
$ | — | $ | 300.5 | $ | — | ||||
All other U.S. Cellular licenses |
15.8 | 32.3 | 3.2 | |||||||
TDS Telecom ILEC business acquisitions |
13.2 | 47.4 | — | |||||||
U.S. Cellular business acquisitions(3) |
— | 8.9 | 18.3 | |||||||
Other |
0.3 | 0.1 | 2.3 | |||||||
Total |
$ | 29.3 | $ | 389.2 | $ | 23.8 | ||||
| (1) | Cash amounts paid for the acquisitions may differ from the purchase price due to cash acquired in the transactions and working capital adjustments as of December 31 of the respective year. |
| (2) | King Street Wireless L.P., an entity in which a subsidiary of U.S. Cellular is a limited partner with a 90% partnership interest, made these payments. U.S. Cellular loaned these funds to the partnership and the general partner and made direct capital investments to fund the auction payment. |
| (3) | For purposes of presentation in this table, this line item includes the purchase of an entire business or the purchase of additional interests in entities already partially owned by U.S. Cellular. |
TDS realized cash proceeds of $226.6 million in 2008 from the sale of Deutsche Telekom Ordinary Shares offset by $17.4 million in cash payments to settle the collar portion of certain variable prepaid forward contracts related to such shares. TDS settled these variable prepaid forward contracts through both the delivery of Deutsche Telekom Ordinary Shares and cash. In addition, in 2008, TDS realized cash proceeds of $32.4 million from the disposition of Rural Cellular Corporation ("RCC") Common Shares held by TDS in conjunction with Verizon Wireless' acquisition of RCC.
TDS realized cash proceeds of $92.0 million in 2007 related to the sale of VeriSign Inc. Common Shares, a portion of Deutsche Telekom Ordinary Shares and Vodafone American Depository Receipts ("ADRs") in conjunction with the settlements of variable prepaid forward contracts related to such shares. TDS settled these variable prepaid forward contracts through the delivery of a substantial majority of the VeriSign, Deutsche Telekom and Vodafone shares subject to such forward contracts, and then sold the remaining shares subject to these same contracts.
See Note 10—Marketable Equity Securities and Variable Prepaid Forward Contracts in the Notes to Consolidated Financial Statements for additional details on 2008 and 2007 marketable equity securities transactions and variable prepaid forward contract settlements.
TDS invested $109.2 million and $27.4 million in certificates of deposit in 2009 and 2008. No certificates of deposit were purchased in 2007. Cash proceeds of $23.7 million were received in 2009 from redemption of certain certificates of deposit.
Cash Flows From Financing Activities
Cash flows from financing activities primarily reflect issuances and repayments on revolving credit facilities, proceeds from issuance of long-term debt, cash used for repayments of long-term debt, distributions to noncontrolling interests, repurchases of TDS and U.S. Cellular shares, and cash proceeds from reissuance of common shares pursuant to stock-based compensation plans. TDS has used short-term debt to finance acquisitions, to repurchase shares and for other general corporate purposes. Cash flows from operating activities, proceeds from settlements of variable prepaid forward contracts and, from time to time, the sale of non-strategic wireless and other investments have been used to reduce debt.
TDS' payment to settle the debt portion of certain variable prepaid forward contracts related to Deutsche Telekom Ordinary Shares totaled $47.4 million in 2008. All variable prepaid forward contracts were settled in 2008, and TDS did not settle any variable prepaid forward contracts by payment of cash in 2007.
There were no short-term borrowings or repayments during 2009. Borrowings under revolving credit facilities primarily to fund capital expenditures and licenses totaled $100.0 million in 2008 and $25.0 million in 2007, while repayments under the revolving credit facilities totaled $100.0 million in 2008 and $60.0 million in 2007.
In 2009, U.S. Cellular redeemed its outstanding 8.75% senior notes for their principal amount of $130.0 million and retired its 9% installment notes payable in the amount of $10.0 million. There were no redemptions of long-term debt in 2008 or 2007.
The re-issuance of TDS and U.S. Cellular treasury shares in connection with employee benefits plans, net of tax payments made on behalf of stock award holders, provided $0.7 million in 2009, required $0.9 million in 2008 and provided $123.7 million in 2007. In certain situations, TDS and U.S. Cellular withhold shares that are issuable upon the exercise of stock options or the vesting of restricted shares to cover, and with a value equivalent to, the exercise price and/or the amount of taxes required to be withheld from the stock award holder at the time of the exercise or vesting. TDS and U.S. Cellular then pay the amount of the required tax withholdings to the taxing authorities in cash.
In 2009, TDS repurchased Special Common Shares and Common Shares for $176.6 million. In 2008, TDS repurchased Special Common Shares and Common Shares for $199.6 million. A total of $197.7 million was paid in cash before December 31, 2008 and $1.9 million was paid in January 2009. In 2007, TDS repurchased Special Common Shares for $126.7 million.
In 2009, U.S. Cellular repurchased Common Shares at an aggregate cost of $33.6 million. In 2008, U.S. Cellular repurchased Common Shares at an aggregate cost of $32.9 million. U.S. Cellular also received $4.6 million in 2008 from an investment banking firm for the final settlement of Accelerated Share Repurchases ("ASR") made in 2007. In 2007, U.S. Cellular purchased Common Shares for $87.9 million from an investment banking firm in connection with three ASR programs. As discussed above, in 2008, U.S. Cellular received $4.6 million from the investment banking firm in final settlement of the ASR programs; thus, the net cost of Common Shares purchased pursuant to such programs was $83.3 million. See Note 17—Common Stockholders' Equity in the Notes to Consolidated Financial Statements for additional information related to these transactions.
TDS believes that existing cash balances, expected cash flows from operating activities and funds available under its new revolving credit facilities provide substantial liquidity and financial flexibility for TDS to meet its normal financing needs (including working capital, construction and development expenditures and share repurchases under approved programs) for the foreseeable future. In addition, TDS and its subsidiaries may have access to public and private capital markets to help meet their financing needs.
Consumer spending significantly impacts TDS' operations and performance. Factors that influence levels of consumer spending include: unemployment rates, increases in fuel and other energy costs, conditions in residential real estate and mortgage markets, labor and healthcare costs, access to credit, consumer confidence and other macroeconomic factors. Changes in these and other economic factors could have a material adverse effect on demand for TDS' products and services and on TDS' financial condition and results of operations.
TDS cannot provide assurances that circumstances that could have a material adverse affect on its liquidity or capital resources will not occur. Economic conditions, changes in financial markets or other factors could restrict its liquidity and availability of financing on terms and prices acceptable to TDS, which could require TDS to reduce its construction, development, acquisition or share repurchase programs. Such reductions could have a material adverse effect on TDS' business, financial condition or results of operations.
Cash and Cash Equivalents
At December 31, 2009, TDS had $671.0 million in cash and cash equivalents, which include cash and short-term, highly liquid investments with original maturities of three months or less. The primary objective of TDS' cash and cash equivalents investment activities is to preserve principal. At December 31, 2009, TDS invested substantially all of its cash balances in money market funds that invested exclusively in short-term U.S. Treasury securities or repurchase agreements backed by U.S. Treasury securities. TDS monitors the financial viability of the money market funds in which it invests and believes that the credit risk associated with these investments is low.
Short-Term Investments
As of December 31, 2009 and 2008, TDS held certificates of deposit totaling $113.3 million and $27.7 million, respectively, which were included in Short-term investments in the Consolidated Balance Sheet. At December 31, 2009, these certificates of deposit had original maturities of between 120 days and one year on the dates TDS acquired these certificates of deposit and earn interest at annual rates between 0.50% and 1.75%.
Revolving Credit Facilities
TDS and U.S. Cellular have revolving credit facilities available for general corporate purposes. On June 30, 2009, TDS entered into a new $400 million revolving credit agreement with certain lenders and other parties and U.S. Cellular entered into a new $300 million revolving credit agreement with certain lenders and other parties. At December 31, 2009, there were no outstanding borrowings and $3.4 million of outstanding letters of credit, leaving $396.6 million available for use under the TDS revolving credit facility, and there were no outstanding borrowings and $0.2 million of outstanding letters of credit, leaving $299.8 million available for use under the U.S. Cellular revolving credit facility. In connection with U.S. Cellular's new revolving credit facility, TDS and U.S. Cellular entered into a subordination agreement dated June 30, 2009 together with the administrative agent for the lenders under U.S. Cellular's new revolving credit facility. At December 31, 2009, no U.S. Cellular debt was subordinated pursuant to this subordination agreement. See Note 14—Debt in the Notes to Consolidated Financial Statements for the details of these revolving credit facilities and the subordination agreement.
TDS' and U.S. Cellular's interest cost on their new revolving credit facilities is subject to increase if their current credit ratings from Standard & Poor's Rating Services, Moody's Investors Service and/or Fitch Ratings are lowered and is subject to decrease if the ratings are raised. The new credit facilities would not cease to be available nor would the maturity date accelerate solely as a result of a downgrade in TDS' or U.S. Cellular's credit rating. However, a downgrade in TDS' or U.S. Cellular's credit rating could adversely affect their ability to renew the new credit facilities or obtain access to other credit facilities in the future.
TDS' and U.S. Cellular's credit ratings as of December 31, 2009, and the dates that such ratings were issued/re-affirmed were as follows:
| Moody's (re-affirmed September 21, 2009) | Baa2 | —stable outlook | ||
| Standard & Poor's (re-affirmed September 18, 2009) | BBB- | —positive outlook | ||
| Fitch Ratings (issued August 20, 2009) | BBB+ | —negative outlook |
The continued availability of the new revolving credit facilities requires TDS and U.S. Cellular to comply with certain negative and affirmative covenants, maintain certain financial ratios and make representations regarding certain matters at the time of each borrowing. TDS and U.S. Cellular believe they were in compliance as of December 31, 2009 with all covenants and requirements set forth in their new revolving credit facilities.
Long-Term Financing
TDS and its subsidiaries' long-term debt and indentures do not contain any provisions resulting in acceleration of the maturities of outstanding debt in the event of a change in TDS' credit rating. However, a downgrade in TDS' credit rating could adversely affect its ability to obtain long-term debt financing in the future. TDS believes it and its subsidiaries were in compliance as of December 31, 2009 with all covenants and other requirements set forth in long-term debt indentures. TDS and U.S. Cellular have not failed to make nor do they expect to fail to make any scheduled payment of principal or interest under such indentures.
The long-term debt principal payments due for the next five years represent less than 1% of the total long-term debt obligation at December 31, 2009. Refer to the section Market Risk—Long-Term Debt for additional information regarding required principal payments and the weighted average interest rates related to TDS' long-term debt.
TDS, at its discretion, may from time to time seek to retire or purchase its outstanding debt through cash purchases and/or exchanges for other securities, in open market purchases, privately negotiated transactions, tender offers, exchange offers or otherwise. Such repurchases or exchanges, if any, will depend on prevailing market conditions, liquidity requirements, contractual restrictions and other factors. The amounts involved may be material.
In December 2009, U.S. Cellular redeemed in whole its $130.0 million senior notes which carried an interest rate of 8.75%. These notes were scheduled to mature in 2032.
Capital Expenditures
U.S. Cellular's capital expenditures for 2010 are expected to be approximately $600 million. These expenditures are expected to be for the following general purposes:
- Expand and enhance U.S. Cellular's coverage in its service areas;
- Provide additional capacity to accommodate increased network usage by current customers;
- Overlay 3G technology in certain markets;
- Enhance U.S. Cellular's retail store network;
- Develop and enhance office systems; and
- Develop new billing and other customer management related systems and platforms.
TDS Telecom's anticipated capital expenditures for 2010 are expected to be approximately $140 million to upgrade plant and equipment to provide enhanced services.
TDS plans to finance its construction program for 2010 using cash flows from operating activities, existing cash balances, and, if necessary, short-term debt.
Suppliers
TDS depends upon certain key suppliers to provide it with handsets, equipment, services or content to continue its network build and upgrade and to operate its business. TDS does not have operational or financial control over any of such key suppliers and has limited influence with respect to the manner in which these key suppliers conduct their businesses. If these key suppliers experience financial difficulties and are unable to provide equipment, services or content to TDS on a timely basis or cease to provide such equipment, services or content or if such key suppliers otherwise fail to honor their obligations to TDS, TDS may be unable to maintain and upgrade its network or provide services to its customers in a competitive manner, or could suffer other disruptions to its business. In that event, TDS' business, financial condition or results of operations could be adversely affected. TDS monitors the financial condition of its key suppliers through its risk management process.
Acquisitions, Divestitures and Exchanges
TDS assesses its existing wireless and wireline interests on an ongoing basis with a goal of improving the competitiveness of its operations and maximizing its long-term return on investment. As part of this strategy, TDS reviews attractive opportunities to acquire additional wireless operating markets, telecommunications companies, wireless spectrum and related service businesses. In addition, TDS may seek to divest outright or include in exchanges for other wireless interests those wireless interests that are not strategic to its long-term success. TDS also from time to time may be engaged in negotiations relating to the acquisition, divestiture or exchange of companies, strategic properties or wireless spectrum. In general, TDS may not disclose such transactions until there is a definitive agreement. See Note 8—Acquisitions, Divestitures and Exchanges in the Notes to Consolidated Financial Statements for details on significant transactions in 2009, 2008 and 2007.
Variable Interest Entities
TDS consolidates certain entities because they are "variable interest entities" under accounting principles generally accepted in the United States of America ("GAAP"). See Note 6—Variable Interest Entities in the Notes to Consolidated Financial Statements for the details of these variable interest entities. TDS may elect to make additional capital contributions and/or advances to these variable interest entities in future periods in order to fund their operations.
Share Repurchase Programs
TDS and U.S. Cellular have repurchased and expect to continue to repurchase their Special Common Shares (TDS only) and Common Shares, subject to repurchase programs. For additional information related to the current TDS and U.S. Cellular repurchase authorizations and repurchases made during 2009, 2008 and 2007, see Note 17—Common Stockholders Equity in the Notes to Consolidated Financial Statements.
Contractual and Other Obligations
At December 31, 2009, the resources required for contractual obligations were as follows:
| |
Payments Due by Period | |||||||||||||||
|---|---|---|---|---|---|---|---|---|---|---|---|---|---|---|---|---|
| |
Total | Less than 1 Year |
2 - 3 Years | 4 - 5 Years | More than 5 Years |
|||||||||||
| |
(Dollars in millions) |
|||||||||||||||
Long-term debt obligations(1) |
$ | 1,501.2 | $ | 2.2 | $ | 5.9 | $ | 0.1 | $ | 1,493.0 | ||||||
Interest payments on long-term debt obligations |
2,967.1 | 107.3 | 214.5 | 213.9 | 2,431.4 | |||||||||||
Operating leases(2) |
1,100.2 | 148.0 | 237.2 | 148.9 | 566.1 | |||||||||||
Capital leases |
9.6 | 0.8 | 1.5 | 1.1 | 6.2 | |||||||||||
Purchase obligations(3) |
777.8 | 451.8 | 206.8 | 79.4 | 39.8 | |||||||||||
|
$ | 6,355.9 | $ | 710.1 | $ | 665.9 | $ | 443.4 | $ | 4,536.5 | ||||||
| (1) | Includes current and long-term portions of debt obligations. The total long-term debt obligation differs from Long-term debt on the Consolidated Balance Sheet due to the $10.8 million unamortized discount related to U.S. Cellular's 6.7% senior notes and capital leases. See Note 14—Debt in the Notes to Consolidated Financial Statements. |
| (2) | Represents the amounts due under non-cancellable long-term operating leases for the periods specified. See Note 16—Commitments and Contingencies in the Notes to Consolidated Financial Statements. |
| (3) | Includes obligations payable under non-cancellable contracts, commitments for network facilities and services, agreements for software licensing and long-term marketing programs. |
The table above does not include any liabilities related to "unrecognized tax benefits" as defined by GAAP because TDS is unable to predict the period of settlement of such liabilities. Such unrecognized tax benefits were $45.0 million at December 31, 2009. See Note 4—Income Taxes in the Notes to Consolidated Financial Statements for additional information on unrecognized tax benefits.
Off-Balance Sheet Arrangements
TDS has no transactions, agreements or other contractual arrangements with unconsolidated entities involving "off-balance sheet arrangements," as defined by Securities and Exchange Commission rules, that have or are reasonably likely to have a material current or future effect on its financial condition, changes in financial condition, revenues or expenses, results of operations, liquidity, capital expenditures or capital resources.
Insurance
TDS has several commercial property and casualty insurance policies with a variety of subsidiary companies of American International Group, Inc. ("AIG"). These companies operate under the insurance regulations of various states including New York, Pennsylvania and Delaware. TDS has inquired into the ability of these AIG companies to meet their obligations in the event of a claim against these policies and has received assurance from AIG and TDS' insurance brokers that the companies remain able to meet these obligations. State insurance regulators and the rating agencies have issued press releases indicating the same. TDS did not have any significant property and casualty claims outstanding with these companies as of December 31, 2009. TDS continues to monitor the financial condition of these and other insurance providers.
Dividends
TDS paid quarterly dividends per share of $0.1075 in 2009, $0.1025 in 2008 and $0.0975 in 2007. TDS increased the dividend per share to $0.1125 in the first quarter of 2010. TDS has no current plans to change its policy of paying dividends.
TDS prepares its consolidated financial statements in accordance with accounting principles generally accepted in the United States of America ("GAAP"). TDS' significant accounting policies are discussed in detail in Note 1—Summary of Significant Accounting Policies and Recent Accounting Pronouncements in the Notes to Consolidated Financial Statements.
Management believes the application of the following critical accounting policies and the estimates required by such application reflect its most significant judgments and estimates used in the preparation of TDS' consolidated financial statements. Management has discussed the development and selection of each of the following accounting policies and related estimates and disclosures with the Audit Committee of TDS' Board of Directors.
Goodwill and Licenses
As of December 31, 2009, the carrying values of TDS' goodwill and licenses were $707.8 million and $1,443.0 million, respectively. Licenses include those won by Carroll Wireless, Barat Wireless, King Street Wireless and Aquinas Wireless in various FCC auctions, as discussed in Note 6—Variable Interest Entities in the Notes to Consolidated Financial Statements.
See Note 9—Licenses and Goodwill in the Notes to Consolidated Financial Statements for additional information related to goodwill and licenses activity in 2009 and 2008.
Goodwill and licenses must be assessed for impairment annually or more frequently if events or changes in circumstances indicate that such assets might be impaired.
The impairment test for goodwill is a two-step process. The first step compares the fair value of the reporting unit as identified to its carrying value. If the carrying amount exceeds the fair value, the second step of the test is performed to measure the amount of impairment loss, if any. The second step compares the implied fair value of reporting unit goodwill with the carrying amount of that goodwill. To calculate the implied fair value of goodwill in this second step, an enterprise allocates the fair value of the reporting unit to all of the assets and liabilities of that reporting unit (including any unrecognized intangible assets) as if the reporting unit had been acquired in a business combination and the fair value was the price paid to acquire the reporting unit. The excess of the fair value of the reporting unit over the amount assigned to the assets and liabilities of the reporting unit represents the implied fair value of goodwill. If the carrying amount of goodwill exceeds the implied fair value of goodwill, an impairment loss is recognized for that difference.
The impairment test for an intangible asset other than goodwill consists of comparing the fair value of the intangible asset to its carrying amount. If the carrying amount exceeds the fair value, an impairment loss is recognized for the difference.
Quoted market prices in active markets are the best evidence of fair value of an asset or reporting unit and are used when available. If quoted market prices are not available, the estimate of fair value is based on the best information available, including prices for similar assets and the use of other valuation techniques. Other valuation techniques include present value analysis, multiples of earnings or revenues, or similar performance measures. The use of these techniques involves assumptions by management about factors that are uncertain including future cash flows, the appropriate discount rate and other inputs. Different assumptions for these inputs could create materially different results.
As discussed below, TDS completed its required annual impairment assessment of goodwill and licenses for 2009 as of November 1. In connection with that assessment, TDS determined that no impairment existed related to goodwill, and recognized an impairment loss in the amount of $14.0 million related to licenses. There can be no assurance that upon review at a later date material impairment charges will not be required.
Historically, TDS completed the required annual impairment assessment of its licenses and goodwill in the second quarter of each year. Effective April 1, 2009, TDS adopted a new accounting policy whereby its annual impairment review of goodwill and indefinite-lived intangible assets will be performed as of November 1 instead of the second quarter of each year, as discussed in Note 1—Summary of Significant Accounting Policies and Recent Accounting Pronouncements in the Notes to Consolidated Financial Statements. Accordingly, TDS performed its annual impairment test for 2009 as of November 1, 2009 whereas its annual impairment test for 2008 was performed in the second quarter. In 2008, however, as a result of deterioration in the credit and financial markets and the accelerated decline in the overall economy in the fourth quarter of 2008, TDS performed another impairment assessment of licenses and goodwill as of December 31, 2008. Accordingly, the following discussion compares the impairment test as of November 1, 2009 to December 31, 2008.
Goodwill
U.S. Cellular
U.S. Cellular tests goodwill for impairment at the level of reporting referred to as a "reporting unit." For purposes of impairment testing of goodwill in 2009, U.S. Cellular identified five reporting units based on geographic service areas. There were no changes to U.S. Cellular's reporting units, the allocation of goodwill to U.S. Cellular's reporting units, or to U.S. Cellular's overall goodwill impairment testing methodology between its two most recent impairment testing dates, November 1, 2009 and December 31, 2008.
A discounted cash flow approach was used to value each reporting unit, using value drivers and risks specific to the current industry and economic markets. The cash flow estimates incorporated assumptions that market participants would use in their estimates of fair value. Key assumptions made in this process were the revenue growth rate, discount rate, and projected capital expenditures. These assumptions were as follows as of the two most recent impairment testing dates:
Key assumptions
|
November 1, 2009 |
December 31, 2008 |
|||||
|---|---|---|---|---|---|---|---|
Weighted-average expected revenue growth rate (next four years) |
2.13 | % | 2.69 | % | |||
Weighted-average long-term and terminal revenue growth rate (after year four) |
2.00 | % | 2.00 | % | |||
Discount rate |
11.50 | % | 10.50 | % | |||
Average annual capital expenditures (millions) |
$ | 520 | $ | 556 | |||
The increase in the discount rate between December 31, 2008 and November 1, 2009 was primarily a result of the company-specific risk premium ("CSRP") applied to the cost of equity calculation. The selection of the higher CSRP was based on a variety of factors including the risks associated with the underlying projections relative to the market and the specific risk factors facing U.S. Cellular such as the highly concentrated and competitive nature of the market. U.S. Cellular believes a market participant would include this CSRP when estimating the discount rate.
As of November 1, 2009, the fair values of the reporting units exceeded their respective carrying values by amounts ranging from 41% to 101% of the respective carrying values. Therefore, no impairment of goodwill existed. Given that the fair values of the respective reporting units significantly exceeded their respective carrying values, the terminal growth rate assumptions would need to decrease to negative amounts, ranging from negative 24% to negative 135%, in order to yield estimated fair values equal to the carrying values of the respective reporting units at November 1, 2009.
The carrying value of each U.S. Cellular reporting unit as of December 31, 2009 was as follows:
Reporting unit
|
Carrying value |
|||
|---|---|---|---|---|
| |
(Dollars in millions) |
|||
Central Region |
$ | 1,094 | ||
Mid-Atlantic Region |
677 | |||
New England Region |
222 | |||
New York Region |
126 | |||
Northwest Region |
318 | |||
Total |
$ | 2,437 | ||
TDS Telecom
TDS Telecom has three reporting units: ILEC and CLEC (Metrocom and Metrocom Minnesota). The CLEC reporting units do not have any goodwill allocated to them due to a write-off of all remaining goodwill in 2004. TDS Telecom's ILEC reporting unit has recorded goodwill primarily as a result of the acquisition of operating telephone companies. There were no changes to TDS Telecom's reporting units, the allocation of goodwill to TDS Telecom's ILEC reporting unit, or to TDS Telecom's overall goodwill impairment testing assumptions or methodology during 2009 or 2008.
For the purposes of impairment testing, the publicly-traded guideline company method and the recent transaction method were utilized. The publicly-traded guideline company method develops an indication of fair value by calculating average market pricing multiples for selected publicly-traded companies using multiples of revenue, EBITDA (earnings before interest, taxes, depreciation and amortization), EBITDA less capital expenditures, and access lines. The recent transaction method calculates market pricing multiples based upon recent acquisitions of similar businesses. In both methods, the developed multiples were applied to the appropriate financial measure of TDS Telecom's ILEC reporting unit to determine the reporting unit's fair value. Given the nature of this methodology, no specific consideration of the economic environment was considered since those factors would be implicit in the multiples used. As of November 1, 2009, the fair value of TDS Telecom's ILEC reporting unit exceeded its carrying value by 41%.
Licenses
U.S. Cellular tests licenses for impairment at the level of reporting referred to as a "unit of accounting." For purposes of its impairment testing of licenses as of December 31, 2008 and November 1, 2009, U.S. Cellular separated its FCC licenses into eighteen units of accounting based on geographic service areas. Thirteen of these eighteen units of accounting represented geographic groupings of licenses which, because they were not being utilized and, therefore, were not expected to generate cash flows from operating activities in the foreseeable future, were considered separate units of accounting for purposes of impairment testing.
Developed operating market licenses ("built licenses")
As indicated in Note 1—Summary of Significant Accounting Policies and Recent Accounting Pronouncements—Goodwill and Licenses Impairment Assessment, in 2009 U.S. Cellular changed its method of estimating the fair value of built licenses for purposes of impairment testing from the multiple period excess cash flow method ("MPECF method") to the build-out method. U.S. Cellular elected to make this change as the build-out method is a more widely used and accepted valuation method in estimating the fair value of licenses for purposes of impairment testing in the wireless industry. U.S. Cellular does not believe the build-out method yields a significantly different estimate of the fair value of licenses than the MPECF method.
Significant assumptions within the build-out method include the hypothetical build-out period, discount rate, long-term EBITDA margin, penetration rate, revenue growth rate, new subscriber costs, and capital expenditure and maintenance requirements. The penetration rate, revenue growth rate, new subscriber costs, and capital expenditure and maintenance requirements varied among the different units of accounting and between years within the forecast periods. The following key assumptions were applied consistently across all units of accounting for purposes of the November 1, 2009 licenses impairment assessment:
Key assumptions
|
|
|
|---|---|---|
Build-out period |
7 years | |
Discount rate |
10.0% | |
Long-term EBITDA margin |
32.7% |
The discount rate used in the license valuation is less than the discount rate used in the valuation of reporting units for purposes of goodwill impairment testing due to reduced risk. Specifically, from a market participant perspective, the risks inherent in owning a specific wireless license are less than those associated with owning and operating an entire wireless business.
The discount rate is the most significant assumption in both the MPECF method and the build-out method. The discount rate is estimated based on the overall risk-free interest rate adjusted for industry participant information, such as a typical capital structure (i.e., debt-equity ratio), the after-tax cost of debt and the cost of equity. The cost of equity takes into consideration the average risk specific to individual market participants and the specific risk to U.S. Cellular. The discount rates used for the licenses impairment tests at December 31, 2008 (under the MPECF method) and November 1, 2009 (under the build-out method) were 9.5% and 10.0%, respectively. The increase in the discount rate between these two dates was primarily a result of the company-specific risk premium ("CSRP") applied to the cost of equity calculation. The selection of the higher CSRP was based on a variety of specific risk factors facing U.S. Cellular including the risks associated with the underlying projections relative to the market, and the highly concentrated and competitive nature of the market.
The results of the licenses impairment test at November 1, 2009 resulted in the recognition of a loss on impairment of $14.0 million. If the discount rate had increased by 1.0% to 11.0%, the impairment loss would have increased by $657 million; if the discount rate had decreased by 1.0% to 9.0%, no impairment loss would have been recognized.
Non-operating market licenses ("unbuilt licenses")
For purposes of performing impairment testing of unbuilt licenses, U.S. Cellular prepares estimates of fair value by reference to prices paid in recent auctions and market transactions where available. If such information is not available, the fair value of the unbuilt licenses is assumed to have changed by the same percentage, and in the same direction, that the fair value of built licenses measured using the build-out method changed during the period. None of the $14.0 million total impairment loss recognized as a result of the November 1, 2009 licenses impairment test related to unbuilt licenses.
Carrying Value of Licenses
The carrying value of licenses at December 31, 2009 was as follows:
Unit of accounting
|
Carrying value |
||||
|---|---|---|---|---|---|
| |
(Dollars in millions) |
||||
U.S. Cellular—Operating markets (5 units of accounting) |
|||||
Central Region |
$ | 623 | |||
Mid-Atlantic Region |
197 | ||||
New England Region |
80 | ||||
Northwest Region |
57 | ||||
New York Region |
1 | ||||
U.S. Cellular—Non-operating markets (13 units of accounting) |
|||||
Central (3 states) |
103 | ||||
South Central (3 states) |
5 | ||||
North Central (3 states) |
27 | ||||
Southwest Central I (3 states) |
8 | ||||
Southwest Central II (4 states) |
24 | ||||
Northwest Central I (5 states) |
14 | ||||
Northwest Central II (5 states) |
151 | ||||
Mid-Atlantic I (3 states) |
35 | ||||
Mid-Atlantic II (7 states) |
37 | ||||
Mississippi Valley (14 states) |
44 | ||||
Northeast (4 states) |
24 | ||||
North Northwest (2 states) |
4 | ||||
South Northwest (2 states) |
6 | ||||
Total |
$ | 1,440 | |||
TDS Telecom |
3 | ||||
Total |
$ | 1,443 | |||
Due to the recently recorded impairment charges, $57 million of these licenses were recorded at fair value as of December 31, 2009. In addition, licenses with an aggregate carrying value of $1,105 million were in units of accounting where the fair value exceeded the carrying value by amounts less than 10% of the carrying value. Therefore, TDS believes that there is an increased likelihood that any declines in the fair value of such licenses in future periods would result in the recognition of impairment losses on such licenses in future periods, and any such impairment losses would have a negative impact on future results of operations. The impairment losses on licenses are not expected to have a future impact on liquidity. TDS is unable to predict the amount, if any, of future impairment losses attributable to licenses. Further, historical operating results, particularly amounts related to impairment losses, are not indicative of future operating results.
Property, Plant and Equipment—Depreciation
U.S. Cellular and TDS Telecom each provide for depreciation using the straight-line method over the estimated useful lives of the assets. Prior to the third quarter of 2007, TDS Telecom's ILEC operations followed accounting for regulated enterprises providing for depreciation according to depreciable rates approved by state public utility commissions. In 2007, management determined that it was no longer appropriate to continue the application of this accounting for reporting its financial results. See Note 5—Extraordinary Item in the Notes to Consolidated Financial Statements for additional details. TDS depreciates its leasehold improvement assets associated with leased properties over periods ranging from one to thirty years, which approximates the shorter of the assets' economic lives or the specific lease terms.
Annually, U.S. Cellular and TDS Telecom review their property, plant and equipment lives to ensure that the estimated useful lives are appropriate. The estimated useful lives of property, plant and equipment are critical accounting estimates because changing the lives of assets can result in larger or smaller charges for depreciation expense. Factors used in determining useful lives include technology changes, regulatory requirements, obsolescence and types of use.
U.S. Cellular and TDS Telecom did not materially change the useful lives of their property, plant and equipment in 2009, 2008 or 2007.
Income Taxes
The amounts of income tax assets and liabilities, the related income tax provision and the amount of unrecognized tax benefits are critical accounting estimates because such amounts are significant to TDS' financial condition and results of operations.
The preparation of the consolidated financial statements requires TDS to calculate a provision for income taxes. This process involves estimating the actual current income tax liability together with assessing temporary differences resulting from the different treatment of items for tax purposes, as well as estimating the impact of potential adjustments to tax returns filed and to be filed. These temporary differences result in deferred income tax assets and liabilities, which are included in the Consolidated Balance Sheet. TDS must then assess the likelihood that deferred income tax assets will be realized based on future taxable income and, to the extent management believes that realization is not likely, establish a valuation allowance. Management's judgment is required in determining the provision for income taxes, deferred income tax assets and liabilities and any valuation allowance that is established for deferred income tax assets.
TDS recognizes the tax benefit from an uncertain tax position only if it is more likely than not that the tax position will be sustained on examination by the taxing authorities, based on the technical merits of the position. The tax benefits recognized in the financial statements from such a position are measured based on the largest benefit that has a greater than 50% likelihood of being realized upon ultimate resolution.
See Note 4—Income Taxes in the Notes to Consolidated Financial Statements for details regarding TDS' income tax provision, deferred income taxes and liabilities, valuation allowances and unrecognized tax benefits, including information regarding estimates that impact income taxes.
Allowance for Doubtful Accounts
U.S. Cellular's accounts receivable primarily consist of amounts owed by customers pursuant to service contracts and for equipment sales, by agents for sales of equipment to them and by other wireless carriers whose customers have used U.S. Cellular's wireless systems.
TDS Telecom's accounts receivable primarily consist of amounts owed by customers for services provided, by connecting companies for carrying interstate and intrastate long-distance traffic on its network and by interstate and intrastate revenue pools that distribute access charges.
The allowance for doubtful accounts is the best estimate of the amount of probable credit losses related to existing accounts receivable. The allowance is estimated based on historical experience and other factors that could affect collectability. Accounts receivable balances are reviewed on either an aggregate or individual basis for collectability depending on the type of receivable. When it is probable that an account balance will not be collected, the account balance is charged against the allowance for doubtful accounts. TDS does not have any off-balance sheet credit exposure related to its customers. TDS will continue to monitor its accounts receivable balances and related allowance for doubtful accounts on an ongoing basis to assess whether it has adequately provided for potentially uncollectible amounts.
See Note 1—Summary of Significant Accounting Policies and Recent Accounting Pronouncements in the Notes to Consolidated Financial Statements for additional information regarding TDS' allowance for doubtful accounts.
The following persons are partners of Sidley Austin LLP, the principal law firm of TDS and its subsidiaries: Walter C.D. Carlson, a trustee and beneficiary of a voting trust that controls TDS, the non-executive Chairman of the Board and member of the Board of Directors of TDS and a director of U.S. Cellular, a subsidiary of TDS; William S. DeCarlo, the General Counsel of TDS and an Assistant Secretary of TDS and certain subsidiaries of TDS; and Stephen P. Fitzell, the General Counsel of U.S. Cellular and TDS Telecommunications Corporation and an Assistant Secretary of certain subsidiaries of TDS. Walter C.D. Carlson does not provide legal services to TDS or its subsidiaries. TDS, U.S. Cellular and their subsidiaries incurred legal costs from Sidley Austin LLP of $13.8 million in 2009, $12.0 million in 2008 and $11.2 million in 2007.
On May 29, 2009, TDS repurchased 1,730,200 Special Common Shares at the then current market price on the New York Stock Exchange ("NYSE") for a total price of $48.2 million, or an average of $27.89 per Special Common Share including broker fees, from an affiliate of Southeastern Asset Management, Inc. ("SEAM"). In addition, on July 20, 2009, TDS repurchased 405,000 Special Common Shares from SEAM at a price below the then current market price on the NYSE for a total price of $10.5 million, or an average of $25.87 per Special Common Share including broker fees.
At the time, SEAM was a shareholder of more than 5% of TDS Special Common Shares and Common Shares, and currently continues to hold more than 5% of the Special Common Shares. See "Security Ownership by Certain Beneficial Owners" in TDS' Notice of Annual Meeting and Proxy Statement filed with the SEC on April 28, 2009 for further information about SEAM and its interest in TDS. These transactions were not solicited by TDS and TDS did not enter into any agreements with SEAM. The May 29, 2009 transaction was effected by TDS' broker pursuant to TDS' existing institutional brokerage account agreement on the NYSE in compliance with Rule 10b-18 under the Securities Exchange Act of 1934, as amended ("Exchange Act"). The July 20, 2009 transaction was made by TDS' broker pursuant to an agreement entered into pursuant to Rule 10b5-1 under the Exchange Act and was effected on the NYSE in compliance with Rule 10b-18. The repurchases were made under TDS' share repurchase authorization that was effective at the time of such repurchases.
The Audit Committee of the Board of Directors is responsible for the review and evaluation of all related-party transactions, as such term is defined by the rules of the New York Stock Exchange.
SAFE HARBOR CAUTIONARY STATEMENT
This Management's Discussion and Analysis of Financial Condition and Results of Operations and other sections of this Annual Report contain statements that are not based on historical facts, including the words "believes," "anticipates," "intends," "expects" and similar words. These statements constitute "forward-looking statements" within the meaning of the Private Securities Litigation Reform Act of 1995. Such forward-looking statements involve known and unknown risks, uncertainties and other factors that may cause actual results, events or developments to be significantly different from any future results, events or developments expressed or implied by such forward-looking statements. Such factors include, but are not limited to, the following risks:
- Intense competition in the markets in which TDS operates could adversely affect TDS' revenues or increase its costs to compete.
- A failure by TDS to successfully execute its business strategy or allocate resources or capital could have an adverse effect on TDS' business, financial condition or results of operations.
- A failure by TDS' service offerings to meet customer expectations could limit TDS' ability to attract and retain customers and could have an adverse effect on TDS' operations.
- TDS' system infrastructure may not be capable of supporting changes in technologies and services expected by customers, which could result in lost customers and revenues.
- An inability to obtain or maintain roaming arrangements with other carriers on terms that are acceptable to TDS could have an adverse effect on TDS' business, financial condition or results of operations.
- TDS currently receives a significant amount of roaming revenues from its wireless business. As a result of acquisitions by other companies in the wireless industry, TDS roaming revenues have declined significantly from amounts earned in certain prior years. Further industry consolidation and continued build outs by existing and new wireless carriers could cause roaming revenues to decline even more, which would have an adverse effect on TDS' business, financial condition and results of operations.
- A failure by TDS to obtain access to adequate radio spectrum to meet current or anticipated future needs and/or to accurately predict future needs for radio spectrum could have an adverse effect on TDS' business and operations.
- To the extent conducted by the FCC, TDS is likely to participate in FCC auctions of additional spectrum in the future as an applicant or as a non-controlling partner in another auction applicant and, during certain periods, will be subject to the FCC's anti-collusion rules, which could have an adverse effect on TDS.
- Changes in the regulatory environment or a failure by TDS to timely or fully comply with any applicable regulatory requirements could adversely affect TDS' financial condition, results of operations or ability to do business.
- Changes in USF funding and/or intercarrier compensation could have a material adverse impact on TDS' financial position or results of operations.
- An inability to attract and/or retain management, technical, sales and other personnel could have an adverse effect on TDS' business, financial condition or results of operations.
- TDS' assets are concentrated in the U.S. telecommunications industry. As a result, its results of operations may fluctuate based on factors related entirely to conditions in this industry.
- The completion of acquisitions by other companies has led to increased consolidation in the wireless telecommunications industry. TDS' lower scale relative to larger wireless carriers has in the past and could in the future prevent or delay its access to new products including handsets, new technology and/or new content and applications which could adversely affect TDS' ability to attract and retain customers and, as a result, could adversely affect its business, financial condition or results of operations.
- Inability to manage its supply chain or inventory successfully could have an adverse effect on TDS' business, financial condition or results of operations.
- Changes in general economic and business conditions, both nationally and in the markets in which TDS operates, could have an adverse effect on TDS' business, financial condition or results of operations.
- Changes in various business factors could have an adverse effect on TDS' business, financial condition or results of operations.
- Advances or changes in telecommunications technology, such as Voice over Internet Protocol ("VoIP"), High-Speed Packet Access, WiMAX or Long-Term Evolution ("LTE"), could render certain technologies used by TDS obsolete, could reduce TDS' revenues or could increase its costs of doing business.
- TDS could incur higher than anticipated intercarrier compensation costs.
- TDS is subject to numerous surcharges and fees from federal, state and local governments, and the applicability and the amount of these fees are subject to great uncertainty.
- Changes in TDS' enterprise value, changes in the market supply or demand for wireless licenses or wireline markets, adverse developments in the business or the industry in which TDS is involved and/or other factors could require TDS to recognize impairments in the carrying value of its license costs, goodwill and/or physical assets.
- Costs, integration problems or other factors associated with acquisitions/divestitures of properties or licenses and/or expansion of TDS' business could have an adverse effect on TDS' business, financial condition or results of operations.
- A significant portion of TDS' wireless revenues is derived from customers who buy services through independent agents who market TDS' services on a commission basis. If TDS' relationships with these agents are seriously harmed, its wireless revenues could be adversely affected.
- TDS' investments in technologies which are unproven may not produce the benefits that TDS expects.
- A failure by TDS to complete significant network construction and systems implementation activities as part of its plans to improve the quality, coverage, capabilities and capacity of its network and support systems could have an adverse effect on its operations.
- Financial difficulties (including bankruptcy proceedings) of TDS' key suppliers or vendors, termination or impairment of TDS' relationships with such suppliers or vendors, or a failure by TDS to manage its supply chain effectively could result in delays or termination of TDS' receipt of required equipment or services, or could result in excess quantities of required equipment or services, any of which could adversely affect TDS' business, financial condition or results of operations.
- TDS has significant investments in entities that it does not control. Losses in the value of such investments could have an adverse effect on TDS' financial condition or results of operations.
- A failure by TDS to maintain flexible and capable telecommunication networks or information technology, or a material disruption thereof, including breaches of network or information technology security, could have an adverse effect on TDS' business, financial condition or results of operations.
- Wars, conflicts, hostilities and/or terrorist attacks or equipment failures, power outages, natural disasters or other events could have an adverse effect on TDS' business, financial condition or results of operations.
- The market prices of TDS' Common Shares and Special Common Shares are subject to fluctuations due to a variety of factors.
- Identification of errors in financial information or disclosures could require amendments to or restatements of financial information or disclosures included in this or prior filings with the SEC.
- Restatements of financial statements by TDS and related matters, including resulting delays in filing periodic reports with the SEC, could have an adverse effect on TDS' business, financial condition or results of operations.
- The existence of material weaknesses in the effectiveness of internal control over financial reporting could result in inaccurate financial statements or other disclosures or failure to prevent fraud, which could have an adverse effect on TDS' business, financial condition or results of operations.
- Changes in facts or circumstances, including new or additional information that affects the calculation of potential liabilities for contingent obligations under guarantees, indemnities, claims, litigation or otherwise, could require TDS to record charges in excess of amounts accrued in the financial statements, if any, which could have an adverse effect on TDS' financial condition or results of operations.
- Early redemptions or repurchases of debt, issuances of debt, changes in operating leases, changes in purchase obligations or other factors or developments could cause the amounts reported under Contractual Obligations in TDS' Management's Discussion and Analysis of Financial Condition and Results of Operations to be different from the amounts actually incurred.
- An increase in the amount of TDS' debt could subject TDS to higher interest costs and restrictions on its financing, investing and operating activities and could decrease its net income and cash flows.
- Disruption in credit or other financial markets, a deterioration of U.S. or global economic conditions or other events, could, among other things, impede TDS' access to or increase the cost of financing its operating and investment activities and/or result in reduced revenues and lower operating income and cash flows, which would have an adverse effect on TDS' financial condition or results of operations.
- Uncertainty of access to capital for telecommunications companies, deterioration in the capital markets, other changes in market conditions, changes in TDS' credit ratings or other factors could limit or restrict the availability of financing on terms and prices acceptable to TDS, which could require TDS to reduce its construction, development or acquisition programs.
- TDS' and U.S. Cellular's credit facilities and the indentures governing their senior notes include restrictive covenants that limit their operating flexibility and TDS and U.S. Cellular may be unable to service their debt or to refinance their indebtedness before maturity.
- Changes in income tax rates, laws, regulations or rulings, or federal or state tax assessments, could have an adverse effect on TDS' financial condition or results of operations.
- Settlements, judgments, restraints on its current or future manner of doing business and/or legal costs resulting from pending and future litigation could have an adverse effect on TDS' financial condition, results of operations or ability to do business.
- The possible development of adverse precedent in litigation or conclusions in professional studies to the effect that radio frequency emissions from handsets, wireless data devices and/or cell sites cause harmful health consequences, including cancer or tumors, or may interfere with various electronic medical devices such as pacemakers, could have an adverse effect on TDS' wireless business, financial condition or results of operations.
- Claims of infringement of intellectual property and proprietary rights of others, primarily involving patent infringement claims, could prevent TDS from using necessary technology to provide services or subject TDS to expensive intellectual property litigation or monetary penalties, which could have an adverse effect on TDS' business, financial condition or results of operations.
- Certain matters, such as control by the TDS Voting Trust and provisions in the TDS Restated Certificate of Incorporation, may serve to discourage or make more difficult a change in control of TDS.
- Any of the foregoing events or other events could cause revenues, customer additions, operating income, capital expenditures and/or any other financial or statistical information to vary from TDS' forward-looking estimates by a material amount.
You are referred to a further discussion of these risks as set forth under "Risk Factors" in TDS' Annual Report on Form 10-K for the year ended December 31, 2009. TDS undertakes no obligation to update publicly any forward-looking statements whether as a result of new information, future events or otherwise. Readers should evaluate any statements in light of these important factors.
Long-Term Debt
As of December 31, 2009, TDS' long-term debt was in the form of fixed-rate notes with original maturities ranging up to 40 years. Fluctuations in market interest rates can lead to significant fluctuations in the fair value of these fixed-rate notes.
The following table presents the scheduled principal payments on long-term debt and capital lease obligations, and the related weighted average interest rates by maturity dates at December 31, 2009:
| |
Principal Payments Due by Period | ||||||
|---|---|---|---|---|---|---|---|
(Dollars in millions)
|
Long-Term Debt Obligations(1) |
Weighted-Avg. Interest Rates on Long-Term Debt Obligations(2) |
|||||
2010 |
$ | 2.5 | 5.2 | % | |||
2011 |
1.6 | 5.1 | % | ||||
2012 |
4.9 | 5.9 | % | ||||
2013 |
0.3 | 5.5 | % | ||||
2014 |
0.2 | 7.8 | % | ||||
After 5 years |
1,496.7 | 7.2 | % | ||||
Total |
$ | 1,506.2 | 7.2 | % | |||
| (1) | The total long-term debt obligation amount is different than the total long-term debt amount shown on the Consolidated Balance Sheet due to the $10.8 million unamortized discount related to U.S. Cellular's 6.7% senior notes. See Note 14—Debt in the Notes to Consolidated Financial Statements for additional information. |
| (2) | Represents the weighted average interest rates at December 31, 2009, for debt maturing in the respective periods. At December 31, 2008, the total weighted average interest rate on long-term debt obligations was 7.3%. |
Fair Value of Long-Term Debt
At December 31, 2009 and 2008, the estimated fair value of long-term debt obligations was $1,462.0 million and $1,035.6 million, respectively. The fair value of long-term debt other than capital lease obligations and the current portion of such long-term debt was estimated using market prices for TDS' 7.6% Series A Notes, 6.625% senior notes, and U.S. Cellular's 7.5% senior notes and discounted cash flow analysis for the remaining debt. U.S. Cellular's 8.75% senior notes were redeemed in December 2009.
Year Ended December 31,
|
2009 | 2008 | 2007 | |||||||||
|---|---|---|---|---|---|---|---|---|---|---|---|---|
| |
(Dollars and shares in thousands, except per share amounts) |
|||||||||||
Operating revenues |
$ | 5,020,674 | $ | 5,092,019 | $ | 4,828,984 | ||||||
Operating expenses |
||||||||||||
Cost of services and products (excluding Depreciation, amortization and accretion expense reported below) |
1,864,426 | 1,853,686 | 1,693,531 | |||||||||
Selling, general and administrative expense |
1,966,707 | 1,921,430 | 1,800,480 | |||||||||
Depreciation, amortization and accretion expense |
749,970 | 750,077 | 748,136 | |||||||||
Loss on impairment of intangible assets |
14,000 | 414,376 | 24,923 | |||||||||
Loss on asset disposals, net |
17,765 | 24,296 | 34,016 | |||||||||
Total operating expenses |
4,612,868 | 4,963,865 | 4,301,086 | |||||||||
Operating income |
407,806 |
128,154 |
527,898 |
|||||||||
Investment and other income (expense) |
||||||||||||
Equity in earnings of unconsolidated entities |
90,732 | 89,812 | 91,831 | |||||||||
Interest and dividend income |
11,121 | 39,131 | 199,435 | |||||||||
Interest expense |
(124,557 | ) | (137,899 | ) | (208,736 | ) | ||||||
Gain on investments and financial instruments |
— | 31,595 | 81,423 | |||||||||
Other, net |
2,000 | 2,213 | (6,401 | ) | ||||||||
Total investment and other income (expense) |
(20,704 | ) | 24,852 | 157,552 | ||||||||
Income before income taxes and extraordinary item |
387,102 |
153,006 |
685,450 |
|||||||||
Income tax expense |
133,376 | 30,093 | 269,054 | |||||||||
Income before extraordinary item |
253,726 | 122,913 | 416,396 | |||||||||
Extraordinary item, net of tax (Note 5) |
— | — | 42,827 | |||||||||
Net income |
253,726 | 122,913 | 459,223 | |||||||||
Less: Net income attributable to noncontrolling interests, net of tax |
(59,824 | ) | (29,372 | ) | (73,111 | ) | ||||||
Net income attributable to TDS shareholders |
193,902 | 93,541 | 386,112 | |||||||||
Preferred dividend requirement |
(51 | ) | (52 | ) | (52 | ) | ||||||
Net income available to common |
$ | 193,851 | $ | 93,489 | $ | 386,060 | ||||||
Basic weighted average shares outstanding |
109,339 |
115,817 |
117,624 |
|||||||||
Basic earnings per share attributable to TDS shareholders (Note 7) |
||||||||||||
Net Income before extraordinary item attributable to TDS Shareholders |
$ | 1.77 | $ | 0.81 | $ | 2.92 | ||||||
Extraordinary item |
— | — | 0.36 | |||||||||
Net Income available to common |
$ | 1.77 | $ | 0.81 | $ | 3.28 | ||||||
Diluted weighted average shares outstanding |
109,577 |
116,255 |
119,126 |
|||||||||
Diluted earnings per share attributable to TDS shareholders (Note 7) |
||||||||||||
Net Income before extraordinary item attributable to TDS Shareholders |
$ | 1.77 | $ | 0.80 | $ | 2.86 | ||||||
Extraordinary item |
— | — | 0.36 | |||||||||
Net Income available to common |
$ | 1.77 | $ | 0.80 | $ | 3.22 | ||||||
Dividends per share |
$ |
0.43 |
$ |
0.41 |
$ |
0.39 |
||||||
The accompanying notes are an integral part of these consolidated financial statements.
Year Ended December 31,
|
2009 | 2008 | 2007 | ||||||||||
|---|---|---|---|---|---|---|---|---|---|---|---|---|---|
| |
(Dollars in thousands) |
||||||||||||
Cash flows from operating activities |
|||||||||||||
Net income |
$ | 253,726 | $ | 122,913 | $ | 459,223 | |||||||
Add (deduct) adjustments to reconcile net income to net cash flows from operating activities |
|||||||||||||
Depreciation, amortization and accretion |
749,970 | 750,077 | 748,136 | ||||||||||
Bad debts expense |
115,989 | 83,004 | 74,988 | ||||||||||
Stock-based compensation expense |
32,486 | 22,693 | 31,891 | ||||||||||
Deferred income taxes, net |
31,053 | (437,919 | ) | (283,047 | ) | ||||||||
Gain on investments and financial instruments, net |
— | (31,595 | ) | (81,423 | ) | ||||||||
Equity in earnings of unconsolidated entities |
(90,732 | ) | (89,812 | ) | (91,831 | ) | |||||||
Distributions from unconsolidated entities |
91,587 | 92,335 | 87,404 | ||||||||||
Loss on impairment of intangible assets |
14,000 | 414,376 | 24,923 | ||||||||||
Loss on asset disposals, net |
17,765 | 24,296 | 34,016 | ||||||||||
Extraordinary item, net of tax |
— | — | (42,827 | ) | |||||||||
Noncash interest expense |
4,412 | 10,125 | 21,124 | ||||||||||
Excess tax benefit from stock awards |
(25 | ) | (1,966 | ) | (28,981 | ) | |||||||
Other operating activities |
(46 | ) | (1,831 | ) | (3,683 | ) | |||||||
Changes in assets and liabilities |
|||||||||||||
Accounts receivable |
(110,258 | ) | (79,427 | ) | (88,889 | ) | |||||||
Inventory |
(34,566 | ) | (17,123 | ) | 16,848 | ||||||||
Accounts payable |
29,646 | 6,804 | 13,905 | ||||||||||
Customer deposits and deferred revenues |
(6,165 | ) | 7,692 | 24,725 | |||||||||
Accrued taxes |
56,068 | (11,725 | ) | 56,225 | |||||||||
Accrued interest |
(2,009 | ) | (4,221 | ) | (8,273 | ) | |||||||
Other assets and liabilities |
(50,307 | ) | (9,804 | ) | (23,422 | ) | |||||||
|
1,102,594 | 848,892 | 941,032 | ||||||||||
Cash flows from investing activities |
|||||||||||||
Additions to property, plant and equipment |
(671,165 | ) | (734,923 | ) | (699,566 | ) | |||||||
Cash paid for acquisitions and licenses |
(29,276 | ) | (389,189 | ) | (23,764 | ) | |||||||
Cash received from divestitures |
50 | 6,838 | 4,277 | ||||||||||
Proceeds from disposition of investments |
— | 259,017 | 92,002 | ||||||||||
Cash paid to settle derivative liabilities |
— | (17,404 | ) | — | |||||||||
Cash paid for short-term investments |
(109,230 | ) | (27,446 | ) | — | ||||||||
Cash received from short-term investments |
23,660 | — | — | ||||||||||
Other investing activities |
4,515 | 355 | (804 | ) | |||||||||
|
(781,446 | ) | (902,752 | ) | (627,855 | ) | |||||||
Cash flows from financing activities |
|||||||||||||
Borrowings from revolving credit facilities |
— | 100,000 | 25,000 | ||||||||||
Repayment of revolving credit facilities |
— | (100,000 | ) | (60,000 | ) | ||||||||
Issuance of long-term debt |
— | — | 2,857 | ||||||||||
Repayment of long-term debt |
(143,078 | ) | (9,448 | ) | (3,552 | ) | |||||||
Settlement of variable prepaid forward contracts |
— | (47,357 | ) | — | |||||||||
TDS Common Shares and Special Common Shares |
|||||||||||||
reissued for benefit plans, net of tax payments |
819 | 1,409 | 113,605 | ||||||||||
U.S. Cellular Common Shares reissued for benefit plans, net of tax payments |
(82 | ) | (2,288 | ) | 10,073 | ||||||||
Excess tax benefit from stock awards |
25 | 1,966 | 28,981 | ||||||||||
Repurchase of TDS Common and Special Common Shares |
(178,536 | ) | (197,672 | ) | (126,668 | ) | |||||||
Repurchase of U.S. Cellular Common Shares |
(33,585 | ) | (28,366 | ) | (87,902 | ) | |||||||
Dividends paid |
(46,798 | ) | (47,320 | ) | (45,830 | ) | |||||||
Payment of debt issuance costs |
(10,079 | ) | — | — | |||||||||
Distributions to noncontrolling interests |
(17,533 | ) | (16,769 | ) | (8,559 | ) | |||||||
Other financing activities |
1,382 | 2,568 | (61 | ) | |||||||||
|
(427,465 | ) | (343,277 | ) | (152,056 | ) | |||||||
Net increase (decrease) in cash and cash equivalents |
(106,317 | ) | (397,137 | ) | 161,121 | ||||||||
Cash and cash equivalents |
|||||||||||||
Beginning of period |
777,309 | 1,174,446 | 1,013,325 | ||||||||||
End of period |
$ | 670,992 | $ | 777,309 | $ | 1,174,446 | |||||||
The accompanying notes are an integral part of these consolidated financial statements.
December 31,
|
2009 | 2008 | |||||||
|---|---|---|---|---|---|---|---|---|---|
| |
(Dollars in thousands) |
||||||||
Current assets |
|||||||||
Cash and cash equivalents |
$ | 670,992 | $ | 777,309 | |||||
Short-term investments |
113,275 | 27,705 | |||||||
Accounts receivable |
|||||||||
Due from customers, less allowances of $30,422 and $12,822, respectively |
380,941 | 377,054 | |||||||
Other, principally connecting companies, less allowances of $7,201 and $6,380, respectively |
130,973 | 139,795 | |||||||
Inventory |
156,987 | 122,377 | |||||||
Net deferred income tax asset |
29,874 | 27,758 | |||||||
Prepaid expenses |
94,336 | 93,382 | |||||||
Other current assets |
66,764 | 63,556 | |||||||
|
1,644,142 | 1,628,936 | |||||||
Investments |
|||||||||
Licenses |
1,443,025 | 1,441,440 | |||||||
Goodwill |
707,840 | 707,079 | |||||||
Customer lists, net of accumulated amortization of $108,944 and $97,891, respectively |
26,589 | 34,032 | |||||||
Investments in unconsolidated entities |
203,799 | 205,768 | |||||||
Notes receivable, less valuation allowance of $55,144 and $55,144, respectively |
7,605 | 7,898 | |||||||
Other investments |
2,180 | 2,725 | |||||||
|
2,391,038 | 2,398,942 | |||||||
Property, plant and equipment |
|||||||||
In service and under construction |
8,760,327 | 8,680,388 | |||||||
Less: Accumulated depreciation |
5,252,482 | 5,111,464 | |||||||
|
3,507,845 | 3,568,924 | |||||||
Other assets and deferred charges |
65,759 |
55,614 |
|||||||
Total assets |
$ |
7,608,784 |
$ |
7,652,416 |
|||||
The accompanying notes are an integral part of these consolidated financial statements.
December 31,
|
2009 | 2008 | |||||||||
|---|---|---|---|---|---|---|---|---|---|---|---|
| |
(Dollars in thousands) |
||||||||||
Current liabilities |
|||||||||||
Current portion of long-term debt |
$ | 2,509 | $ | 15,337 | |||||||
Accounts payable |
347,348 | 319,575 | |||||||||
Customer deposits and deferred revenues |
167,963 | 174,101 | |||||||||
Accrued interest |
12,227 | 14,236 | |||||||||
Accrued taxes |
39,644 | 25,192 | |||||||||
Accrued compensation |
93,524 | 90,512 | |||||||||
Other current liabilities |
117,081 | 134,334 | |||||||||
|
780,296 | 773,287 | |||||||||
Deferred liabilities and credits |
|||||||||||
Net deferred income tax liability |
517,762 | 471,623 | |||||||||
Other deferred liabilities and credits |
373,862 | 368,045 | |||||||||
|
891,624 | 839,668 | |||||||||
Long-term debt |
1,492,908 |
1,621,422 |
|||||||||
Commitments and contingencies |
|||||||||||
Noncontrolling interests with redemption features |
727 |
589 |
|||||||||
Equity |
|||||||||||
TDS stockholders' equity |
|||||||||||
Common Shares, par value $.01 per share; authorized 100,000,000 shares; issued 57,082,000 shares |
571 | 571 | |||||||||
Special Common Shares, par value $.01 per share; authorized 165,000,000 shares; issued 63,442,000 shares |
634 | 634 | |||||||||
Series A Common Shares, par value $.01 per share; authorized 25,000,000 shares; issued and outstanding 6,492,000 and 6,461,000 shares, respectively |
65 | 65 | |||||||||
Capital in excess of par value |
2,088,807 | 2,066,597 | |||||||||
Treasury Shares at cost: |
|||||||||||
Common Shares, 7,277,000 and 5,435,000 shares, respectively |
(217,381 | ) | (163,017 | ) | |||||||
Special Common Shares, 13,717,000 and 9,352,000 shares, respectively |
(464,268 | ) | (350,091 | ) | |||||||
Accumulated other comprehensive income |
(2,710 | ) | (16,812 | ) | |||||||
Retained earnings |
2,371,587 | 2,229,540 | |||||||||
Total TDS stockholders' equity |
3,777,305 | 3,767,487 | |||||||||
Preferred shares |
832 |
852 |
|||||||||
Noncontrolling interests |
665,092 | 649,111 | |||||||||
Total equity |
4,443,229 | 4,417,450 | |||||||||
Total liabilities and equity |
$ |
7,608,784 |
$ |
7,652,416 |
|||||||
The accompanying notes are an integral part of these consolidated financial statements.
| |
TDS Stockholders | |
|
|
||||||||||||||||||||||||||||||||||
|---|---|---|---|---|---|---|---|---|---|---|---|---|---|---|---|---|---|---|---|---|---|---|---|---|---|---|---|---|---|---|---|---|---|---|---|---|---|---|
| |
Common Shares |
Special Common Shares |
Series A Common Shares |
Capital in Excess of Par Value |
Treasury Common Shares |
Treasury Special Common Shares |
Accumulated Other Comprehensive Income (Loss) |
Retained Earnings |
Total TDS Stockholders' Equity |
Preferred Shares |
Non controlling Interests |
Total Equity |
||||||||||||||||||||||||||
| |
(Dollars in thousands) |
|||||||||||||||||||||||||||||||||||||
December 31, 2006 |
$ | 571 | $ | 633 | $ | 64 | $ | 1,992,597 | $ | (187,108 | ) | $ | (187,020 | ) | $ | 522,113 | $ | 1,428,570 | $ | 3,570,420 | $ | 863 | $ | 611,794 | $ | 4,183,077 | ||||||||||||
Net income attributable to TDS shareholders |
— | — | — | — | — | — | — | 386,112 | 386,112 | — | — | 386,112 | ||||||||||||||||||||||||||
Net income attributable to noncontrolling interests classified as equity |
— | — | — | — | — | — | — | — | — | — | 76,867 | 76,867 | ||||||||||||||||||||||||||
Net change in marketable equity securities and equity method investments |
— | — | — | — | — | — | (114,907 | ) | — | (114,907 | ) | — | (13,037 | ) | (127,944 | ) | ||||||||||||||||||||||
Net change in derivative instruments |
— | — | — | — | — | — | 80,122 | — | 80,122 | — | (549 | ) | 79,573 | |||||||||||||||||||||||||
Changes in plan assets and projected benefit obligation related to retirement plan |
— | — | — | — | — | — | 3,403 | — | 3,403 | — | — | 3,403 | ||||||||||||||||||||||||||
Termination of defined benefit pension plan(1) |
— | — | — | — | — | — | 322 | — | 322 | — | — | 322 | ||||||||||||||||||||||||||
Cumulative-effect adjustment related to accounting for unrecognized tax benefits |
— | — | — | — | — | — | 20,723 | (16,323 | ) | 4,400 | — | — | 4,400 | |||||||||||||||||||||||||
Dividends: |
||||||||||||||||||||||||||||||||||||||
Common, Special Common and Series A Common Shares |
— | — | — | — | — | — | — | (45,778 | ) | (45,778 | ) | — | — | (45,778 | ) | |||||||||||||||||||||||
Preferred shares |
— | — | — | — | — | — | — | (52 | ) | (52 | ) | — | — | (52 | ) | |||||||||||||||||||||||
Repurchase of shares |
— | — | — | — | (126,668 | ) | — | — | (126,668 | ) | (3 | ) | — | (126,671 | ) | |||||||||||||||||||||||
Dividend reinvestment plan |
— | — | — | 1,483 | — | — | — | — | 1,483 | — | — | 1,483 | ||||||||||||||||||||||||||
Incentive and compensation plans |
— | — | — | 368 | 66,559 | 108,770 | — | (61,878 | ) | 113,819 | — | — | 113,819 | |||||||||||||||||||||||||
Adjust investment in subsidiaries for repurchases, issuances and other compensation plans |
— | — | — | 8,431 | — | — | — | — | 8,431 | — | (11,544 | ) | (3,113 | ) | ||||||||||||||||||||||||
Stock-based compensation awards(2) |
— | — | — | 17,219 | — | — | — | — | 17,219 | — | — | 17,219 | ||||||||||||||||||||||||||
Tax windfall (shortfall) from stock awards(3) |
— | — | — | 28,376 | — | — | — | — | 28,376 | — | — | 28,376 | ||||||||||||||||||||||||||
Distributions to noncontrolling interests |
— | — | — | — | — | — | — | — | — | — | (8,559 | ) | (8,559 | ) | ||||||||||||||||||||||||
Other |
— | — | — | (364 | ) | — | — | — | — | (364 | ) | — | — | (364 | ) | |||||||||||||||||||||||
December 31, 2007 |
$ | 571 | $ | 633 | $ | 64 | $ | 2,048,110 | $ | (120,549 | ) | $ | (204,918 | ) | $ | 511,776 | $ | 1,690,651 | $ | 3,926,338 | $ | 860 | $ | 654,972 | $ | 4,582,170 | ||||||||||||
| |
TDS Stockholders | |
|
|
||||||||||||||||||||||||||||||||||
|---|---|---|---|---|---|---|---|---|---|---|---|---|---|---|---|---|---|---|---|---|---|---|---|---|---|---|---|---|---|---|---|---|---|---|---|---|---|---|
| |
Common Shares |
Special Common Shares |
Series A Common Shares |
Capital in Excess of Par Value |
Treasury Common Shares |
Treasury Special Common Shares |
Accumulated Other Comprehensive Income (Loss) |
Retained Earnings |
Total TDS Stockholders' Equity |
Preferred Shares |
Non controlling Interests |
Total Equity |
||||||||||||||||||||||||||
| |
(Dollars in thousands) |
|||||||||||||||||||||||||||||||||||||
December 31, 2007 |
$ | 571 | $ | 633 | $ | 64 | $ | 2,048,110 | $ | (120,549 | ) | $ | (204,918 | ) | $ | 511,776 | $ | 1,690,651 | $ | 3,926,338 | $ | 860 | $ | 654,972 | $ | 4,582,170 | ||||||||||||
Net income attributable to TDS shareholders |
— | — | — | — | — | — | — | 93,541 | 93,541 | — | — | 93,541 | ||||||||||||||||||||||||||
Net income attributable to noncontrolling interests classified as equity |
— | — | — | — | — | — | — | — | — | — | 25,518 | 25,518 | ||||||||||||||||||||||||||
Net change in marketable equity securities and equity method investments |
— | — | — | — | — | — | (17,509 | ) | — | (17,509 | ) | — | (1,945 | ) | (19,454 | ) | ||||||||||||||||||||||
Cumulative-effect adjustment related to fair value accounting (Note 3) |
— | — | — | — | — | — | (502,677 | ) | 502,677 | — | — | — | — | |||||||||||||||||||||||||
Changes in plan assets and projected benefit obligation related to retirement plan |
— | — | — | — | — | — | (8,402 | ) | — | (8,402 | ) | — | — | (8,402 | ) | |||||||||||||||||||||||
Dividends: |
||||||||||||||||||||||||||||||||||||||
Common, Special Common and Series A Common Shares |
— | — | — | — | — | — | — | (47,256 | ) | (47,256 | ) | — | — | (47,256 | ) | |||||||||||||||||||||||
Preferred shares |
— | — | — | — | — | — | — | (52 | ) | (52 | ) | — | — | (52 | ) | |||||||||||||||||||||||
Repurchase of shares |
— | — | — | — | (44,624 | ) | (154,983 | ) | — | — | (199,607 | ) | (8 | ) | — | (199,615 | ) | |||||||||||||||||||||
Dividend reinvestment plan |
— | 1 | 1 | 1,755 | — | — | — | — | 1,757 | — | — | 1,757 | ||||||||||||||||||||||||||
Incentive and compensation plans |
— | — | — | 51 | 2,156 | 9,810 | — | (10,021 | ) | 1,996 | — | — | 1,996 | |||||||||||||||||||||||||
Adjust investment in subsidiaries for repurchases, issuances and other compensation plans |
— | — | — | 8,690 | — | — | — | — | 8,690 | — | (12,848 | ) | (4,158 | ) | ||||||||||||||||||||||||
Stock-based compensation awards(2) |
— | — | — | 7,571 | — | — | — | — | 7,571 | — | — | 7,571 | ||||||||||||||||||||||||||
Tax windfall (shortfall) from stock awards(3) |
— | — | — | 420 | — | — | — | — | 420 | — | — | 420 | ||||||||||||||||||||||||||
Distributions to noncontrolling interests |
— | — | — | — | — | — | — | — | — | — | (16,769 | ) | (16,769 | ) | ||||||||||||||||||||||||
Other |
— | — | — | — | — | — | — | — | — | — | 183 | 183 | ||||||||||||||||||||||||||
December 31, 2008 |
$ | 571 | $ | 634 | $ | 65 | $ | 2,066,597 | $ | (163,017 | ) | $ | (350,091 | ) | $ | (16,812 | ) | $ | 2,229,540 | $ | 3,767,487 | $ | 852 | $ | 649,111 | $ | 4,417,450 | |||||||||||
| |
TDS Stockholders | |
|
|
||||||||||||||||||||||||||||||||||
|---|---|---|---|---|---|---|---|---|---|---|---|---|---|---|---|---|---|---|---|---|---|---|---|---|---|---|---|---|---|---|---|---|---|---|---|---|---|---|
| |
Common Shares |
Special Common Shares |
Series A Common Shares |
Capital in Excess of Par Value |
Treasury Common Shares |
Treasury Special Common Shares |
Accumulated Other Comprehensive Income (Loss) |
Retained Earnings |
Total TDS Stockholders' Equity |
Preferred Shares |
Non controlling Interests |
Total Equity |
||||||||||||||||||||||||||
| |
(Dollars in thousands) |
|||||||||||||||||||||||||||||||||||||
December 31, 2008 |
$ | 571 | $ | 634 | $ | 65 | $ | 2,066,597 | $ | (163,017 | ) | $ | (350,091 | ) | $ | (16,812 | ) | $ | 2,229,540 | $ | 3,767,487 | $ | 852 | $ | 649,111 | $ | 4,417,450 | |||||||||||
Net income attributable to TDS shareholders |
— | — | — | — | — | — | — | 193,902 | 193,902 | — | — | 193,902 | ||||||||||||||||||||||||||
Net income attributable to noncontrolling interests classified as equity |
— | — | — | — | — | — | — | — | — | — | 59,686 | 59,686 | ||||||||||||||||||||||||||
Net unrealized losses on equity investments |
— | — | — | — | — | — | (302 | ) | — | (302 | ) | — | — | (302 | ) | |||||||||||||||||||||||
Changes in plan assets and projected benefit obligation related to retirement plan |
— | — | — | — | — | — | 14,404 | — | 14,404 | — | — | 14,404 | ||||||||||||||||||||||||||
Dividends: |
||||||||||||||||||||||||||||||||||||||
Common, Special Common and Series A Common Shares |
— | — | — | — | — | — | — | (46,747 | ) | (46,747 | ) | — | — | (46,747 | ) | |||||||||||||||||||||||
Preferred shares |
— | — | — | — | — | — | — | (51 | ) | (51 | ) | — | — | (51 | ) | |||||||||||||||||||||||
Repurchase of shares |
— | — | — | — | (55,103 | ) | (121,498 | ) | — | (4 | ) | (176,605 | ) | (20 | ) | — | (176,625 | ) | ||||||||||||||||||||
Dividend reinvestment plan |
— | — | — | 1 | 410 | 833 | — | 286 | 1,530 | — | — | 1,530 | ||||||||||||||||||||||||||
Incentive and compensation plans |
— | — | — | (44 | ) | 329 | 6,488 | — | (5,339 | ) | 1,434 | — | — | 1,434 | ||||||||||||||||||||||||
Adjust investment in subsidiaries for repurchases, issuances, other compensation plans and noncontrolling interest purchase |
— | — | — | 7,705 | — | — | — | — | 7,705 | — | (26,172 | ) | (18,467 | ) | ||||||||||||||||||||||||
Stock-based compensation awards(2) |
— | — | — | 16,124 | — | — | — | — | 16,124 | — | — | 16,124 | ||||||||||||||||||||||||||
Tax windfall (shortfall) from stock awards(3) |
— | — | — | (1,576 | ) | — | — | — | — | (1,576 | ) | — | — | (1,576 | ) | |||||||||||||||||||||||
Distributions to noncontrolling interests |
— | — | — | — | — | — | — | — | — | — | (17,533 | ) | (17,533 | ) | ||||||||||||||||||||||||
December 31, 2009 |
$ | 571 | $ | 634 | $ | 65 | $ | 2,088,807 | $ | (217,381 | ) | $ | (464,268 | ) | $ | (2,710 | ) | $ | 2,371,587 | $ | 3,777,305 | $ | 832 | $ | 665,092 | $ | 4,443,229 | |||||||||||
| (1) | Represents additional liability of an individual telephone company's defined benefit pension plan which was terminated on November 13, 2007. |
| (2) | Reflects TDS Corporate and TDS Telecom's current year stock-based compensation awards impact on Capital in Excess of Par Value. U.S. Cellular's amounts are included in "Adjust investment in subsidiaries for repurchases, issuances and other compensation plans." |
| (3) | Reflects tax windfalls/(shortfalls) associated with the exercise of options and the vesting of restricted stock awards of TDS Common Shares and TDS Special Common Shares. U.S. Cellular's tax windfalls/(shortfalls) associated with the exercise of options and the vesting of restricted stock awards of U.S. Cellular are included in "Adjust investment in subsidiaries for repurchases, issuances and other compensation plans."
The accompanying notes are an integral part of these consolidated financial statements. |
Year Ended December 31,
|
2009 | 2008 | 2007 | ||||||||
|---|---|---|---|---|---|---|---|---|---|---|---|
| |
(Dollars in thousands) |
||||||||||
Net income |
$ | 253,726 | $ | 122,913 | $ | 459,223 | |||||
Net change in accumulated other comprehensive income |
|||||||||||
Net change in marketable equity securities and equity method investments |
(302 | ) | (19,454 | ) | (127,944 | ) | |||||
Changes in plan assets and projected benefit obligation related to retirement plan |
14,404 | (8,402 | ) | 3,403 | |||||||
Net change in derivative instruments |
— | — | 79,573 | ||||||||
Termination of defined benefit plan(1) |
— | — | 322 | ||||||||
Comprehensive income |
267,828 | 95,057 | 414,577 | ||||||||
Less: Comprehensive income attributable to noncontrolling interests |
(59,824 | ) | (27,427 | ) | (59,525 | ) | |||||
Comprehensive income attributable to TDS shareholders |
$ | 208,004 | $ | 67,630 | $ | 355,052 | |||||
| (1) | Represents additional liability of an individual telephone company's defined benefit pension plan which was terminated on November 13, 2007. |
The accompanying notes are an integral part of these consolidated financial statements.
NOTE 1 SUMMARY OF SIGNIFICANT ACCOUNTING POLICIES AND RECENT ACCOUNTING PRONOUNCEMENTS
Nature of Operations
Telephone and Data Systems, Inc. ("TDS") is a diversified telecommunications company providing high-quality telecommunications services in 36 states to approximately 6.1 million wireless customers and 1.1 million wireline equivalent access lines at December 31, 2009. TDS conducts substantially all of its wireless operations through its 82% owned subsidiary, United States Cellular Corporation ("U.S. Cellular"), and provides wireline services through its incumbent local exchange carrier ("ILEC") and competitive local exchange carrier ("CLEC") operations under its wholly owned subsidiary, TDS Telecommunications Corporation ("TDS Telecom"). TDS conducts printing and distribution services through its 80%-owned subsidiary, Suttle-Straus, Inc. ("Suttle-Straus"), which represents a small portion of TDS' operations.
TDS has three reportable segments: (i) U.S. Cellular's wireless operations; (ii) TDS Telecom's ILEC wireline operations and (iii) TDS Telecom's CLEC wireline operations. TDS does not have any foreign operations. See Note 19—Business Segment Information, for summary financial information on each business segment.
Principles of Consolidation
The accounting policies of TDS conform to accounting principles generally accepted in the United States of America ("GAAP") as set forth in the Financial Accounting Standards Board ("FASB") Accounting Standards Codification ("ASC"). Unless otherwise specified, references to accounting provisions and GAAP in these notes refer to the requirements of the FASB ASC. The consolidated financial statements include the accounts of TDS, its majority-owned subsidiaries, general partnerships in which it has a majority partnership interest and any entity in which TDS has a variable interest that requires TDS to recognize a majority of the entity's expected gains or losses. All material intercompany accounts and transactions have been eliminated.
Reclassifications
Certain prior year amounts have been reclassified to conform to the 2009 financial statement presentation. These reclassifications did not affect consolidated net income attributable to TDS shareholders, cash flows, assets, liabilities or equity for the years presented.
Business Combinations Accounting
Effective January 1, 2009, TDS adopted new required provisions under GAAP related to accounting for business combinations. Although the revised provisions still require that all business combinations are to be accounted for at fair value in accordance with the acquisition method, they require TDS to revise its application of the acquisition method in a number of significant aspects. Specifically, the new provisions require that transaction costs are to be expensed and that the acquirer must recognize 100% of the acquiree's assets and liabilities rather than a proportional share, for acquisitions of less than 100% of a business. In addition, the revised provisions eliminate the step acquisition model and provide that all business combinations, whether full, partial or step acquisitions, will result in all assets and liabilities of an acquired business being recorded at their fair values at the acquisition date.
During 2008 and 2007, TDS applied the provisions of GAAP related to business combinations in effect during those periods. Similar to the revised provisions, the previous provisions required the application of the acquisition method whereby business combinations were to be accounted for at fair value. However the previous provisions were different in a number of respects, including (but not limited to) the requirement that all direct and incremental costs relating to an acquisition be included in the acquisition costs, and the requirement that the acquirer only recognize its proportional share of the fair value of assets and liabilities acquired in a partial business acquisition.
Use of Estimates
The preparation of consolidated financial statements in conformity with GAAP requires management to make estimates and assumptions that affect (a) the reported amounts of assets and liabilities and disclosure of contingent assets and liabilities at the date of the financial statements and (b) the reported amounts of revenues and expenses during the reported period. Actual results could differ from those estimates. Significant estimates are involved in accounting for goodwill and indefinite-lived intangible assets, depreciation, amortization and accretion, allowance for doubtful accounts, and income taxes.
Cash and Cash Equivalents
Cash and cash equivalents include cash and short-term, highly liquid investments with original maturities of three months or less.
Outstanding checks totaled $26.1 million and $28.5 million at December 31, 2009 and 2008, respectively, and are classified as Accounts payable in the Consolidated Balance Sheet.
Short-Term Investments
As of December 31, 2009 and 2008, TDS held certificates of deposit totaling $113.3 million and $27.7 million, respectively, which were included in Short-term investments in the Consolidated Balance Sheet. At December 31, 2009, these certificates of deposit had original maturities of between 120 days and one year on the dates TDS acquired these certificates of deposit and earn interest at annual rates between 0.50% and 1.75%.
Accounts Receivable and Allowance for Doubtful Accounts
U.S. Cellular's accounts receivable primarily consist of amounts owed by customers pursuant to service contracts and for equipment sales, by agents for sales of equipment to them and by other wireless carriers whose customers have used U.S. Cellular's wireless systems.
TDS Telecom's accounts receivable primarily consist of amounts owed by customers for services provided, by connecting companies for carrying interstate and intrastate long-distance traffic on its network, and by interstate and intrastate revenue pools that distribute access charges.
The allowance for doubtful accounts is the best estimate of the amount of probable credit losses related to existing accounts receivable. The allowance is estimated based on historical experience and other factors that could affect collectability. Accounts receivable balances are reviewed on either an aggregate or individual basis for collectability depending on the type of receivable. When it is probable that an account balance will not be collected, the account balance is charged against the allowance for doubtful accounts. TDS does not have any off-balance sheet credit exposure related to its customers.
The changes in the allowance for doubtful accounts during the years ended December 31, 2009, 2008 and 2007 were as follows:
Year Ended December 31,
|
2009 | 2008 | 2007 | ||||||||
|---|---|---|---|---|---|---|---|---|---|---|---|
| |
(Dollars in thousands) |
||||||||||
Beginning Balance |
$ | 19,202 | $ | 21,623 | $ | 25,383 | |||||
Additions, net of recoveries |
115,989 | 83,004 | 74,988 | ||||||||
Deductions |
(97,568 | ) | (85,425 | ) | (78,748 | ) | |||||
Ending Balance |
$ | 37,623 | $ | 19,202 | $ | 21,623 | |||||
Inventory
Inventory primarily consists of handsets stated at the lower of cost or market, with cost determined using the first-in, first-out method and market determined by replacement costs. TDS Telecom's materials and supplies are stated at average cost.
Fair Value Measurements
Effective January 1, 2008, for financial assets and liabilities measured in the Consolidated Balance Sheet at fair value on a recurring basis, TDS adopted the required provisions under GAAP that define "fair value", establish a framework for measuring fair value in the application of GAAP, and expand disclosure about fair value measurements. Effective January 1, 2009, TDS adopted these same provisions for nonfinancial assets and liabilities measured in the Consolidated Balance Sheet at fair value on a nonrecurring basis, and for amounts that are presented only in disclosures. The provisions do not expand the use of fair value measurements in financial statements, but standardize their definition and application in GAAP. The provisions provide that fair value is a market-based measurement and not an entity-specific measurement, based on an exchange transaction in which the entity sells an asset or transfers a liability (exit price). The provisions establish a fair value hierarchy that contains three levels for inputs used in fair value measurements. Level 1 inputs include quoted market prices for identical assets or liabilities in active markets. Level 2 inputs include quoted market prices for similar assets and liabilities in active markets or quoted market prices for identical assets and liabilities in inactive markets. Level 3 inputs are unobservable.
In addition, on January 1, 2008, TDS elected provisions under GAAP that permit companies to choose to measure various financial instruments and certain other items at fair value. At the date the option is elected, entities are required to record a cumulative-effect adjustment to beginning retained earnings. In subsequent periods, for those instruments in which the fair value option is elected, unrealized gains and losses are recorded in the Consolidated Statement of Operations. On January 1, 2008, TDS elected these provisions for its investment in Deutsche Telekom Ordinary Shares, and also for the "collar" portions of the variable prepaid forward contracts ("forward contracts") related to such Deutsche Telekom Ordinary Shares. TDS elected to do this for these items in order to better align the financial statement presentation of the unrealized gains and losses attributable to these items with their underlying economics. The forward contracts were settled and the Deutsche Telekom Ordinary Shares were disposed of in 2008.
Derivative Financial Instruments
TDS has in the past used derivative financial instruments in the form of forward contracts to reduce risks related to fluctuations in market prices of marketable equity securities. TDS did not hold or issue derivative financial instruments for trading purposes. During 2008 and 2007, TDS had forward contracts in place with respect to substantially all TDS' marketable equity security portfolio, hedging the market price risk with respect to the contracted securities. Some of these forward contracts settled in 2007 and the remaining contracts settled in 2008. The downside market risk was hedged at or above the accounting cost basis of the securities.
TDS recognized all of the forward contracts as either assets or liabilities in the Consolidated Balance Sheet and measured those instruments at their fair value. Changes in fair value of those instruments are reported in the Consolidated Statement of Operations or classified as Accumulated other comprehensive income, net of tax, in the Consolidated Balance Sheet, depending on the use of the derivative and whether it qualified for hedge accounting. Qualification for hedge accounting is dependent on whether the hedge is anticipated to be highly effective in achieving offsetting changes in the fair value of the hedged item or cash flows of the asset hedged.
TDS originally designated the embedded collars within the forward contracts related to Deutsche Telekom Ordinary Shares and Vodafone American Depository Receipts ("ADRs") as cash flow hedges. Accordingly, all changes in the fair value of the embedded collars were recorded in Accumulated other comprehensive income, net of income taxes. Subsequently, upon contractual modifications to the terms of the collars of the contracts related to Deutsche Telekom Ordinary Shares in June 2003 and Vodafone ADRs in September 2002, the embedded collars no longer qualified for hedge accounting treatment and all changes in fair value of the collars from the time of the contractual modification to the termination or settlement of the terms of the collars have been included in the Consolidated Statement of Operations.
The VeriSign forward contract was designated as a fair value hedge. Changes in the fair value of the embedded collar were recognized in the Consolidated Statement of Operations.
See Note 3—Fair Value Measurements for more information.
Licenses
Licenses consist of costs incurred in acquiring Federal Communications Commission ("FCC") licenses to provide wireless service. These costs include amounts paid to license applicants and owners of interests in entities awarded licenses and all direct and incremental costs related to acquiring the licenses. Prior to a change in required GAAP in 2009, TDS had also allocated amounts to Licenses in conjunction with step acquisitions related to U.S. Cellular's repurchase of U.S. Cellular Common Shares.
TDS has determined that wireless licenses are indefinite-lived intangible assets and, therefore, not subject to amortization, based on the following factors:
- Radio spectrum is not a depleting asset.
- The ability to use radio spectrum is not limited to any one technology.
- U.S. Cellular and its consolidated subsidiaries are licensed to use radio spectrum through the FCC licensing process, which enables licensees to utilize specified portions of the spectrum for the provision of wireless service.
- U.S. Cellular and its consolidated subsidiaries are required to renew their FCC licenses every ten years or, in some cases, every fifteen years. From the inception of U.S. Cellular to date, all of U.S. Cellular's license renewal applications have been granted by the FCC. Generally, license renewal applications filed by licensees otherwise in compliance with FCC regulations are routinely granted. If, however, a license renewal application is challenged either by a competing applicant for the license or by a petition to deny the renewal application, the license will be renewed if the licensee can demonstrate its entitlement to a "renewal expectancy." Licensees are entitled to such an expectancy if they can demonstrate to the FCC that they have provided "substantial service" during their license term and have "substantially complied" with FCC rules and policies. U.S. Cellular believes that it is probable that its future license renewal applications will be granted.
Goodwill
TDS has goodwill as a result of its acquisitions of wireless markets, the acquisition of operating telephone companies and, prior to 2009, step acquisitions related to U.S. Cellular's repurchase of its common shares. Such goodwill represents the excess of the total purchase price over the fair value of net assets acquired in these transactions.
Goodwill and Licenses Impairment Assessment
Goodwill and licenses must be assessed for impairment annually or more frequently if events or changes in circumstances indicate that such assets might be impaired.
The impairment test for goodwill is a two-step process. The first step compares the fair value of the reporting unit to its carrying value. If the carrying amount exceeds the fair value, the second step of the test is performed to measure the amount of impairment loss, if any. The second step compares the implied fair value of reporting unit goodwill with the carrying amount of that goodwill. To calculate the implied fair value of goodwill in this second step, an enterprise allocates the fair value of the reporting unit to all of the assets and liabilities of that reporting unit (including any unrecognized intangible assets) as if the reporting unit had been acquired in a business combination and the fair value was the price paid to acquire the reporting unit. The excess of the fair value of the reporting unit over the amount assigned to the assets and liabilities of the reporting unit is the implied fair value of goodwill. If the carrying amount of goodwill exceeds the implied fair value of goodwill, an impairment loss is recognized for that difference.
The impairment test for an intangible asset other than goodwill consists of comparing the fair value of the intangible asset to its carrying amount. If the carrying amount exceeds the fair value, an impairment loss is recognized for the difference.
Quoted market prices in active markets are the best evidence of fair value of an intangible asset or reporting unit and are used when available. If quoted market prices are not available, the estimate of fair value is based on the best information available, including prices for similar assets and the use of other valuation techniques. Other valuation techniques include present value analysis, multiples of earnings or revenues, or similar performance measures. The use of these techniques involve assumptions by management about factors that are uncertain including future cash flows, the appropriate discount rate, and other inputs. Different assumptions for these inputs could create materially different results.
Historically, U.S. Cellular completed the required annual impairment assessment of its licenses and goodwill as of April 1 of each year. As a result of the deterioration in the credit and financial markets and the decline of the overall economy in the fourth quarter of 2008, U.S. Cellular performed an interim impairment assessment of licenses and goodwill as of December 31, 2008. Effective April 1, 2009, U.S. Cellular adopted a new accounting policy whereby its annual impairment review of goodwill and indefinite-lived intangible assets will be performed as of November 1 instead of the second quarter of each year. The change in the annual goodwill and indefinite-lived intangible asset impairment testing date was made to better align the annual impairment test with the timing of U.S. Cellular's annual strategic planning process, which allows for a better estimate of the future cash flows used in discounted cash flow models to test for impairment. This change in accounting policy does not delay, accelerate or avoid an impairment charge. Accordingly, U.S. Cellular management believes that this accounting change is preferable under the circumstances.
U.S. Cellular tests goodwill for impairment at the level of reporting referred to as a reporting unit. For purposes of impairment testing of goodwill in 2009, U.S. Cellular identified five reporting units. The five reporting units represent five geographic groupings of FCC licenses, representing five geographic service areas. U.S. Cellular tests licenses for impairment at the level of reporting referred to as a unit of accounting. For purposes of its annual impairment testing of licenses as of November 1, 2009, U.S. Cellular combined its FCC licenses into eighteen units of accounting. Of these, thirteen of such eighteen units of accounting represented geographic groupings of licenses which, because they were not being utilized and, therefore, were not expected to generate cash flows from operating activities in the foreseeable future, were considered separate units of accounting for purposes of impairment testing. The five units of accounting for which licenses are being utilized are referred to as "built licenses" and the thirteen units of accounting for which licenses are not being utilized are referred to as "unbuilt licenses."
For purposes of impairment testing of goodwill, U.S. Cellular prepares valuations of each of the five reporting units. A discounted cash flow approach was used to value each reporting unit, using value drivers and risks specific to the current industry and economic markets. The cash flow estimates incorporated assumptions that market participants would use in their estimates of fair value. Key assumptions made in this process were the discount rate, estimated future cash flows, projected capital expenditures and the terminal growth rate.
In 2009, U.S. Cellular changed its method of estimating the fair value of built licenses for purposes of impairment testing from the multiple period excess cash flow method ("MPECF method") to the build-out method. U.S. Cellular elected to make this change as the build-out method is a more widely used and accepted valuation method in estimating the fair value of licenses for purposes of impairment testing in the wireless industry. U.S. Cellular does not believe the build-out method yields a significantly different estimate of the fair value of licenses than the MPECF method.
The MPECF method estimated the fair value of the units of accounting by measuring the future cash flows of the license groups, reduced by charges for contributory assets such as working capital, trademarks, existing subscribers, fixed assets and assembled workforce to arrive at the economic margin. A contributory asset charge for goodwill was subtracted from the economic margin to arrive at the after-tax excess cash flows applicable to the licenses.
The build-out method estimates the value of licenses by calculating future cash flows from a hypothetical start-up wireless company and assumes that the only assets available upon formation are the underlying licenses. To apply this method, a hypothetical build-out of the company's wireless network, infrastructure, workforce and related costs are projected based on market participant information. Calculated cash flows, along with a terminal value, are discounted to the present and summed to determine the estimated fair value.
For units of accounting which consist of unbuilt licenses, U.S. Cellular prepares estimates of fair value by reference to prices paid in recent auctions and market transactions where available. If such information is not available, the fair value of the unbuilt licenses is assumed to change by the same percentage, and in the same direction, that the fair value of built licenses measured using the build-out method changed during the period.
As a result of updated guidance promulgated by the FASB effective January 1, 2009, TDS did not record any amounts to licenses and goodwill as a result of U.S. Cellular's purchases of U.S. Cellular Common Shares as step acquisitions using purchase accounting during 2009. Prior to January 1, 2009, TDS had recorded amounts as licenses and goodwill as a result of accounting for U.S. Cellular's purchases of U.S. Cellular Common Shares as step acquisitions using purchase accounting. TDS' ownership percentage of U.S. Cellular increases upon these U.S. Cellular share repurchases. The purchase price in excess of the fair value of the net assets acquired is allocated principally to licenses and goodwill. For impairment testing purposes, the additional TDS licenses and goodwill amounts are allocated to the same reporting units and units of accounting used by U.S. Cellular. Consequently, U.S. Cellular's license and goodwill balances reported on a stand-alone basis do not match the TDS consolidated licenses and goodwill balances for U.S. Cellular, and impairment losses recognized by TDS related to U.S. Cellular licenses and goodwill may exceed those recognized by U.S. Cellular.
TDS Telecom has recorded goodwill primarily as a result of the acquisition of operating telephone companies and has assigned this goodwill to its ILEC reporting unit. For the purposes of impairment testing, the publicly-traded guideline company method and the recent transaction method were utilized. The publicly-traded guideline company method develops an indication of value by calculating market pricing multiples for selected publicly-traded companies. The recent transaction method calculates market pricing multiples based upon recent actual acquisitions of similar businesses. In both methods, the developed multiples are applied to the appropriate financial measure of TDS Telecom's ILEC reporting unit to determine the reporting unit's fair value.
Investments in Unconsolidated Entities
Investments in unconsolidated entities consist of investments in which TDS holds a non-controlling ownership interest of 50% or less. TDS follows the equity method of accounting for such investments in which its ownership interest equals or exceeds 20% for corporations and equals or exceeds 3% for partnerships and limited liability companies. The cost method of accounting is followed for such investments in which TDS' ownership interest is less than 20% for corporations and is less than 3% for partnerships and limited liability companies, and for investments for which TDS does not have the ability to exercise significant influence.
For its equity method investments for which financial information is readily available, TDS records its equity in the earnings of the entity in the current period. For its equity method investments for which financial information is not readily available, TDS records its equity in the earnings of the entity on a one quarter lag basis.
Property, Plant and Equipment
Property, plant and equipment is stated at the original cost of construction or purchase including capitalized costs of certain taxes, payroll-related expenses, interest and estimated costs to remove the assets.
Expenditures that enhance the productive capacity of assets in service or extend their useful lives are capitalized and depreciated. Expenditures for maintenance and repairs of assets in service are charged to Cost of services and products or Selling, general and administrative expense, as applicable.
For U.S. Cellular and TDS Telecom's CLEC operations, retirements and disposals of assets are recorded by removing the original cost of the asset (along with the related accumulated depreciation) from plant in service and charging it, together with removal cost less any salvage realized, to Loss on asset disposals, net. TDS Telecom's ILEC operations primarily use a group composite depreciation method. Under this method, when property, plant and equipment is retired, the original cost, net of salvage value, is charged against accumulated depreciation. A loss is recognized to the extent the cost to remove the plant exceeds the amounts established under the asset retirement obligation.
Costs of developing new information systems are capitalized and amortized over their expected economic useful lives.
Depreciation
TDS provides for depreciation using the straight-line method over the estimated useful life of the assets. However, prior to the third quarter of 2007 when TDS Telecom discontinued the use of accounting provisions now included in FASB ASC 980, Regulated Operations ("FASB ASC 980"), TDS Telecom's ILEC operations provided for depreciation according to depreciable rates approved by state public utility commissions. This change did not have a significant impact on TDS Telecom's depreciation expense.
TDS depreciates leasehold improvement assets associated with leased properties over periods ranging from one to thirty years; such periods approximate the shorter of the assets' economic lives or the specific lease terms.
Useful lives of specific assets are reviewed throughout the year to determine if changes in technology or other business changes would warrant accelerating the depreciation of those specific assets. U.S. Cellular and TDS Telecom did not materially change the useful lives of their property, plant and equipment in 2009, 2008 or 2007.
Impairment of Long-lived Assets
TDS reviews long-lived assets for impairment whenever events or changes in circumstances indicate that the assets might be impaired. The impairment test for tangible long-lived assets is a two-step process. The first step compares the carrying value of the asset (or asset group) with the estimated undiscounted cash flows over the remaining asset (or asset group) life. If the carrying value of the asset (or asset group) is greater than the undiscounted cash flows, the second step of the test is performed to measure the amount of impairment loss. The second step compares the carrying value of the asset to its estimated fair value. If the carrying value exceeds the estimated fair value (less cost to sell), an impairment loss is recognized for the difference.
Quoted market prices in active markets are the best evidence of fair value of a tangible long-lived asset and are used when available. If quoted market prices are not available, the estimate of fair value is based on the best information available, including prices for similar assets and the use of other valuation techniques. A present value analysis of cash flow scenarios is often the best available valuation technique. The use of this technique involves assumptions by management about factors that are uncertain including future cash flows, the appropriate discount rate, and other inputs. Different assumptions for these inputs could create materially different results.
Other Assets and Deferred Charges
Other assets and deferred charges primarily represent legal and other charges related to various borrowing instruments, and are amortized over the respective term of each instrument. The amounts for deferred charges included in the Consolidated Balance Sheet at December 31, 2009 and 2008 are shown net of accumulated amortization of $23.0 million and $22.0 million, respectively.
Asset Retirement Obligations
TDS accounts for asset retirement obligations in accordance with GAAP, which requires entities to record the fair value of a liability for legal obligations associated with an asset retirement in the period in which the obligations are incurred. At the time the liability is incurred, TDS records a liability equal to the net present value of the estimated cost of the asset retirement obligation and increases the carrying amount of the related long-lived asset by an equal amount. Over time, the liability is accreted to its present value, and the capitalized cost is depreciated over the useful life of the related asset. Upon settlement of the obligation, any difference between the cost to retire the asset and the recorded liability (including accretion of discount) is recognized in the Consolidated Statement of Operations.
Treasury Shares
Common Shares and Special Common Shares repurchased by TDS are recorded at cost as treasury shares and result in a reduction of equity. Treasury shares are reissued as part of TDS' stock-based compensation programs. When treasury shares are reissued, TDS determines the cost using the first-in, first-out cost method. The difference between the cost of the treasury shares and reissuance price is included in Capital in excess of par value or Retained earnings.
Revenue Recognition
U.S. Cellular
Revenues from wireless operations consist primarily of:
- Charges for access, airtime, roaming, long distance, data and other value added services provided to U.S. Cellular's retail customers and to end users through third-party resellers;
- Charges to carriers whose customers use U.S. Cellular's systems when roaming;
- Sales of equipment and accessories; and
- Amounts received from the Universal Service Fund ("USF") in states where U.S. Cellular has been designated an Eligible Telecommunications Carrier ("ETC").
Revenues related to wireless services are recognized as services are rendered. Revenues billed in advance or in arrears of the services being provided are estimated and deferred or accrued, as appropriate. Revenues from sales of equipment and accessories are recognized when title passes to the agent or end-user customer.
In order to provide better control over handset quality, U.S. Cellular sells handsets to agents. U.S. Cellular provides rebates to agents at the time an agent activates a new customer for U.S. Cellular or retains an existing customer in a transaction involving a handset. U.S. Cellular accounts for anticipated rebates on sales of handsets to agents by reducing revenues at the time of the sale to the agent rather than at the time the agent enrolls a new customer or retains a current customer. Similarly, U.S. Cellular offers certain rebates to retail customers who purchase new handsets. The revenue from a handset sale which includes such a rebate is recorded net of the rebate.
Activation fees charged with the sale of service only, where U.S. Cellular does not also sell a handset to the end user, are deferred and recognized over the average customer life. U.S. Cellular defers recognition of a portion of commission expenses related to activations in the amount of deferred activation fee revenues. This method of accounting provides for matching of revenues from activations to direct incremental costs associated with such activations within each reporting period. The activation fee charged with the sale of equipment and service is allocated to the equipment and service based upon the relative fair values of each item. This generally results in the recognition of the activation fee as additional handset revenue at the time of sale.
ETC revenues recognized in the reporting period represent the amounts which U.S. Cellular is entitled to receive for such period, as determined and approved in connection with U.S. Cellular's designation as an ETC in various states.
TDS Telecom
Revenue from wireline operations consist primarily of charges for:
- The provision of local telephone exchange service;
- Compensation for carrying interstate and intrastate long-distance voice and data traffic on TDS Telecom's local telephone networks, including compensation from Universal Service Funds;
- Leasing, selling, installing and maintaining customer premise equipment;
- Providing billing and collection services;
- Providing broadband services;
- Reselling long-distance services; and
- Selling digital broadcast satellite service.
Revenues are recognized as services are rendered. Activation fees charged are deferred and recognized over the average customer's service period.
TDS Telecom offers some products and services that are provided by third-party vendors, primarily satellite television service. TDS records satellite television service revenue on a net basis.
TDS Telecom offers discounts and incentives to customers who receive certain groupings of products and services (bundled arrangements). These discounts are recognized concurrently with the associated revenue and are allocated to the various products and services in the bundled offering based on their relative fair value. A bundled service offering TDS Telecom currently offers is telephone service, digital subscriber line ("DSL") service and satellite television service.
Discounts and incentives offered by TDS Telecom that are given directly to customers are recorded in the financial statements as a reduction of Operating revenues.
TDS' ILECs participate in revenue pools with other telephone companies for interstate revenue and for certain intrastate revenue. Such pools are funded by toll revenue and/or access charges within state jurisdictions and by access charges in the interstate market. Revenues earned through the various pooling processes are recorded based on estimates following the National Exchange Carrier Association's rules as approved by the FCC.
Amounts Collected from Customers and Remitted to Governmental Authorities
TDS records amounts collected from customers and remitted to governmental authorities net within a tax liability account if the tax is assessed upon the customer and TDS merely acts as an agent in collecting the tax on behalf of the imposing governmental authority. If the tax is assessed upon TDS, then amounts collected from customers as recovery of the tax are recorded in Operating revenues and amounts remitted to governmental authorities are recorded in Selling, general and administrative expenses in the Consolidated Statement of Operations. The amounts recorded gross in revenues that are billed to customers and remitted to governmental authorities totaled $131.1 million, $161.9 million and $147.8 million for 2009, 2008 and 2007, respectively.
Advertising Costs
TDS expenses advertising costs as incurred. Advertising costs totaled $266.5 million, $284.9 million and $240.3 million in 2009, 2008 and 2007, respectively.
Income Taxes
TDS files a consolidated federal income tax return. Deferred taxes are computed using the liability method, whereby deferred tax assets are recognized for future deductible temporary differences and operating loss carryforwards, and deferred tax liabilities are recognized for future taxable temporary differences. Both deferred tax assets and liabilities are measured using the tax rates anticipated to be in effect when the temporary differences reverse. Temporary differences are the differences between the reported amounts of assets and liabilities and their tax bases. Deferred tax assets and liabilities are adjusted for the effects of changes in tax laws and rates on the date of enactment. Deferred tax assets are reduced by a valuation allowance when it is more likely than not that some portion or all of the deferred tax assets will not be realized. TDS evaluates income tax uncertainties, assesses the probability of the ultimate settlement with the applicable taxing authority and records an amount based on that assessment.
Stock-Based Compensation
TDS has established long-term incentive plans, employee stock purchase plans, dividend reinvestment plans, and a non-employee director compensation plan which are described more fully in Note 18—Stock-Based Compensation. These plans are considered compensatory plans; therefore, recognition of compensation costs for grants made under these plans is required. The dividend reinvestment plan of TDS is not considered a compensatory plan, therefore recognition of compensation costs for grants made under this plan is not required.
TDS values its share-based payment transactions using a Black-Scholes valuation model. Stock-based compensation cost recognized during the period is based on the portion of the share-based payment awards that are ultimately expected to vest. Accordingly, stock-based compensation cost recognized has been reduced for estimated forfeitures. Forfeitures are estimated at the time of grant and revised, if necessary, in subsequent periods if actual forfeitures differ from those estimates. Pre-vesting forfeitures and expected life are estimated based on historical experience related to similar awards, giving consideration to the contractual terms of the stock-based awards, vesting schedules and expectations of future employee behavior. TDS believes that its historical experience provides the best estimates of future pre-vesting forfeitures and future expected life. The expected volatility assumption is based on the historical volatility of TDS' common stock over a period commensurate with the expected life. The dividend yield assumption is equal to the dividends declared in the most recent year as a percentage of the share price on the date of grant. The risk-free interest rate assumption is determined using the implied yield for zero-coupon U.S. government issues with a remaining term that approximates the expected life of the stock options.
Compensation cost for stock option awards is recognized over the respective requisite service period of the awards, which is generally the vesting period, on a straight-line basis for each separate vesting portion of the awards as if the awards were, in-substance, multiple awards (graded vesting attribution method).
Operating Leases
TDS is a party to various lease agreements for office space, retail sites, cell sites and equipment that are accounted for as operating leases. Certain leases have renewal options and/or fixed rental increases. Renewal options that are reasonably assured of exercise are included in determining the lease term. TDS accounts for certain operating leases that contain rent abatements, lease incentives and/or fixed rental increases by recognizing lease revenue and expense on a straight-line basis over the lease term.
Recent Accounting Pronouncements
In June 2009, the FASB issued an update to accounting standards now reflected in FASB ASC 810, Consolidation. Subsequently, in December 2009, the FASB issued Accounting Standards Update No. 2009-17, Consolidations (Topic 810)—Improvements to Financial Reporting by Enterprises Involved with Variable Interest Entities ("ASU 2009-17") to formally codify such update. The revised guidance changes how TDS determines when an entity that is insufficiently capitalized or is not controlled through voting or similar rights should be consolidated. TDS has interests in several entities within the scope of these requirements (see Note 6—Variable Interest Entities). TDS adopted this accounting standards update effective January 1, 2010. TDS anticipates that the adoption of this pronouncement will not have a significant impact on its financial position or results of operations.
In October 2009, the FASB issued Accounting Standards Update No. 2009-13, Multiple Deliverable Revenue Arrangements—a consensus of FASB Emerging Issues Task Force ("ASU 2009-13"). ASU 2009-13 addresses how arrangement consideration should be allocated to products and services included in revenue arrangements. It replaces "fair value" with "selling price" in revenue allocation guidance and establishes a selling price hierarchy for determining the selling price of each product or service. ASU 2009-13 will be effective for TDS on January 1, 2011. TDS does not anticipate that this pronouncement will have a significant impact on its financial position or results of operations.
In October 2009, the FASB issued Accounting Standards Update No. 2009-14, Certain Revenue Arrangements that include Software Elements ("ASU 2009-14"). ASU 2009-14 amends accounting and reporting guidance for revenue arrangements involving both tangible products and software that is "more than incidental to the tangible product as a whole". ASU 2009-14 will be effective for TDS on January 1, 2011. TDS does not anticipate that this pronouncement will have a significant impact on its financial position or results of operations.
In January 2010, the FASB issued Accounting Standards Update No. 2010-06, Improving Disclosures about Fair Value Measurements ("ASU 2010-06"). ASU 2010-06 requires new disclosures regarding transfers in and out of Levels 1 and 2 and activity in Level 3 fair value measurements. It also clarifies existing disclosure requirements regarding the level of disaggregation in certain disclosures and inputs and valuation techniques used in FASB ASC 820, Fair Value Measurements and Disclosures. TDS adopted this accounting standards update effective January 1, 2010 for all the disclosure requirements in ASU 2010-06 except the new requirement regarding activity in Level 3 fair value measurements which becomes effective for TDS on January 1, 2011. TDS does not anticipate that this pronouncement will have a significant impact on its financial position or results of operations.
NOTE 2 NONCONTROLLING INTERESTS
Noncontrolling Interests Accounting
Effective January 1, 2009, TDS adopted new required provisions under GAAP related to the accounting and reporting for noncontrolling interests.
Pursuant to this adoption, the following provisions were applied retrospectively to all periods presented in these financial statements:
- TDS reclassified noncontrolling interests, formerly known as "minority interests," from a separate caption between liabilities and equity ("mezzanine section") to a component of equity, with the exception of noncontrolling interests with redemption features, which continue to require mezzanine section presentation. Previously, minority interests generally were reported in the balance sheet in the mezzanine section.
- Consolidated net income and comprehensive income include amounts attributable to both TDS and the noncontrolling interests. Previously, net income attributable to the noncontrolling interests was reported as a deduction in arriving at consolidated net income. This presentation change does not impact the calculation of basic or diluted earnings per share, which continue to be calculated based on Net income attributable to TDS shareholders.
- Shares of TDS held by its subsidiary are reflected as treasury shares in the consolidated financial statements. Previously, these shares were not reflected as issued shares and treasury shares in the consolidated financial statements. As a result, 484,012 Common Shares and 484,012 Special Common Shares were added to both Common and Special Common Shares issued and Treasury Shares in the Consolidated Balance Sheet as of December 31, 2009 and December 31, 2008.
Pursuant to this adoption, the following provisions were applied prospectively effective January 1, 2009:
- All earnings and losses of a subsidiary are attributed to the parent and the noncontrolling interest, even if the losses attributable to the noncontrolling interest result in a deficit noncontrolling interest balance. Previously, any losses exceeding the noncontrolling interest's investment in the subsidiary were attributed to the parent. This change did not have a significant impact on TDS' financial statements in 2009.
- Once control of a subsidiary is obtained, changes in ownership interests in that subsidiary that do not result in a loss of control are accounted for as equity transactions. Previously, decreases in ownership interest in a subsidiary were accounted for as equity transactions, while increases in ownership interests in a subsidiary were accounted for as step acquisitions. Therefore, U.S. Cellular's repurchases of U.S. Cellular Common Shares in 2009 were accounted for as equity transactions in TDS' financial statements, whereby the difference between the fair value of the consideration paid and the related carrying value of the noncontrolling interests was recorded as Capital in excess of par value in TDS' Consolidated Balance Sheet. Previously, these transactions had been recorded as step acquisitions in TDS' financial statements.
The following schedule discloses the effects of net income attributable to TDS shareholders and changes in TDS' ownership interest in U.S. Cellular on TDS' equity for 2009, 2008 and 2007:
Year Ended December 31,
|
2009 | 2008(1) | 2007(1) | ||||||||
|---|---|---|---|---|---|---|---|---|---|---|---|
| |
(Dollars in thousands) |
||||||||||
Net income attributable to TDS shareholders |
$ | 193,902 | $ | 93,541 | $ | 386,112 | |||||
Transfer (to) from the noncontrolling interests Change in TDS' Capital in excess of par value from U.S. Cellular's issuance of U.S. Cellular shares |
(4,709 | ) | (11,179 | ) | (16,959 | ) | |||||
Change in TDS' Capital in excess of par value from U.S. Cellular's repurchase of U.S. Cellular shares |
182 | — | — | ||||||||
Purchase of ownership in subsidiary from noncontrolling interest |
(105 | ) | — | — | |||||||
Net transfers (to) from noncontrolling interests |
(4,632 | ) | (11,179 | ) | (16,959 | ) | |||||
Change from net income attributable to TDS shareholders and transfers (to) from noncontrolling interests |
$ | 189,270 | $ | 82,362 | $ | 369,153 | |||||
| (1) | During 2008 and 2007, U.S. Cellular repurchased U.S. Cellular Common Shares and/or purchased noncontrolling interests in consolidated subsidiaries. TDS accounted for these transactions as step acquisitions, pursuant to GAAP in effect at that time. The amounts recorded in these transactions are reflected in the changes in the balances of Licenses, Goodwill and Customer lists. |
Mandatorily Redeemable Noncontrolling Interests in Finite-Lived Subsidiaries
Under GAAP, certain noncontrolling interests in consolidated entities with finite lives may meet the definition of mandatorily redeemable financial instruments. TDS' consolidated financial statements include certain noncontrolling interests that meet this definition of mandatorily redeemable financial instruments. These mandatorily redeemable noncontrolling interests represent interests held by third parties in consolidated partnerships and limited liability companies ("LLCs"), where the terms of the underlying partnership or LLC agreement provide for a defined termination date at which time the assets of the subsidiary are to be sold, the liabilities are to be extinguished and the remaining net proceeds are to be distributed to the noncontrolling interest holders and TDS in accordance with the respective partnership and LLC agreements. The termination dates of these mandatorily redeemable noncontrolling interests range from 2085 to 2094.
The settlement value of TDS' mandatorily redeemable noncontrolling interests in finite-lived subsidiaries is estimated to be $121.6 million at December 31, 2009. This amount represents the estimate of cash that would be due and payable to settle these noncontrolling interests assuming an orderly liquidation of the finite-lived consolidated partnerships and LLCs on December 31, 2009, net of estimated liquidation costs and it excludes redemption amounts recorded in Noncontrolling interests with redemption features in the Consolidated Balance Sheet. TDS currently has no plans or intentions relating to the liquidation of any of the related partnerships or LLCs prior to their scheduled termination dates. The corresponding carrying value of the mandatorily redeemable noncontrolling interests in finite-lived consolidated partnerships and LLCs at December 31, 2009 is $42.3 million, and is included in Noncontrolling interests in the Consolidated Balance Sheet. The excess of the aggregate settlement value over the aggregate carrying value of these mandatorily redeemable noncontrolling interests is due primarily to the unrecognized appreciation of the noncontrolling interest holders' share of the underlying net assets in the consolidated partnerships and LLCs. Neither the noncontrolling interest holders' share, nor TDS' share, of the appreciation of the underlying net assets of these subsidiaries is reflected in the consolidated financial statements. The estimate of settlement value was based on certain factors and assumptions which are subjective in nature. Changes in those factors and assumptions could result in a materially larger or smaller settlement amount.
NOTE 3 FAIR VALUE MEASUREMENTS
As of December 31, 2009 and 2008, TDS did not have any financial assets or liabilities that were required, under GAAP, to be recorded at fair value on a recurring basis in its Consolidated Balance Sheet. However, TDS has applied the provisions of fair value accounting for purposes of computing the fair value of financial instruments for disclosure purposes. The fair value of financial instruments was as follows:
| |
December 31, 2009 | December 31, 2008 | |||||||||||
|---|---|---|---|---|---|---|---|---|---|---|---|---|---|
| |
Book Value | Fair Value | Book Value | Fair Value | |||||||||
| |
(Dollars in thousands) |
||||||||||||
Cash and cash equivalents |
$ | 670,992 | $ | 670,992 | $ | 777,309 | $ | 777,309 | |||||
Short-term investments |
113,275 | 113,275 | 27,705 | 27,705 | |||||||||
Current portion of long-term debt(1) |
2,173 | 1,782 | 14,618 | 14,715 | |||||||||
Long-term debt(1) |
1,488,196 | 1,461,976 | 1,617,534 | 1,035,554 | |||||||||
| (1) | Excludes capital lease obligations. |
The fair value of cash equivalents included in Cash and cash equivalents and Short-term investments approximates their book value due to the short-term nature of these financial instruments. The fair value of Current portion of long-term debt, excluding capital lease obligations, was estimated using a discounted cash flow analysis. The fair value of Long-term debt, excluding capital lease obligations, was estimated using market prices for TDS' 7.6% Series A notes and 6.625% senior notes, U.S. Cellular's 7.5% and 8.75% senior notes, and discounted cash flow analysis for remaining debt. U.S. Cellular's 8.75% senior notes were redeemed in December 2009.
As of December 31, 2009 and 2008, TDS had certain Licenses recorded at fair value in its Consolidated Balance Sheet as a result of impairment losses recognized at or proximate to these respective dates. For Licenses recorded at fair value, the following table provides information regarding their classification in the fair value hierarchy:
| |
|
Fair Value Measurements Using | |
|||||||||||||
|---|---|---|---|---|---|---|---|---|---|---|---|---|---|---|---|---|
Description
|
December 31, 2009 |
Quoted Prices in Active Markets for Identical Assets (Level 1) |
Significant Other Observable Inputs (Level 2) |
Significant Unobservable Inputs (Level 3) |
Total (Losses)(1) |
|||||||||||
| |
(Dollars in thousands) |
|||||||||||||||
Licenses recorded at fair value |
$ | 57,000 | $ | — | $ | — | $ | 57,000 | $ | (14,000 | ) | |||||
| |
|
Fair Value Measurements Using | |
|||||||||||||
|---|---|---|---|---|---|---|---|---|---|---|---|---|---|---|---|---|
Description
|
December 31, 2008 |
Quoted Prices in Active Markets for Identical Assets (Level 1) |
Significant Other Observable Inputs (Level 2) |
Significant Unobservable Inputs (Level 3) |
Total (Losses)(1) |
|||||||||||
| |
(Dollars in thousands) |
|||||||||||||||
Licenses recorded at fair value |
$ | 1,022,556 | $ | — | $ | — | $ | 1,022,556 | $ | (414,376 | ) | |||||
| (1) | These losses represent the excess carrying value of the Licenses over their estimated fair values at the respective impairment testing dates in the fourth quarters of 2009 and 2008. Such amounts are recorded as Loss on impairment of intangible assets in the Consolidated Statement of Operations. |
See Note 1—Summary of Significant Accounting Policies and Recent Accounting Pronouncements for information regarding the methods and assumptions used to estimate the fair values for Licenses and a description of the levels in the fair value hierarchy.
On January 1, 2008, TDS elected to measure, as permitted by GAAP, its Deutsche Telekom Ordinary Shares and related collars at fair value in its Consolidated Balance Sheet, and recognize future changes in fair value in its Consolidated Statement of Operations. As a result of this election, TDS recorded an adjustment to increase January 1, 2008 beginning retained earnings by $502.7 million, net of $291.2 million of income taxes. This amount reflects an unrealized gain attributable to the Deutsche Telekom Ordinary Shares of $647.3 million, net of income taxes of $374.9 million, offset by an unrealized loss on the related forward contracts of $144.6 million, net of income taxes of $83.7 million. The unrealized loss on the forward contracts was attributable to the periods from inception to June 2003. During such periods the forward contracts qualified as cash flow hedges and the changes in the fair value were recorded as a component of Accumulated other comprehensive income. There were no tax accounting implications to the Consolidated Balance Sheet or Statement of Operations upon this election other than to reclassify the related tax effects from Accumulated other comprehensive income to beginning Retained earnings, as mentioned above.
The following table details the Gain on investments and financial instruments included in the Consolidated Statement of Operations:
Year Ended December 31,
|
2009 | 2008 | 2007 | ||||||||||
|---|---|---|---|---|---|---|---|---|---|---|---|---|---|
| |
(Dollars in thousands) |
||||||||||||
Gains (losses) on marketable equity securities and derivative instruments |
|||||||||||||
Deutsche Telekom: |
|||||||||||||
Gain on disposition of securities(1) |
$ | — | $ | — | $ | 366,684 | |||||||
Loss on the settlement of variable prepaid forward contracts(1) |
— | — | (117,825 | ) | |||||||||
Increase/(decrease) in the fair value of securities (asset)(2) |
— | (294,827 | ) | — | |||||||||
(Increase)/decrease in the fair value of the embedded collars in the variable prepaid forward contracts (liability) |
— | 295,389 | (327,169 | ) | |||||||||
|
— | 562 | (78,310 | ) | |||||||||
Vodafone Group Plc: |
|||||||||||||
Gain on disposition of securities(1) |
— | — | 178,895 | ||||||||||
Loss on the settlement of variable prepaid forward contracts(1) |
— | — | (7,296 | ) | |||||||||
(Increase) in the fair value of the embedded collars in the variable prepaid forward contracts (liability) |
— | — | (24,901 | ) | |||||||||
|
— | — | 146,698 | ||||||||||
VeriSign: |
|||||||||||||
Gain on disposition of securities(1) |
— | — | 6,234 | ||||||||||
Increase in the fair value of securities (asset) |
— | — | 5,171 | ||||||||||
(Increase) in the fair value of the embedded collars in the variable prepaid forward contracts (liability) |
— | — | (4,671 | ) | |||||||||
|
— | — | 6,734 | ||||||||||
Rural Cellular Corporation: |
|||||||||||||
Gain on disposition of securities |
— | 31,724 | — | ||||||||||
Other gains (losses) |
|||||||||||||
Sale of Midwest Wireless Communications, LLC(3) |
— | — | 6,301 | ||||||||||
Other |
— | (691 | ) | — | |||||||||
|
$ | — | $ | 31,595 | $ | 81,423 | |||||||
| (1) | TDS and its subsidiaries held Vodafone ADRs, VeriSign Common Shares and Deutsche Telekom Ordinary Shares which were obtained in connection with the sale of non-strategic investments. TDS entered into a number of variable prepaid forward contracts related to the Vodafone, VeriSign and Deutsche Telekom securities that it held. During 2007 and 2008, all forward contracts related to the Vodafone, VeriSign, and Deutsche Telekom securities were settled, and all remaining shares of these securities were sold. As a result, at December 31, 2008, TDS no longer owned Vodafone ADRs, VeriSign Common Shares and Deutsche Telekom Ordinary Shares, and no longer had any liability or other obligations under the related forward contracts. |
| (2) | On January 1, 2008, TDS elected to record its investment in Deutsche Telekom Ordinary Shares at fair value in the Consolidated Statement of Operations. As a result of this election for the Deutsche Telekom Ordinary Shares, unrealized gains and losses on the shares were recorded in the Consolidated Statement of Operations as a Gain on investments and financial instruments. Prior to January 1, 2008, unrealized gains and losses on the shares were recorded in Accumulated other comprehensive income, a balance sheet account. |
| (3) | On October 3, 2006, U.S. Cellular completed the sale of its interest in Midwest Wireless Communications, LLC ("Midwest Wireless") and recorded a gain of $70.4 million in 2006. An additional gain of $6.3 million was recorded in 2007 in connection with the release of certain proceeds held in escrow at the time of sale. |
NOTE 4 INCOME TAXES
Income tax expense is summarized as follows:
Year Ended December 31,
|
2009 | 2008 | 2007 | ||||||||
|---|---|---|---|---|---|---|---|---|---|---|---|
| |
(Dollars in thousands) |
||||||||||
Current |
|||||||||||
Federal |
$ | 94,803 | $ | 448,041 | $ | 500,638 | |||||
State |
7,520 | 18,338 | 32,190 | ||||||||
Foreign |
— | 1,633 | 19,273 | ||||||||
Deferred |
|||||||||||
Federal |
24,043 | (389,619 | ) | (267,348 | ) | ||||||
State |
7,010 | (48,300 | ) | (15,699 | ) | ||||||
|
$ | 133,376 | $ | 30,093 | $ | 269,054 | |||||
A reconciliation of TDS' income tax expense computed at the statutory rate to the reported income tax expense, and the statutory federal income tax expense rate to TDS' effective income tax expense rate, is as follows:
Year Ended December 31,
|
2009 | 2008 | 2007 | ||||||||||||||||
|---|---|---|---|---|---|---|---|---|---|---|---|---|---|---|---|---|---|---|---|
| |
Amount | Rate | Amount | Rate | Amount | Rate | |||||||||||||
| |
(Dollars in millions) |
||||||||||||||||||
Statutory federal income tax expense and rate |
$ | 135.5 | 35.0 | % | $ | 53.6 | 35.0 | % | $ | 239.9 | 35.0 | % | |||||||
State income taxes, net of federal benefit(1) |
5.7 | 1.5 | (15.2 | ) | (9.9 | ) | 10.6 | 1.6 | |||||||||||
Effect of noncontrolling interests(2) |
(4.0 | ) | (1.1 | ) | (5.1 | ) | (3.3 | ) | 3.0 | 0.5 | |||||||||
Effect of gains (losses) on investments, sales of assets and impairment of assets |
— | — | (3.8 | ) | (2.4 | ) | — | — | |||||||||||
Effect of federal unrecognized tax benefits |
(1.3 | ) | (0.3 | ) | (0.1 | ) | (0.1 | ) | 1.5 | 0.2 | |||||||||
Foreign tax |
— | — | 1.1 | 0.7 | 12.5 | 1.8 | |||||||||||||
Net research tax credit |
(0.1 | ) | — | (0.3 | ) | (0.2 | ) | (0.4 | ) | (0.1 | ) | ||||||||
Other differences, net |
(2.4 | ) | (0.6 | ) | (0.1 | ) | (0.1 | ) | 2.0 | 0.3 | |||||||||
Total income tax expense and rate |
$ | 133.4 | 34.5 | % | $ | 30.1 | 19.7 | % | $ | 269.1 | 39.3 | % | |||||||
| (1) | State income taxes include changes in the valuation allowance which is primarily related to the ability to utilize net operating losses. |
| (2) | Includes a $4.6 million charge in 2007 related to the write-off of deferred tax assets established in prior years for certain partnerships. |
The foreign tax incurred in 2008 and 2007 related to the dividend received from Deutsche Telekom.
TDS' net current deferred income tax asset totaled $29.9 million and $27.8 million at December 31, 2009 and 2008, respectively, and primarily represents the deferred tax effects of accrued liabilities and the allowance for doubtful accounts on customer receivables.
TDS' noncurrent deferred income tax assets and liabilities at December 31, 2009 and 2008 and the temporary differences that gave rise to them were as follows:
Year Ended December 31,
|
2009 | 2008 | ||||||
|---|---|---|---|---|---|---|---|---|
| |
(Dollars in thousands) |
|||||||
Noncurrent deferred tax assets |
||||||||
Net operating loss ("NOL") carryforwards |
$ | 73,894 | $ | 80,946 | ||||
Other |
91,749 | 89,273 | ||||||
|
165,643 | 170,219 | ||||||
Less valuation allowance |
(62,856 | ) | (78,760 | ) | ||||
Total noncurrent deferred tax assets |
102,787 | 91,459 | ||||||
Noncurrent deferred tax liabilities |
||||||||
Property, plant and equipment |
379,958 | 352,011 | ||||||
Partnership investments |
63,719 | 53,217 | ||||||
Licenses |
168,845 | 149,847 | ||||||
Other |
8,027 | 8,007 | ||||||
Total noncurrent deferred tax liabilities |
620,549 | 563,082 | ||||||
Net noncurrent deferred income tax liability |
$ | 517,762 | $ | 471,623 | ||||
At December 31, 2009, TDS and certain subsidiaries had $1,263.5 million of state NOL carryforwards (generating a $69.5 million deferred tax asset) available to offset future taxable income primarily of the individual subsidiaries that generated the losses. The state NOL carryforwards expire between 2010 and 2029. Certain subsidiaries that are not included in the federal consolidated income tax return, but file separate federal tax returns, had federal NOL carryforwards (generating a $4.3 million deferred tax asset) available to offset future taxable income. The federal NOL carryforwards expire between 2010 and 2029. A valuation allowance was established for certain state NOL carryforwards and federal NOL carryforwards since it is more likely than not that a portion of such carryforwards will expire before they can be utilized.
Effective January 1, 2007, TDS adopted new requirements promulgated under GAAP related to accounting for unrecognized tax benefits. In accordance with these provisions, TDS recognized a cumulative effect adjustment of $4.4 million, decreasing its liability for unrecognized tax benefits, interest and penalties and increasing the January 1, 2007 balance of Common stockholders' equity. Of this amount, $20.7 million increased Accumulated other comprehensive income and $16.3 million represents the cumulative reduction of beginning retained earnings.
At December 31, 2009, TDS had $45.0 million in unrecognized tax benefits which, if recognized, would reduce income tax expense by $27.7 million, net of the federal benefit from state income taxes. At December 31, 2008, TDS had $39.2 million in unrecognized tax benefits, which, if recognized, would reduce income tax expense by $25.1 million, net of the federal benefit from state income taxes.
A reconciliation of the beginning and ending amount of unrecognized tax benefits is as follows:
| |
2009 | 2008 | 2007 | ||||||||
|---|---|---|---|---|---|---|---|---|---|---|---|
| |
(Dollars in thousands) |
||||||||||
Balance at January 1 |
$ | 39,234 | $ | 42,129 | $ | 28,430 | |||||
Additions for tax positions of current year |
5,349 | 6,687 | 6,389 | ||||||||
Additions for tax positions of prior years |
4,362 | 4,701 | 8,696 | ||||||||
Reductions for tax positions of prior years |
(3,855 | ) | (11,237 | ) | (928 | ) | |||||
Reductions for settlements of tax positions |
— | (2,884 | ) | (192 | ) | ||||||
Reductions for lapses in statutes of limitations |
(56 | ) | (162 | ) | (266 | ) | |||||
Balance at December 31 |
$ | 45,034 | $ | 39,234 | $ | 42,129 | |||||
Unrecognized tax benefits are included in Accrued taxes and Other deferred liabilities and credits in the Consolidated Balance Sheet.
As of December 31, 2009, TDS believes it is reasonably possible that unrecognized tax benefits could change significantly in the next twelve months. The nature of the uncertainty primarily relates to the exclusion of certain transactions from certain state income taxes due primarily to anticipated closure of state income tax audits and the expiration of statutes of limitation. It is anticipated that these events could reduce unrecognized tax benefits in the range of $0.4 million to $8.9 million.
TDS recognizes accrued interest and penalties related to unrecognized tax benefits in income tax expense. The amounts charged to income tax expense totaled $2.9 million, $4.5 million and $2.1 million in 2009, 2008 and 2007, respectively. Net accrued interest and penalties were $16.8 million and $13.3 million at December 31, 2009 and 2008, respectively.
TDS and its subsidiaries file federal and state income tax returns. In 2008, upon completion of the audit of the TDS consolidated group's federal income tax returns for the years 2002 through 2005, the Internal Revenue Service ("IRS") issued a proposed assessment of income tax. TDS protested the proposed assessment. A tentative resolution has been reached with the IRS, which is subject to review by the Joint Committee on Taxation. Under the tentative resolution, the IRS would concede the proposed adjustments and penalties in full. Pursuant to a provision of the Internal Revenue Code, TDS made a $38 million deposit with the IRS related to this assessment in March 2009 in order to eliminate any potential interest expense subsequent to the deposit. This deposit is included in Other current assets in TDS' Consolidated Balance Sheet at December 31, 2009. Subject to Joint Committee approval of the tentative resolution with the IRS, the deposit made by TDS would be refunded to TDS by the IRS.
NOTE 5 EXTRAORDINARY ITEM
Prior to the third quarter of 2007, TDS Telecom's incumbent local exchange carrier ("ILEC") operations followed the accounting for regulated enterprises prescribed by accounting provisions now included in FASB ASC 980, Regulated Operations ("FASB ASC 980"). This accounting recognizes the economic effects of rate-making actions of regulatory bodies in the financial statements of the TDS Telecom ILEC operations.
During 2007, changes in TDS Telecom's business environment caused competitive forces to surpass regulatory forces such that TDS Telecom concluded that it was no longer reasonable to assume that rates set at levels that will recover the enterprise's cost can be charged to its customers.
TDS Telecom has experienced increasing access line losses due to increasing levels of competition across all of the ILEC service areas. Competition intensified in 2007 from cable and wireless operators who extended their investment beyond major markets to enable a broader range of voice and data services that compete directly with TDS Telecom's service offerings. These alternative telecommunications providers have transformed a pricing structure historically based on the recovery of costs to a pricing structure based on market conditions. Consequently, TDS Telecom has had to alter its strategy to compete in its markets. Specifically, in the third quarter of 2007, TDS Telecom initiated an aggressive program of service bundling and deep discounting and made the decision to voluntarily exit certain revenue pools administered by the FCC-supervised National Exchange Carrier Association in order to achieve additional pricing flexibility to meet competitive pressures.
Based on these material factors impacting its operations, management determined in the third quarter of 2007 that it was no longer appropriate to continue the application of accounting provisions now included in FASB ASC 980 for reporting its financial results. Accordingly, TDS Telecom recorded a non-cash extraordinary gain of $42.8 million, net of taxes of $27.0 million, upon discontinuance of the application of accounting provisions now included in FASB ASC 980. The components of the non-cash extraordinary gain were as follows:
| |
Before Tax Effects |
After Tax Effects |
|||||
|---|---|---|---|---|---|---|---|
| |
(Dollars in thousands) |
||||||
Write off of regulatory cost of removal liability |
$ | 70,107 | $ | 43,018 | |||
Write off of other net regulatory assets |
(259 | ) | (191 | ) | |||
Total |
$ | 69,848 | $ | 42,827 | |||
In conjunction with the discontinuance of the accounting provisions now included in FASB ASC 980, TDS Telecom assessed the useful lives of fixed assets and determined that the impacts of any changes were not significant.
NOTE 6 VARIABLE INTEREST ENTITIES (VIEs)
From time to time, the FCC conducts auctions through which additional spectrum is made available for the provision of wireless services. U.S. Cellular, TDS' subsidiary, participated in spectrum auctions indirectly through its interests in Aquinas Wireless L.P. ("Aquinas Wireless"), King Street Wireless L.P. ("King Street Wireless"), Barat Wireless L.P. ("Barat Wireless") and Carroll Wireless L.P. ("Carroll Wireless"), collectively, the "limited partnerships." Each entity qualified as a "designated entity" and thereby was eligible for bid credits with respect to licenses purchased in accordance with the rules defined by the FCC for each auction. In most cases, the bidding credits resulted in a 25% discount from the gross winning bid.
A summary of the auctions in which each entity participated and the auction results for each of these entities are shown in the table below.
| |
FCC Auction |
Auction End Date |
Date Applications Granted by FCC |
Number of Licenses Won |
||||||||
|---|---|---|---|---|---|---|---|---|---|---|---|---|
Aquinas Wireless |
78 | August 20, 2008 | February 16, 2010 | 5 | ||||||||
King Street Wireless |
73 | March 20, 2008 | December 30, 2009 | 152 | ||||||||
Barat Wireless |
66 | September 18, 2006 | April 30, 2007 | 17 | ||||||||
Carroll Wireless |
58 | February 15, 2005 | January 6, 2006 | 16 | ||||||||
Consolidated VIEs
As of December 31, 2009, TDS consolidates the following VIEs under GAAP:
- Aquinas Wireless;
- King Street Wireless and King Street Wireless, Inc., the general partner of King Street Wireless;
- Barat Wireless and Barat Wireless, Inc., the general partner of Barat Wireless; and
- Carroll Wireless and Carroll PCS, Inc., the general partner of Carroll Wireless.
GAAP establishes certain criteria for consolidation of VIEs when voting control is not present. Specifically, for a VIE, as such term is defined by GAAP, an entity, referred to as the primary beneficiary, that absorbs a majority of the VIE's expected gains or losses is required to consolidate such a VIE. TDS holds a variable interest in the entities listed above due to capital contributions and/or advances it has provided to these entities. Given the significance of these contributions and/or advances in relation to the equity investments at risk, TDS was deemed to be the primary beneficiary of these VIEs under GAAP. Accordingly, these VIEs are consolidated because TDS anticipates benefiting from or absorbing a majority of these VIEs' expected gains or losses.
Following is a summary of the capital contributions and advances made to each entity by TDS as of December 31, 2009 (dollars in thousands). The amounts shown in the table below exclude funds provided to these entities solely from the shareholder of the general partner.
Aquinas Wireless |
$ | 2,132 | ||
King Street Wireless & King Street Wireless, Inc. |
300,604 | |||
Barat Wireless & Barat Wireless, Inc. |
127,485 | |||
Carroll Wireless & Carroll PCS, Inc. |
130,594 | |||
|
$ | 560,815 | ||
The following table presents the classification of the consolidated VIEs' assets and liabilities in TDS' Consolidated Balance Sheet.
December 31,
|
2009 | 2008 | ||||||
|---|---|---|---|---|---|---|---|---|
| |
(Dollars in thousands) |
|||||||
Assets |
||||||||
Cash |
$ | 679 | $ | 684 | ||||
Other current assets |
393 | 63 | ||||||
Licenses |
487,962 | 487,962 | ||||||
Property, plant and equipment |
440 | — | ||||||
Total assets |
$ | 489,474 | $ | 488,709 | ||||
Liabilities |
||||||||
Customer deposits and deferred revenues |
$ | 70 | $ | 63 | ||||
Total liabilities |
$ | 70 | $ | 63 | ||||
Other Related Matters
TDS may agree to make additional capital contributions and/or advances to the VIEs discussed above and/or their general partners to provide additional funding for the development of licenses granted in the various auctions. TDS may finance such amounts with a combination of cash on hand, borrowings under its revolving credit agreement and/or long-term debt. There is no assurance that TDS will be able to obtain additional financing on commercially reasonable terms or at all to provide such financial support.
The general partner of each of these VIEs has the exclusive right to manage, operate and control the limited partnerships and make all decisions to carry on the business of the partnerships; however, the general partner needs consent of the partners to sell or lease certain licenses, to make certain large expenditures, admit other partners, or liquidate the limited partnerships. Based on the current ownership interests, the general partner would need the consent of the U.S. Cellular subsidiary that is a limited partner in each of the respective partnerships.
The limited partnership agreements also provide the general partner with a put option whereby the general partner may require the limited partner, a subsidiary of U.S. Cellular, to purchase its interest in the limited partnership. The general partner's put options related to its interests in Carroll Wireless, Barat Wireless, King Street Wireless and Aquinas Wireless will become exercisable in 2011, 2017, 2019 and 2020 respectively. The put option price is determined pursuant to a formula that takes into consideration fixed interest rates and the market value of U.S. Cellular's Common Shares. Upon exercise of the put option, the general partner is required to repay borrowings due to U.S. Cellular. If the general partner does not elect to exercise its put option, the general partner may trigger an appraisal process in which the limited partner (a subsidiary of U.S. Cellular) may have the right, but not the obligation, to purchase the general partner's interest in the limited partnership at a price and on other terms and conditions specified in the limited partnership agreement. In accordance with requirements under GAAP, TDS is required to calculate a theoretical redemption value for all of the puts assuming they are exercisable at the end of each reporting period, even though such exercise is not contractually permitted. Pursuant to GAAP, this theoretical redemption value, net of amounts payable to U.S. Cellular for loans (and accrued interest thereon) made by U.S. Cellular to the general partners, is recorded as a component of Noncontrolling interests with redemption features in TDS' Consolidated Balance Sheet. Also per GAAP, changes in the redemption value of the put options, net of interest accrued on the loans, are recorded as a component of Net income attributable to noncontrolling interests, net of tax, in TDS' Consolidated Statements of Operations.
See Note 16—Commitments and Contingencies for additional information related to the participation of Carroll Wireless, Barat Wireless and King Street Wireless in Auction 58, Auction 66 and Auction 73, respectively.
These VIEs are in the process of developing long-term business and financing plans. These entities were formed to participate in FCC auctions of wireless spectrum and to fund, establish, and provide wireless service with respect to any FCC licenses won in the auctions. As such, these entities have risks similar to those described in the "Risk Factors" in TDS' Annual Report on Form 10-K.
NOTE 7 EARNINGS PER SHARE
Basic earnings per share is computed by dividing Net income available to common shareholders of TDS by the weighted average number of common shares outstanding during the period. Diluted earnings per share is computed by dividing Net income available to common shareholders of TDS by the weighted average number of common shares outstanding during the period adjusted to include the effect of potentially dilutive securities. Potentially dilutive securities include incremental shares issuable upon exercise of outstanding stock options and the vesting of restricted stock units.
The amounts used in computing earnings per share and the effects of potentially dilutive securities on income and the weighted average number of Common, Special Common and Series A Common Shares are as follows:
Year Ended December 31,
|
2009 | 2008 | 2007 | |||||||||
|---|---|---|---|---|---|---|---|---|---|---|---|---|
| |
(Dollars and shares in thousands, except earnings per share) |
|||||||||||
Basic earnings per share: |
||||||||||||
Net income before extraordinary item attributable to TDS shareholders |
$ | 193,902 | $ | 93,541 | $ | 343,285 | ||||||
Preferred dividend requirement |
(51 | ) | (52 | ) | (52 | ) | ||||||
Income before extraordinary item attributable to common shareholders |
193,851 | 93,489 | 343,233 | |||||||||
Extraordinary item, net of taxes |
— | — | 42,827 | |||||||||
Net income available to common shareholders of TDS used in basic earnings per share |
$ | 193,851 | $ | 93,489 | $ | 386,060 | ||||||
Diluted earnings per share: |
||||||||||||
Net income available to common shareholders of TDS used in basic earnings per share |
$ | 193,851 | $ | 93,489 | $ | 386,060 | ||||||
Noncontrolling interest adjustment(1) |
(455 | ) | (92 | ) | (2,155 | ) | ||||||
Preferred dividend adjustment(2) |
49 | — | 49 | |||||||||
Net income available to common shareholders of TDS used in diluted earnings per share |
$ | 193,445 | $ | 93,397 | $ | 383,954 | ||||||
Weighted average number of shares used in basic earnings per share |
||||||||||||
Common Shares |
51,168 | 53,028 | 52,518 | |||||||||
Special Common Shares |
51,698 | 56,339 | 58,660 | |||||||||
Series A Common Shares |
6,473 | 6,450 | 6,446 | |||||||||
Total |
109,339 | 115,817 | 117,624 | |||||||||
Effects of dilutive securities: |
||||||||||||
Effects of stock options(3) |
50 | 335 | 1,287 | |||||||||
Effects of restricted stock units(4) |
144 | 103 | 168 | |||||||||
Effects of preferred shares(5) |
44 | — | 47 | |||||||||
Weighted average number of shares used in diluted earnings per share |
109,577 | 116,255 | 119,126 | |||||||||
Basic earnings per share attributable to TDS shareholders |
||||||||||||
Net income before extraordinary item attributable to TDS shareholders |
$ | 1.77 | $ | 0.81 | $ | 2.92 | ||||||
Extraordinary item, net of taxes |
— | — | 0.36 | |||||||||
|
$ | 1.77 | $ | 0.81 | $ | 3.28 | ||||||
Diluted earnings per share attributable to TDS shareholders |
||||||||||||
Net income before extraordinary item attributable to TDS shareholders |
$ | 1.77 | $ | 0.80 | $ | 2.86 | ||||||
Extraordinary item, net of taxes |
— | — | 0.36 | |||||||||
|
$ | 1.77 | $ | 0.80 | $ | 3.22 | ||||||
| (1) | The noncontrolling income adjustment reflects the additional noncontrolling share of U.S. Cellular's income computed as if all of U.S. Cellular's issuable securities were outstanding. |
| (2) | The preferred dividend adjustment reflects the dividend reduction in the event any preferred series were dilutive, and therefore converted for shares. |
| (3) | Stock options exercisable into 813,322 Common Shares and 4,237,872 Special Common Shares in 2009, 336,457 Common Shares and 1,829,969 Special Common Shares in 2008, and 106,570 Common Shares and 543,538 Special Common Shares in 2007 were not included in computing Diluted earnings per share because their effects were antidilutive. |
| (4) | Restricted stock units issuable upon vesting into 107,815 Special Common Shares in 2009, 51,503 Special Common Shares in 2008 and 42,389 Special Common Shares in 2007 were not included in computing Diluted earnings per share because their effects were antidilutive. |
| (5) | Preferred shares redeemable for 48,595 Common Shares in 2008 were not included in computing Diluted earnings per share because their effects were antidilutive. |
NOTE 8 ACQUISITIONS, DIVESTITURES AND EXCHANGES
TDS assesses its existing wireless and wireline interests on an ongoing basis with a goal of improving the competitiveness of its operations and maximizing its long-term return on investment. As part of this strategy, TDS reviews attractive opportunities to acquire additional wireless operating markets, telecommunications companies, wireless spectrum and related service businesses. In addition, TDS may seek to divest outright or include in exchanges for other interests those wireless and wireline interests that are not strategic to its long-term success.
TDS' acquisitions for the years ended 2009, 2008 and 2007 and the allocation of the purchase price for these acquisitions were as follows:
| |
|
Allocation of Purchase Price | |||||||||||||||
|---|---|---|---|---|---|---|---|---|---|---|---|---|---|---|---|---|---|
| |
Purchase price(1) |
Goodwill(2) | Licenses | Customer lists |
Net tangible assets (liabilities) |
||||||||||||
| |
(Dollars in thousands) |
||||||||||||||||
2009 |
|||||||||||||||||
U.S. Cellular |
|||||||||||||||||
Licenses |
$ | 15,750 | $ | — | $ | 15,750 | $ | — | $ | — | |||||||
TDS Telecom |
|||||||||||||||||
ILEC businesses |
10,855 | 289 | — | 3,610 | 6,956 | ||||||||||||
ILEC other |
14 | 14 | — | — | — | ||||||||||||
Total |
$ | 26,619 | $ | 303 | $ | 15,750 | $ | 3,610 | $ | 6,956 | |||||||
2008 |
|||||||||||||||||
U.S. Cellular |
|||||||||||||||||
FCC Auction 73 licenses(3) |
$ | 300,479 | $ | — | $ | 300,479 | $ | — | $ | — | |||||||
Other licenses |
32,340 | — | 32,340 | — | — | ||||||||||||
Businesses |
9,152 | 2,963 | 4,803 | 1,045 | 341 | ||||||||||||
TDS Telecom |
|||||||||||||||||
ILEC businesses |
61,199 | 22,206 | — | 14,299 | 24,694 | ||||||||||||
ILEC other |
121 | 121 | — | — | — | ||||||||||||
Total |
$ | 403,291 | $ | 25,290 | $ | 337,622 | $ | 15,344 | $ | 25,035 | |||||||
2007 |
|||||||||||||||||
U.S. Cellular |
|||||||||||||||||
Licenses |
$ | 3,195 | $ | — | $ | 3,195 | $ | — | $ | — | |||||||
Businesses |
18,283 | 5,864 | 7,900 | 1,560 | 2,959 | ||||||||||||
TDS Telecom |
|||||||||||||||||
ILEC Other |
200 | 259 | — | — | (59 | ) | |||||||||||
Non-reportable segment |
|||||||||||||||||
Businesses |
2,087 | 1,522 | — | — | 565 | ||||||||||||
Total |
$ | 23,765 | $ | 7,645 | $ | 11,095 | $ | 1,560 | $ | 3,465 | |||||||
| (1) | Cash amounts paid for the acquisitions may differ from the purchase price due to cash acquired in the transactions and working capital adjustments as of December 31 of the respective year. |
| (2) | $1.6 million and $6.9 million of the goodwill was amortizable for income tax purposes in 2008 and 2007, respectively. No transactions resulted in tax amortizable goodwill in 2009. |
| (3) | King Street Wireless L.P., an entity in which a subsidiary of U.S. Cellular is a limited partner with a 90% partnership interest, made these payments. U.S. Cellular loaned these funds to the partnership and the general partner and made direct capital investments to fund the auction payment. |
NOTE 9 LICENSES AND GOODWILL
Changes in TDS' licenses and goodwill are presented below. See Note 8—Acquisitions, Divestitures and Exchanges for information regarding transactions which affected licenses and goodwill during the periods.
Licenses
Year Ended December 31,
|
2009 | 2008 | |||||||
|---|---|---|---|---|---|---|---|---|---|
| |
(Dollars in thousands) |
||||||||
Consolidated beginning balance |
$ | 1,441,440 | $ | 1,516,629 | |||||
U.S. Cellular(1) |
|||||||||
Balance, beginning of year |
1,438,640 | 1,513,829 | |||||||
Acquisitions |
15,750 | 337,622 | |||||||
Impairment |
(14,000 | ) | (414,376 | ) | |||||
Step acquisition allocation adjustment(1) |
— | 1,565 | |||||||
Other |
(165 | ) | — | ||||||
|
1,585 | (75,189 | ) | ||||||
Balance, end of year |
1,440,225 | 1,438,640 | |||||||
TDS Telecom—CLEC |
|||||||||
Balance, beginning and end of year |
2,800 |
2,800 |
|||||||
Net change—consolidated |
1,585 |
(75,189 |
) |
||||||
Consolidated ending balance |
$ | 1,443,025 | $ | 1,441,440 | |||||
Goodwill
Year Ended December 31,
|
2009 | 2008 | |||||||
|---|---|---|---|---|---|---|---|---|---|
| |
(Dollars in thousands) |
||||||||
Consolidated beginning balance |
$ | 1,070,419 | $ | 1,042,469 | |||||
Accumulated impairment losses(2) |
(363,340 | ) | (363,340 | ) | |||||
|
707,079 | 679,129 | |||||||
U.S. Cellular(1) |
|||||||||
Balance, beginning of year |
616,764 | 610,316 | |||||||
Accumulated impairment losses |
(333,900 | ) | (333,900 | ) | |||||
|
282,864 | 276,416 | |||||||
Acquisitions |
— | 2,963 | |||||||
Step acquisition allocation adjustment(1) |
— | 3,485 | |||||||
Other |
458 | — | |||||||
Balance, end of year |
617,222 | 616,764 | |||||||
Accumulated impairment losses |
(333,900 | ) | (333,900 | ) | |||||
|
283,322 | 282,864 | |||||||
TDS Telecom |
|||||||||
Balance, beginning of year |
449,853 | 428,351 | |||||||
Accumulated impairment losses(2) |
(29,440 | ) | (29,440 | ) | |||||
|
420,413 | 398,911 | |||||||
Acquisitions |
303 | 22,327 | |||||||
Other |
— | (825 | ) | ||||||
Balance, end of year |
450,156 | 449,853 | |||||||
Accumulated impairment losses |
(29,440 | ) | (29,440 | ) | |||||
|
420,716 | 420,413 | |||||||
Other(3) |
|||||||||
Balance, beginning and end of year |
3,802 | 3,802 | |||||||
Accumulated impairment losses |
— | — | |||||||
|
3,802 | 3,802 | |||||||
Net change—consolidated |
761 | 27,950 | |||||||
Consolidated ending balance |
1,071,180 | 1,070,419 | |||||||
Accumulated impairment losses |
(363,340 | ) | (363,340 | ) | |||||
|
$ | 707,840 | $ | 707,079 | |||||
| (1) | Prior to January 1, 2009, TDS accounted for U.S. Cellular's share repurchases as step acquisitions, allocating a portion of the share repurchase value to TDS licenses and goodwill, as required by GAAP in effect at that time. Therefore, prior to January 1, 2009, U.S. Cellular's balances included licenses and goodwill allocated from TDS as a result of step acquisitions. See Note 17—Common Stockholders' Equity for a discussion of U.S. Cellular's purchases of its Common Shares. For impairment testing purposes, the additional TDS licenses and goodwill amounts are allocated to the same units of accounting and reporting units used by U.S. Cellular. In 2003, U.S. Cellular's licenses and goodwill impairment tests did not result in an impairment loss on a stand-alone basis. However, when the licenses and goodwill amounts recorded at TDS, as a result of step acquisitions, were added to the U.S. Cellular licenses and goodwill for impairment testing at the TDS consolidated level in 2003, an impairment loss on licenses and goodwill was recorded. Consequently, U.S. Cellular's licenses and goodwill balance reported on a stand-alone basis does not match the TDS consolidated licenses and goodwill balance related to U.S. Cellular. |
| (2) | The entire goodwill balance of $29.4 million at the TDS Telecom CLEC business segment was impaired in 2004. The remaining goodwill balance at TDS Telecom is attributed to the ILEC business segment. |
| (3) | "Other" consists of goodwill related to Suttle-Straus. |
See Note 1—Summary of Significant Accounting Policies and Recent Accounting Pronouncements for a description of accounting policies related to licenses and goodwill.
2009 Impairment Assessment
In 2009, TDS completed the required annual impairment assessment of its licenses and goodwill in the fourth quarter. The assessment resulted in no impairment of goodwill and an impairment loss of $14.0 million on licenses. The entire impairment loss relates to licenses in developed operating markets (built licenses).
2008 Impairment Assessment
In 2008, TDS completed the required annual impairment assessment of its licenses and goodwill in the second quarter. As a result of the deterioration in the credit and financial markets and the decline of the overall economy in the fourth quarter of 2008, TDS performed an interim impairment assessment of licenses and goodwill as of December 31, 2008. The assessment resulted in no impairment of goodwill and an impairment loss of $414.4 million on licenses. Of the $414.4 million, $357.6 million relates to licenses in developed operating markets (built licenses) and $56.8 million relates to licenses that are not being utilized (unbuilt licenses). The TDS impairment amount exceeded the U.S. Cellular impairment amount recorded on a stand-alone basis due to step acquisition allocation adjustments, which increased the carrying value of licenses at the TDS level.
2007 Impairment Assessment
During 2007, TDS recognized a $2.1 million impairment of licenses as a result of its annual impairment assessment in the second quarter of 2007. In addition, TDS recognized an impairment of licenses of $20.8 million in the fourth quarter of 2007 in conjunction with an exchange of licenses with Sprint Nextel. No impairment of goodwill was recognized in 2007.
NOTE 10 MARKETABLE EQUITY SECURITIES AND VARIABLE PREPAID FORWARD CONTRACTS
As of December 31, 2009 and 2008, TDS did not own either marketable equity securities or variable prepaid forward contracts.
Prior to August 7, 2008, TDS and its subsidiaries held 719,396 common shares of Rural Cellular Corporation ("RCC"). On August 7, 2008, RCC was acquired by Verizon Wireless, with shareholders of RCC receiving cash of $45 per share in exchange for each RCC share owned. As a result of this exchange, TDS received total cash proceeds of $32.4 million and recognized a pre-tax gain of $31.7 million in August 2008.
In 2002 and 2003, TDS entered into variable prepaid forward contracts ("forward contracts") related to the Deutsche Telekom Ordinary Shares it held. The economic hedge risk management objective of the forward contracts was to hedge the value of the marketable equity securities from losses due to decreases in the market prices of the securities while retaining a share of gains from increases in the market prices of such securities. The downside risk was hedged at or above the accounting cost basis of the securities. The principal amount of the forward contracts was accounted for as a loan. The forward contracts contained embedded collars that were bifurcated and accounted for as derivatives.
In the first half of 2008, the forward contracts related to 85,969,689 Deutsche Telekom Ordinary Shares were settled through a combination of delivery of 73,462,167 Deutsche Telekom Ordinary Shares relating to the forward contracts and cash payments. TDS sold the remaining 12,507,522 Deutsche Telekom Ordinary Shares and realized cash proceeds of $226.6 million from the sale. This amount was offset by $17.4 million and $47.4 million of cash payments paid to settle the collar (derivative liability) and debt portions of certain variable prepaid forward contracts, respectively, for which cash was delivered upon settlement.
During 2007, the forward contracts related to TDS' investments in Vodafone ADRs, VeriSign Common Shares and a portion of the Deutsche Telekom Ordinary Shares matured. TDS delivered a substantial majority of such shares in settlement of the forward contracts and disposed of the remaining shares, which resulted in cash proceeds of $92.0 million.
NOTE 11 INVESTMENTS IN UNCONSOLIDATED ENTITIES
Investments in unconsolidated entities consist of amounts invested in wireless and wireline entities which are accounted for using either the equity or cost method as shown in the following table:
December 31,
|
2009 | 2008 | ||||||
|---|---|---|---|---|---|---|---|---|
| |
(Dollars in thousands) |
|||||||
Equity method investments: |
||||||||
Capital contributions, loans and advances |
$ | 32,244 | $ | 32,942 | ||||
Goodwill |
6,630 | 6,630 | ||||||
Cumulative share of income |
798,670 | 708,239 | ||||||
Cumulative share of distributions |
(649,314 | ) | (557,612 | ) | ||||
|
188,230 | 190,199 | ||||||
Cost method investments |
15,569 | 15,569 | ||||||
Total investments in unconsolidated entities |
$ | 203,799 | $ | 205,768 | ||||
Investments in unconsolidated entities include goodwill and costs in excess of the underlying book value of certain investments.
Equity in earnings of unconsolidated entities totaled $90.7 million, $89.8 million and $91.8 million in 2009, 2008 and 2007, respectively; of those amounts, TDS' investment in the Los Angeles SMSA Limited Partnership ("LA Partnership") contributed $64.7 million, $66.1 million and $71.2 million in 2009, 2008 and 2007, respectively. TDS held a 5.5% ownership interest in the LA Partnership throughout and at the end of each of these years.
The following tables, which are based on information provided in part by third parties, summarize the combined assets, liabilities and equity, and the combined results of operations of TDS' equity method investments:
December 31,
|
2009 | 2008 | ||||||
|---|---|---|---|---|---|---|---|---|
| |
(Dollars in thousands) |
|||||||
Assets |
||||||||
Current |
$ | 452,000 | $ | 429,000 | ||||
Due from affiliates |
468,000 | 417,000 | ||||||
Property and other |
1,921,000 | 1,988,000 | ||||||
|
$ | 2,841,000 | $ | 2,834,000 | ||||
Liabilities and Equity |
||||||||
Current liabilities |
$ | 251,000 | $ | 243,000 | ||||
Deferred credits |
71,000 | 75,000 | ||||||
Long-term liabilities |
40,000 | 44,000 | ||||||
Long-term capital lease obligations |
43,000 | 50,000 | ||||||
Partners' capital and stockholders' equity |
2,436,000 | 2,422,000 | ||||||
|
$ | 2,841,000 | $ | 2,834,000 | ||||
Year Ended December 31,
|
2009 | 2008 | 2007 | ||||||||
|---|---|---|---|---|---|---|---|---|---|---|---|
| |
(Dollars in thousands) |
||||||||||
Results of Operations |
|||||||||||
Revenues |
$ | 4,815,000 | $ | 4,784,000 | $ | 4,519,000 | |||||
Operating expenses |
3,437,000 | 3,376,000 | 3,092,000 | ||||||||
Operating income |
1,378,000 | 1,408,000 | 1,427,000 | ||||||||
Other income (expense) |
42,000 | 26,000 | 32,000 | ||||||||
Net income |
$ | 1,420,000 | $ | 1,434,000 | $ | 1,459,000 | |||||
NOTE 12 PROPERTY, PLANT AND EQUIPMENT
U.S. Cellular's Property, plant and equipment in service and under construction, and related accumulated depreciation, as of December 31, 2009 and 2008 were as follows:
December 31,
|
Useful Lives | 2009 | 2008 | |||||||
|---|---|---|---|---|---|---|---|---|---|---|
| |
(Years) |
(Dollars in thousands) |
||||||||
Land |
N/A | $ | 26,017 | $ | 26,045 | |||||
Buildings |
20 | 300,285 | 275,307 | |||||||
Leasehold and land improvements |
1-30 | 976,828 | 905,936 | |||||||
Cell site equipment |
6-25 | 2,394,222 | 2,567,271 | |||||||
Switching equipment |
1-8 | 862,826 | 877,664 | |||||||
Office furniture and equipment |
3-5 | 549,871 | 527,592 | |||||||
Other operating equipment |
5-25 | 341,988 | 302,640 | |||||||
System development |
3-7 | 258,073 | 259,860 | |||||||
Work in process |
N/A | 174,197 | 142,068 | |||||||
|
5,884,307 | 5,884,383 | ||||||||
Accumulated depreciation |
(3,282,969 | ) | (3,264,007 | ) | ||||||
|
$ | 2,601,338 | $ | 2,620,376 | ||||||
U.S. Cellular's depreciation and amortization expense related to Property, plant and equipment totaled $554.9 million, $560.3 million and $559.0 million in 2009, 2008 and 2007, respectively.
In 2009, 2008 and 2007, U.S. Cellular's Loss on asset disposals, net included charges of $15.2 million, $23.4 million and $19.4 million, respectively, related to disposals of assets, trade-ins of older assets for replacement assets and other retirements of assets from service. In 2007, U.S. Cellular conducted a physical inventory of its significant cell site and switching assets. As a result, Loss on asset disposals, net also included a charge of $14.6 million in 2007 reflecting the results of the physical inventory and related valuation and reconciliation.
TDS Telecom's Property, plant and equipment in service and under construction, and related accumulated depreciation, as of December 31, 2009 and 2008 were as follows:
December 31,
|
Useful Lives | 2009 | 2008 | |||||||
|---|---|---|---|---|---|---|---|---|---|---|
| |
(Years) |
(Dollars in thousands) |
||||||||
Cable and wire |
15-20 | $ | 1,375,201 | $ | 1,339,110 | |||||
Central office equipment |
5-12 | 953,211 | 908,178 | |||||||
Office furniture and equipment |
5-10 | 87,318 | 93,511 | |||||||
Systems development |
5-7 | 154,258 | 145,481 | |||||||
Land |
N/A | 6,557 | 6,274 | |||||||
Buildings |
30 | 79,352 | 78,808 | |||||||
Other equipment |
10-15 | 89,116 | 85,693 | |||||||
Work in process |
N/A | 46,877 | 51,648 | |||||||
|
2,791,890 | 2,708,703 | ||||||||
Accumulated depreciation |
(1,911,512 | ) | (1,790,249 | ) | ||||||
|
$ | 880,378 | $ | 918,454 | ||||||
The provision for TDS Telecom's ILEC companies' depreciation as a percentage of depreciable property was 5.8% in 2009, 5.7% in 2008 and 6.0% in 2007. TDS Telecom's depreciation and amortization expense related to Property, plant and equipment totaled $161.4 million, $154.5 million and $156.4 million in 2009, 2008 and 2007, respectively.
Corporate and other Property, plant and equipment in service and under construction, and related accumulated depreciation, as of December 31, 2009 and 2008 were as follows:
December 31,
|
2009 | 2008 | |||||
|---|---|---|---|---|---|---|---|
| |
(Dollars in thousands) |
||||||
Property, plant and equipment |
$ | 84,130 | $ | 87,302 | |||
Accumulated depreciation |
(58,001 | ) | (57,208 | ) | |||
Total |
$ | 26,129 | $ | 30,094 | |||
Corporate and other fixed assets consist of assets at the TDS corporate offices and Suttle-Straus. Corporate and other depreciation and amortization expense related to Property, plant and equipment totaled $7.8 million, $8.7 million and $8.8 million in 2009, 2008 and 2007, respectively.
NOTE 13 ASSET RETIREMENT OBLIGATION
Asset retirement obligations are included in Other deferred liabilities and credits in the Consolidated Balance Sheet.
In 2009 and 2008, U.S. Cellular and TDS Telecom performed a review of the assumptions and estimated costs related to asset retirement obligations. The results of the reviews (identified as "Revisions in estimated cash outflows") and other changes in asset retirement obligations during 2009 and 2008 are shown in the table below.
| |
U.S. Cellular |
TDS Telecom |
TDS Consolidated |
||||||||
|---|---|---|---|---|---|---|---|---|---|---|---|
| |
(Dollars in thousands) |
||||||||||
2009 |
|||||||||||
Beginning Balance |
$ | 148,982 | $ | 50,551 | $ | 199,533 | |||||
Additional liabilities accrued |
3,935 | 644 | 4,579 | ||||||||
Revisions in estimated cash outflows |
(47 | ) | — | (47 | ) | ||||||
Acquisitions of assets |
— | 916 | 916 | ||||||||
Disposition of assets |
(1,128 | ) | (388 | ) | (1,516 | ) | |||||
Accretion expense |
10,923 | 3,620 | 14,543 | ||||||||
Ending Balance |
$ | 162,665 | $ | 55,343 | $ | 218,008 | |||||
2008 |
|||||||||||
Beginning Balance |
$ | 126,844 | $ | 46,624 | $ | 173,468 | |||||
Additional liabilities accrued |
5,310 | 148 | 5,458 | ||||||||
Revisions in estimated cash outflows |
8,321 | — | 8,321 | ||||||||
Acquisitions of assets |
419 | 741 | 1,160 | ||||||||
Disposition of assets |
(1,224 | ) | (272 | ) | (1,496 | ) | |||||
Accretion expense |
9,312 | 3,310 | 12,622 | ||||||||
Ending Balance |
$ | 148,982 | $ | 50,551 | $ | 199,533 | |||||
NOTE 14 DEBT
Notes Payable
Prior to June 30, 2009, TDS had a $600 million revolving credit facility available for general corporate purposes. On June 30, 2009, TDS entered into a new $400 million revolving credit agreement with certain lenders and other parties. As a result, TDS' $600 million revolving credit agreement, which was due to expire in December 2009, was terminated on June 30, 2009 as a condition of entering into the new agreement. The new revolving credit agreement provides TDS with a $400 million senior revolving credit facility for working capital, acquisitions and other corporate purposes and to refinance any existing debt of TDS. Amounts under the new revolving credit facility may be borrowed, repaid and reborrowed from time to time from and after June 30, 2009 until maturity in June 2012. At December 31, 2009, TDS had no outstanding borrowings and $3.4 million of outstanding letters of credit under the new revolving credit facility, leaving $396.6 million available for use. Borrowings under the new revolving credit facility bear interest at the London InterBank Offered Rate ("LIBOR") (or, at TDS' option, an alternate "Base Rate" as defined in the new revolving credit agreement) plus a contractual spread based on TDS' credit rating. TDS may select borrowing periods of either one, two, three or six months (or other period of twelve months or less requested by TDS if approved by the lenders). At December 31, 2009, the one-month LIBOR was 0.23% and the contractual spread was 300 basis points. If TDS provides less than three business days notice of intent to borrow, interest on borrowings is at the Base Rate plus the contractual spread (the Base Rate was 3.25% at December 31, 2009). The new revolving credit facility required TDS to pay fees at an aggregate rate of 1.6% of the total $400 million facility in 2009. Total fees paid under the new and previous TDS revolving credit facilities were $7.0 million, $1.5 million and $2.4 million in 2009, 2008 and 2007, respectively.
Prior to June 30, 2009, U.S. Cellular had a $700 million revolving credit facility available for general corporate purposes. On June 30, 2009, U.S. Cellular entered into a new $300 million revolving credit agreement with certain lenders and other parties. As a result, U.S. Cellular's $700 million revolving credit agreement, which was due to expire in December 2009, was terminated on June 30, 2009 as a condition of entering into the new agreement. The new revolving credit agreement provides U.S. Cellular with a $300 million senior revolving credit facility for working capital, acquisitions and other corporate purposes and to refinance any existing debt of U.S. Cellular. Amounts under the new revolving credit facility may be borrowed, repaid and reborrowed from time to time from and after June 30, 2009 until maturity in June 2012. At December 31, 2009, U.S. Cellular had no outstanding borrowings and $0.2 million of outstanding letters of credit under the new revolving credit facility, leaving $299.8 million available for use. Borrowings under the new revolving credit facility bear interest at the LIBOR (or, at U.S. Cellular's option, an alternate "Base Rate" as defined in the new revolving credit agreement) plus a contractual spread based on U.S. Cellular's credit rating. U.S. Cellular may select borrowing periods of either one, two, three or six months (or other period of twelve months or less requested by U.S. Cellular if approved by the lenders). At December 31, 2009, the one-month LIBOR was 0.23% and the contractual spread was 300 basis points. If U.S. Cellular provides less than three business days notice of intent to borrow, interest on borrowings is at the Base Rate plus the contractual spread (the Base Rate was 3.25% at December 31, 2009). The new revolving credit facility required U.S. Cellular to pay fees at an aggregate rate of 1.7% of the total $300 million facility in 2009. Total fees paid under the new and previous U.S. Cellular revolving credit facilities were $5.9 million, $1.7 million and $2.8 million in 2009, 2008 and 2007, respectively.
Information concerning notes payable under the TDS and U.S. Cellular new and prior revolving credit facilities is shown in the table below:
Year Ended December 31,
|
2009 | 2008 | |||||
|---|---|---|---|---|---|---|---|
| |
(Dollars in thousands) |
||||||
Balance at the end of the year |
$ | — | $ | — | |||
Weighted average interest rate at the end of the year |
N/A | N/A | |||||
Maximum amount outstanding during the year |
$ | — | $ | 100,000 | |||
Average amount outstanding during the year(1) |
$ | — | $ | 20,833 | |||
Weighted average interest rate during the year(1) |
N/A | 3.38 | % | ||||
| (1) | The average was computed based on month-end balances. |
TDS' and U.S. Cellular's interest cost on their new revolving credit facilities is subject to increase if their current credit ratings from Standard & Poor's Rating Services, Moody's Investors Service or Fitch Ratings are lowered, and is subject to decrease if the ratings are raised. The new credit facilities would not cease to be available nor would the maturity date accelerate solely as a result of a downgrade in TDS' or U.S. Cellular's credit rating. However, a downgrade in TDS' or U.S. Cellular's credit rating could adversely affect their ability to renew the new credit facilities or obtain access to other credit facilities in the future.
The new revolving credit facilities have commitment fees based on the senior unsecured debt ratings assigned to TDS and U.S. Cellular by certain ratings agencies. The range of the commitment fees is 0.25% to 0.75% of the unused portions of the new revolving credit facilities.
TDS incurred costs of $10.1 million in conjunction with obtaining the new credit facilities, and such costs are amortized on a straight line basis over the three-year term of the facilities.
The maturity date of any borrowings under the TDS and U.S. Cellular new revolving credit facilities would accelerate in the event of a change in control.
The continued availability of the new revolving credit facilities requires TDS and U.S. Cellular to comply with certain negative and affirmative covenants, maintain certain financial ratios and make representations regarding certain matters at the time of each borrowing. TDS and U.S. Cellular believe they were in compliance as of December 31, 2009 with all covenants and other requirements set forth in the new revolving credit facilities.
In connection with U.S. Cellular's new revolving credit facility, TDS and U.S. Cellular entered into a subordination agreement dated June 30, 2009 together with the administrative agent for the lenders under U.S. Cellular's new revolving credit agreement. Pursuant to this subordination agreement, (a) any consolidated funded indebtedness from U.S. Cellular to TDS will be unsecured and (b) any (i) consolidated funded indebtedness from U.S. Cellular to TDS (other than "refinancing indebtedness" as defined in the subordination agreement) in excess of $105,000,000, and (ii) refinancing indebtedness in excess of $250,000,000, will be subordinated and made junior in right of payment to the prior payment in full of obligations to the lenders under U.S. Cellular's new revolving credit agreement. As of December 31, 2009, U.S. Cellular had no outstanding consolidated funded indebtedness or refinancing indebtedness that was subordinated to the revolving credit agreement pursuant to the subordination agreement.
Long-Term Debt
Long-term debt at December 31, 2009 and 2008 was as follows:
December 31,
|
2009 | 2008 | |||||||
|---|---|---|---|---|---|---|---|---|---|
| |
(Dollars in thousands) |
||||||||
Telephone and Data Systems, Inc. (Parent): |
|||||||||
6.625% senior notes, maturing 2045 |
$ | 116,250 | $ | 116,250 | |||||
7.6% Series A notes, maturing in 2041 |
500,000 | 500,000 | |||||||
Purchase contracts, averaging 6.0%, due through 2021 |
1,097 | 1,097 | |||||||
Total Parent |
617,347 | 617,347 | |||||||
Subsidiaries: |
|||||||||
U.S. Cellular— |
|||||||||
6.7% senior notes maturing in 2033 |
544,000 | 544,000 | |||||||
Unamortized discount |
(10,798 | ) | (11,252 | ) | |||||
|
533,202 | 532,748 | |||||||
7.5% senior notes, maturing in 2034 |
330,000 | 330,000 | |||||||
8.75% senior notes |
— | 130,000 | |||||||
Obligation on capital leases |
4,396 | 4,146 | |||||||
Other, 9.0% |
— | 10,000 | |||||||
TDS Telecom— |
|||||||||
Rural Utilities Service ("RUS") and other notes |
2,671 | 3,109 | |||||||
Other Subsidiaries— |
|||||||||
Long-term notes, 2.7% to 10.6%, due through 2012 |
7,801 | 9,409 | |||||||
Total Subsidiaries |
878,070 | 1,019,412 | |||||||
Total long-term debt |
1,495,417 | 1,636,759 | |||||||
Less: Current portion of long-term debt |
2,509 | 15,337 | |||||||
Total long-term debt excluding current portion |
$ | 1,492,908 | $ | 1,621,422 | |||||
Telephone and Data Systems, Inc. (Parent)
The unsecured 6.625% senior notes, issued in 2005, are due March 31, 2045. Interest on the notes is payable quarterly. TDS may redeem the notes, in whole or in part, at any time on or after March 31, 2010, at a redemption price equal to 100% of the principal amount redeemed plus accrued and unpaid interest.
The unsecured 7.6% Series A notes, issued in 2001, are due December 1, 2041. Interest is payable quarterly. The notes are redeemable by TDS at any time at 100% of the principal amount plus accrued and unpaid interest.
Subsidiaries—U.S. Cellular
The unsecured 6.7% senior notes are due December 15, 2033. Interest is paid semi-annually. U.S. Cellular may redeem the notes, in whole or in part, at any time prior to maturity at a redemption price equal to the greater of (a) 100% of the principal amount of such notes, plus accrued but unpaid interest, or (b) the sum of the present values of the remaining scheduled payments of principal and interest thereon discounted to the redemption date on a semi-annual basis at the Treasury Rate plus 30 basis points.
The unsecured 7.5% senior notes are due June 15, 2034. Interest on the notes is payable quarterly. U.S. Cellular may redeem the notes, in whole or in part, at any time on or after June 17, 2009, at a redemption price equal to 100% of the principal amount redeemed plus accrued and unpaid interest.
The unsecured 8.75% senior notes were due November 1, 2032. Interest was paid quarterly. U.S. Cellular redeemed the notes in whole at the redemption price equal to 100% of the principal amount plus accrued and unpaid interest on December 24, 2009, which resulted in a total redemption payment of $131.7 million.
Consolidated
The annual requirements for principal payments on long-term debt are approximately $2.5 million, $1.6 million, $4.9 million, $0.3 million, $0.2 million for the years 2010 through 2014, respectively.
The covenants associated with TDS and its subsidiaries' long-term debt obligations, among other things, restrict TDS' ability, subject to certain exclusions, to incur additional liens; enter into sale and leaseback transactions; and sell, consolidate or merge assets.
NOTE 15 EMPLOYEE BENEFIT PLANS
Defined Contribution Plans
TDS sponsors a qualified noncontributory defined contribution pension plan. The plan provides benefits for the employees of TDS Corporate, TDS Telecom and U.S. Cellular. Under this plan, pension costs are calculated separately for each participant and are funded annually. Total pension costs were $18.8 million, $16.8 million and $14.1 million in 2009, 2008 and 2007, respectively. In addition, TDS sponsors a defined contribution retirement savings plan ("401(k)") plan. Total costs incurred from TDS' contributions to the 401(k) plan were $20.9 million, $20.6 million and $17.2 million in 2009, 2008 and 2007, respectively.
TDS also sponsors an unfunded nonqualified deferred supplemental executive retirement plan for certain employees to offset the reduction of benefits caused by the limitation on annual employee compensation under the tax laws.
Other Post-Retirement Benefits
TDS sponsors a defined benefit post-retirement plan that provides medical benefits and that covers most of the employees of TDS Corporate, TDS Telecom and the subsidiaries of TDS Telecom. The plan is contributory, with retiree contributions adjusted annually. The plan anticipates future cost sharing changes that reflect TDS' intent to increase retiree contributions as a portion of total cost.
In 2009, TDS amended its defined benefit post-retirement plan that provides medical benefits to retirees. Under this plan, TDS provides a subsidy to retirees to pay for various medical plan options. The amendments introduced subsidy caps that will become effective in 2011. For current retirees and future retirees, the amendments reduce the future subsidies by varying amounts. For new employees hired on or after January 1, 2010, the subsidy is eliminated. The plan amendments reduced the plan's benefit obligation by $26.1 million. This amount is included in TDS' December 31, 2009 Accumulated other comprehensive income as a component of net prior service costs.
The following amounts are included in Accumulated other comprehensive income, before affecting such amounts for income taxes:
December 31,
|
2009 | 2008 | |||||
|---|---|---|---|---|---|---|---|
| |
(Dollars in thousands) |
||||||
Net prior service costs |
$ | 33,804 | $ | 4,158 | |||
Net actuarial loss |
(34,765 | ) | (31,871 | ) | |||
|
$ | (961 | ) | $ | (27,713 | ) | |
The estimated net actuarial loss and prior service cost gain for the postretirement benefit plans that will be amortized from Accumulated other comprehensive income into net periodic benefit cost during 2010 are $2.2 million and $(3.8) million, respectively.
The following amounts are included in Accumulated other comprehensive income ("AOCI"):
December 31, 2009
|
Before-Tax | Deferred Tax (Expense) or Benefit |
Net-of-Tax | |||||||
|---|---|---|---|---|---|---|---|---|---|---|
| |
(Dollars in thousands) |
|||||||||
Net actuarial gains (losses) |
$ | (4,700 | ) | $ | 2,169 | $ | (2,531 | ) | ||
Prior service cost |
30,447 | (14,054 | ) | 16,393 | ||||||
Amortization of prior service costs |
(801 | ) | 370 | (431 | ) | |||||
Amortization of actuarial losses |
1,806 | (833 | ) | 973 | ||||||
Total gains (losses) recognized in AOCI |
$ | 26,752 | $ | (12,348 | ) | $ | 14,404 | |||
December 31, 2008
|
Before-Tax | Deferred Tax (Expense) or Benefit |
Net-of-Tax | |||||||
|---|---|---|---|---|---|---|---|---|---|---|
| |
(Dollars in thousands) |
|||||||||
Net actuarial gains (losses) |
$ | (13,193 | ) | $ | 4,927 | $ | (8,266 | ) | ||
Prior service cost |
(355 | ) | 133 | (222 | ) | |||||
Amortization of prior service costs |
(830 | ) | 310 | (520 | ) | |||||
Amortization of actuarial losses |
968 | (362 | ) | 606 | ||||||
Total gains (losses) recognized in AOCI |
$ | (13,410 | ) | $ | 5,008 | $ | (8,402 | ) | ||
The following table reconciles the beginning and ending balances of the benefit obligation and the fair value of plan assets for the other post-retirement benefit plans.
December 31,
|
2009 | 2008 | ||||||
|---|---|---|---|---|---|---|---|---|
| |
(Dollars in thousands) |
|||||||
Change in benefit obligation |
||||||||
Benefit obligation at beginning of year |
$ | 59,600 | $ | 57,078 | ||||
Acquisition of ILEC |
— | 971 | ||||||
Service cost |
2,140 | 2,001 | ||||||
Interest cost |
3,616 | 3,451 | ||||||
Plan amendments |
(30,447 | ) | 355 | |||||
Actuarial (gain) loss |
10,688 | (1,651 | ) | |||||
Prescription drug subsidy |
237 | 237 | ||||||
Benefits paid |
(3,136 | ) | (2,842 | ) | ||||
Benefit obligation at end of year |
42,698 | 59,600 | ||||||
Change in plan assets |
||||||||
Fair value of plan assets at beginning of year |
33,612 | 41,886 | ||||||
Acquisition of ILEC |
— | 1,774 | ||||||
Actual return (loss) on plan assets |
8,788 | (11,259 | ) | |||||
Employer contribution |
3,143 | 4,053 | ||||||
Benefits paid |
(3,136 | ) | (2,842 | ) | ||||
Fair value of plan assets at end of year |
42,407 | 33,612 | ||||||
Funded status |
$ | (291 | ) | $ | (25,988 | ) | ||
The benefit obligations identified above are recorded as a component of Other deferred liabilities and credits in TDS' Consolidated Balance Sheet.
The following table sets forth by level within the fair value hierarchy the plans' assets at fair value, as of December 31, 2009 and 2008. See Note 1—Summary of Significant Accounting Policies and Recent Accounting Pronouncements for definitions of the levels in the fair value hierarchy.
December 31, 2009
|
Level 1 | Level 2 | Level 3 | Total | ||||||||||
|---|---|---|---|---|---|---|---|---|---|---|---|---|---|---|
| |
(Dollars in thousands) |
|||||||||||||
Mutual funds |
||||||||||||||
Corporate bond |
$ | 10,986 | $ | — | $ | — | $ | 10,986 | ||||||
International growth |
8,112 | — | — | 8,112 | ||||||||||
Money market |
2,208 | — | — | 2,208 | ||||||||||
US large cap |
17,333 | — | — | 17,333 | ||||||||||
US small cap |
3,735 | — | — | 3,735 | ||||||||||
Other |
— | — | 33 | 33 | ||||||||||
Total plan assets at fair value |
$ | 42,374 | $ | — | $ | 33 | $ | 42,407 | ||||||
December 31, 2008
|
Level 1 | Level 2 | Level 3 | Total | ||||||||||
|---|---|---|---|---|---|---|---|---|---|---|---|---|---|---|
| |
(Dollars in thousands) |
|||||||||||||
Mutual funds |
||||||||||||||
Corporate bond |
$ | 8,728 | $ | — | $ | — | $ | 8,728 | ||||||
International growth |
6,058 | — | — | 6,058 | ||||||||||
Money market |
1,652 | — | — | 1,652 | ||||||||||
US large cap |
13,449 | — | — | 13,449 | ||||||||||
US small cap |
3,152 | — | — | 3,152 | ||||||||||
Other |
— | — | 573 | 573 | ||||||||||
Total plan assets at fair value |
$ | 33,039 | $ | — | $ | 573 | $ | 33,612 | ||||||
A financial instrument's level within the fair value hierarchy is based on the lowest level of any input that is significant to the fair value measurement. A financial instrument's level within the fair value hierarchy is not representative of its expected performance or its overall risk profile, and therefore Level 3 assets are not necessarily higher risk than Level 2 assets or Level 1 assets.
Mutual funds are valued based on the closing price reported on the active market on which the individual securities are traded. The investment strategy for each type of mutual fund is identified below:
Corporate bond—The funds seek to achieve a maximum total return, consistent with preservation of capital and prudent investment management by investing in a wide spectrum of fixed income instruments including bonds, debt securities and other similar instruments issued by U.S., non-U.S. and private-sector entities.
International growth—The funds seek to provide long-term capital appreciation by investing in the stocks of companies located outside the United States that are considered to have the potential for above-average capital appreciation.
Money market—The fund seeks as high a level of current income as is consistent with the preservation of capital and the maintenance of liquidity by investing in a diversified portfolio of high-quality, dollar-denominated short-term debt securities.
US large cap—The funds seek to track the performance of several benchmark indices that measure the investment return of large-capitalization stocks. The fund attempts to replicate the indices by investing substantially all of its assets in the stocks that make up the various indices in approximately the same proportion as the weighting in the indices.
US small cap—The fund seeks to track the performance of a benchmark index that measures the investment return of small-capitalization stocks. The fund attempts to replicate the index by investing substantially all of its assets in the stocks that make up the index in approximately the same proportion as the weighting in the index.
The following table summarizes how plan assets are invested.
| |
|
Allocation of Plan Assets At December 31, |
||||||||
|---|---|---|---|---|---|---|---|---|---|---|
| |
Target Asset Allocation |
|||||||||
Investment Category
|
2009 | 2008 | ||||||||
U.S. equities |
50 | % | 49.7 | % | 51.1 | % | ||||
International equities |
20 | % | 19.1 | % | 18.0 | % | ||||
Debt securities |
30 | % | 31.2 | % | 30.9 | % | ||||
The post-retirement benefit fund engages multiple asset managers to ensure proper diversification of the investment portfolio within each asset category. The investment objective is to meet or exceed the rate of return of a performance index comprised of 50% Dow Jones U.S. Total Stock Market Index, 20% FTSE All World (excluding U.S.) Stock Index, and 30% Barclays Capital Aggregate Bond Index. The three-year and five-year average rates of return for TDS' post-retirement benefit fund are (0.4)% and 3.6%, respectively.
The post-retirement benefit fund does not hold any debt or equity securities issued by TDS, U.S. Cellular or any related parties.
TDS is not required to set aside current funds for its future retiree health and life insurance benefits. The decision to contribute to the plan assets is based upon several factors, including the funded status of the plan, market conditions, alternative investment opportunities, tax benefits and other circumstances. In accordance with applicable income tax regulations, total accumulated contributions to fund the costs of future retiree medical benefits are restricted to an amount not to exceed 25% of the total accumulated contributions to the trust. An additional contribution equal to a reasonable amortization of the past service cost may be made without regard to the 25% limitation. TDS does not expect to make a contribution to the plan in 2010.
Net periodic benefit cost recorded in the Consolidated Statement of Operations includes the following components:
Year Ended December 31,
|
2009 | 2008 | 2007 | ||||||||
|---|---|---|---|---|---|---|---|---|---|---|---|
| |
(Dollars in thousands) |
||||||||||
Service cost |
$ | 2,140 | $ | 2,001 | $ | 2,437 | |||||
Interest cost on accumulated post-retirement benefit obligation |
3,616 | 3,451 | 3,432 | ||||||||
Expected return on plan assets |
(2,800 | ) | (3,585 | ) | (3,284 | ) | |||||
Amortization of: |
|||||||||||
Unrecognized prior service cost(1) |
(801 | ) | (830 | ) | (830 | ) | |||||
Unrecognized net loss(2) |
1,806 | 968 | 1,362 | ||||||||
Net post-retirement cost |
$ | 3,961 | $ | 2,005 | $ | 3,117 | |||||
| (1) | Based on straight-line amortization over the average time remaining before active employees become fully eligible for plan benefits. |
| (2) | Based on straight-line amortization over the average time remaining before active employees retire. |
The following assumptions were used to determine benefit obligations and net periodic benefit cost:
December 31,
|
2009 | 2008 | |||||
|---|---|---|---|---|---|---|---|
Benefit obligations |
|||||||
Discount rate |
5.60 | % | 6.20 | % | |||
Net periodic benefit cost |
|||||||
Discount rate |
6.20 | % | 6.20 | % | |||
Expected return on plan assets |
8.25 | % | 8.50 | % | |||
In determining the discount rate for 2009 and 2008, TDS used a hypothetical Aa spot yield curve represented by a series of annualized individual discount rates from six months to thirty years. Each discount rate in the curve was derived by using a hypothetical zero coupon bond from an equal weighting of the bonds in distinct maturity groups. Only those bonds with yields to maturity in the top half of each maturity group were used to construct the yield curve. This yield curve, when populated with projected cash flows that represent the expected timing and amount of TDS plan benefit payments, produces a single effective interest discount rate that is used to measure the plan's liabilities.
A 1% increase or decrease in the discount rate would have the following effects:
| |
One Percent | ||||||
|---|---|---|---|---|---|---|---|
| |
Increase | Decrease | |||||
| |
(Dollars in thousands) |
||||||
Effect on total net periodic postretirement benefit cost |
$ | (500 | ) | $ | 500 | ||
Effect on post-retirement benefit obligation |
$ | (4,800 | ) | $ | 5,500 | ||
The measurement date for actuarial determination was December 31, 2009. For measurement purposes, the annual rate of increase in the per capita cost of covered health care benefits was assumed for 2009 to be 8.7% for plan participants aged 65 and above, and 7.7% for participants under age 65. For all participants the 2009 annual rate of increase is expected to decrease to 5.0% by 2020. The 2008 expected rate of increase was 9.3% for plan participants aged 65 and above, and 8.0% for participants under age 65, decreasing to 5.0% by 2015.
A 1% increase or decrease in assumed health care cost trend rates would have the following effects:
| |
One Percent | ||||||
|---|---|---|---|---|---|---|---|
| |
Increase | Decrease | |||||
| |
(Dollars in thousands) |
||||||
Effect on total service and interest cost components |
$ | 42 | $ | (41 | ) | ||
Effect on post-retirement benefit obligation |
$ | 588 | $ | (564 | ) | ||
The following estimated future benefit payments, which reflect expected future service, are expected to be paid:
Year
|
Estimated Future Post-Retirement Benefit Payments |
|||
|---|---|---|---|---|
| |
(Dollars in thousands) |
|||
2010 |
$ | 2,356 | ||
2011 |
2,302 | |||
2012 |
2,216 | |||
2013 |
2,223 | |||
2014 |
2,213 | |||
Thereafter |
13,218 | |||
On December 8, 2003, the Medicare Prescription Drug, Improvement and Modernization Act of 2003 (the "Act") was enacted. The Act expanded Medicare coverage, primarily by adding a prescription drug benefit for Medicare-eligible participants starting in 2006. The Act provided employers currently sponsoring prescription drug programs for Medicare-eligible participants with a range of options for coordinating with the new government-sponsored program to potentially reduce employers' costs. One alternative allowed employers to receive a subsidy from the federal government for all retirees enrolled in the employer-sponsored prescription drug plan. The plan qualifies for and receives this federal subsidy on an annual basis.
TDS' accumulated postretirement benefit obligation ("APBO") has been reduced by approximately $2.7 million and $15.9 million as of December 31, 2009 and December 31, 2008 as a result of this subsidy. Prior to the amendments made to the plan in 2009 related to the subsidy provided by TDS to retirees, that are described above, the plan was projected to remain eligible for the Medicare subsidy reimbursement indefinitely. After the amendments, the plan is only projected to remain eligible for the Medicare subsidy through the year 2016.
The effect of the Medicare subsidy reduced TDS' 2009, 2008 and 2007 net periodic postretirement benefit cost by $2.3 million, $1.9 million and $2.7 million, respectively. TDS received a Medicare subsidy of $0.2 million for 2007 in 2009 and $0.2 million for 2006 in 2008. During 2010 and 2011, TDS expects to receive Medicare subsidies of $0.3 million and $0.3 million for 2008 and 2009, respectively.
NOTE 16 COMMITMENTS AND CONTINGENCIES
Lease Commitments
TDS and its subsidiaries have leases for certain plant facilities, office space, retail store sites, cell sites and data-processing equipment which are accounted for as operating leases. Certain leases have renewal options and/or fixed rental increases. Renewal options that are reasonably assured of exercise are included in determining the lease term. Any rent abatements or lease incentives, in addition to fixed rental increases, are included in the calculation of rent expense and calculated on a straight-line basis over the defined lease term.
TDS accounts for certain lease agreements as capital leases. The short- and long-term portions of capital lease obligations totaled $0.3 million and $4.7 million, respectively, as of December 31, 2009 and $0.7 million and $3.9 million, respectively, as of December 31, 2008. The short- and long-term portions of capital lease obligations are included in Current portion of long-term debt and Long-term debt in the Consolidated Balance Sheet.
As of December 31, 2009, future minimum rental payments required under operating and capital leases and rental receipts expected under operating leases that have noncancellable lease terms in excess of one year were as follows:
| |
Operating Leases— Future Minimum Rental Payments |
Operating Leases— Future Minimum Rental Receipts |
Capital Leases— Future Minimum Rental Payments |
|||||||
|---|---|---|---|---|---|---|---|---|---|---|
| |
(Dollars in thousands) |
|||||||||
2010 |
$ | 148,002 | $ | 29,988 | $ | 799 | ||||
2011 |
131,411 | 24,694 | 817 | |||||||
2012 |
105,824 | 19,151 | 658 | |||||||
2013 |
85,964 | 12,278 | 554 | |||||||
2014 |
62,981 | 6,105 | 563 | |||||||
Thereafter |
566,049 | 959 | 6,252 | |||||||
Total |
$ | 1,100,231 | $ | 93,175 | 9,643 | |||||
|
(4,595 |
) |
||||||||
Present value of minimum lease payments |
5,048 | |||||||||
Less: Current portion of obligations under capital leases |
(336 | ) | ||||||||
Long-term portion of obligations under capital leases |
$ | 4,712 | ||||||||
For 2009, 2008 and 2007, rent expense for noncancellable long-term leases was $162.5 million, $154.3 million and $147.4 million, respectively; and rent expense under cancelable short-term leases was $11.5 million, $12.7 million and $12.8 million, respectively. During 2009, TDS recorded a $6.5 million out-of-period adjustment to correct rent expense. Management does not believe that the adjustment is material to the current year or any prior year earnings, earnings trends or financial statement line items. The adjustment was recorded in the quarter ended December 31, 2009 and no prior periods were adjusted. The impact of the out-of-period adjustment on the affected line items in the Consolidated Statement of Operations in 2009 is as follows:
(Amounts in thousands)
|
Increase (Decrease) |
|||
|---|---|---|---|---|
Cost of services and products |
$ | (5,813 | ) | |
Selling, general and administrative |
(696 | ) | ||
Total operating expenses |
(6,509 | ) | ||
Operating income |
6,509 | |||
Income before income taxes |
6,509 | |||
Rental revenue totaled $31.8 million, $26.8 million and $23.8 million in 2009, 2008 and 2007, respectively.
Indemnifications
TDS enters into agreements in the normal course of business that provide for indemnification of counterparties. These agreements include certain asset sales and financings with other parties. The terms of the indemnification vary by agreement. The events or circumstances that would require TDS to perform under these indemnities are transaction specific; however, these agreements may require TDS to indemnify the counterparty for costs and losses incurred from litigation or claims arising from the underlying transaction. TDS is unable to estimate the maximum potential liability for these types of indemnifications as the amounts are dependent on the outcome of future events, the nature and likelihood of which cannot be determined at this time. Historically, TDS has not made any significant indemnification payments under such agreements.
Legal Proceedings
In February 2009, the United States Department of Justice ("DOJ") notified TDS and U.S. Cellular, a subsidiary of TDS, that each was a named defendant in a civil action brought by a private party in the U.S. District Court for the District of Columbia under the "qui tam" provisions of the federal False Claims Act. TDS and U.S. Cellular were advised that the complaint seeks return of approximately $165 million of bid credits from certain FCC auctions and requests treble damages. The complaint was under seal while the DOJ considered whether to intervene in the proceeding. On October 13, 2009, TDS and U.S. Cellular were advised that the DOJ had determined not to intervene in the proceeding. As a result of the complaint, the DOJ had investigated TDS' and U.S. Cellular's participation in certain spectrum auctions conducted by the FCC between 2005 and 2008, through Carroll Wireless, L.P., Barat Wireless, L.P., and King Street Wireless, L.P. Carroll Wireless, L.P., Barat Wireless, L.P. and King Street Wireless, L.P. were winning bidders in Auction 58, Auction 66 and Auction 73, respectively. These limited partnerships received a 25% bid credit in the applicable auction price under FCC rules. The DOJ investigated whether these limited partnerships qualified for the 25% bid credit in auction price considering their arrangements with TDS and U.S. Cellular. In addition, on October 13, 2009, the District Court unsealed the complaint. At that time, the District Court also ordered that, if the private party plaintiff decides to pursue the matter, it must serve the complaint on TDS and U.S. Cellular within 120 days. On January 12, 2010, the private party plaintiff filed a request to voluntarily dismiss the complaint and, on January 13, 2010, the U.S. District Court for the District of Columbia issued an order dismissing the complaint. The FCC sent a letter to King Street Wireless, L.P. requesting that it submit to the FCC a written response to the allegations in the complaint. King Street Wireless, L.P. made this submission as requested by the FCC on May 8, 2009. Following completion of its review of the matter, on December 30, 2009, the FCC issued a public notice announcing the grant to King Street Wireless, L.P. of all licenses with respect to which it had been the high bidder in Auction 73.
TDS is involved or may be involved from time to time in legal proceedings before the FCC, other regulatory authorities, and/or various state and federal courts. If TDS believes that a loss arising from such legal proceedings is probable and can be reasonably estimated, an amount is accrued in the financial statements for the estimated loss. If only a range of loss can be determined, the best estimate within that range is accrued; if none of the estimates within that range is better than another, the low end of the range is accrued. The assessment of the expected outcomes of legal proceedings is a highly subjective process that requires judgments about future events. The legal proceedings are reviewed at least quarterly to determine the adequacy of accruals and related financial statement disclosures. The ultimate outcomes of legal proceedings could differ materially from amounts accrued in the financial statements.
NOTE 17 COMMON STOCKHOLDERS' EQUITY
Tax-Deferred Savings Plan
TDS has reserved 45,000 Common Shares and 45,000 Special Common Shares at December 31, 2009, for issuance under the TDS Tax-Deferred Savings Plan, a qualified profit-sharing plan pursuant to Sections 401(a) and 401(k) of the Internal Revenue Code. Participating employees have the option of investing their contributions and TDS' contributions in a TDS Common Share fund, a TDS Special Common Share fund, a U.S. Cellular Common Share fund or certain unaffiliated funds.
Common Stock
The holders of Common Shares and Special Common Shares are entitled to one vote per share. The holders of Common Shares have full voting rights; the holders of Special Common Shares have limited voting rights. Other than the election of directors, the Special Common Shares have no votes except as otherwise required by law. The holders of Series A Common Shares are entitled to ten votes per share. Series A Common Shares are convertible, on a share for share basis, into Common Shares or Special Common Shares. TDS has reserved 6,492,000 Common Shares and 6,730,000 Special Common Shares at December 31, 2009, for possible issuance upon such conversion.
The following table summarizes the number of Common, Special Common and Series A Common Shares issued and repurchased.
| |
Common Shares |
Special Common Shares |
Common Treasury Shares |
Special Common Treasury Shares |
Series A Common Shares |
||||||||||||
|---|---|---|---|---|---|---|---|---|---|---|---|---|---|---|---|---|---|
| |
(Shares in thousands) |
||||||||||||||||
Balance December 31, 2006(1) |
57,042 | 63,425 | (5,160 | ) | (5,160 | ) | 6,445 | ||||||||||
Repurchase of shares |
— | — | — | (2,077 | ) | — | |||||||||||
Conversion of Series A Common Shares |
10 | — | — | — | (10 | ) | |||||||||||
Dividend reinvestment, incentive and compensation plans |
13 | 5 | 1,243 | 2,041 | 7 | ||||||||||||
Balance December 31, 2007 |
57,065 | 63,430 | (3,917 | ) | (5,196 | ) | 6,442 | ||||||||||
Repurchase of shares |
— | — | (1,556 | ) | (4,306 | ) | — | ||||||||||
Conversion of Series A Common Shares |
4 | — | — | — | (4 | ) | |||||||||||
Dividend reinvestment, incentive and compensation plans |
13 | 12 | 38 | 150 | 23 | ||||||||||||
Balance December 31, 2008 |
57,082 | 63,442 | (5,435 | ) | (9,352 | ) | 6,461 | ||||||||||
Repurchase of shares |
— | — | (1,854 | ) | (4,520 | ) | — | ||||||||||
Dividend reinvestment, incentive and compensation plans |
— | — | 12 | 155 | 31 | ||||||||||||
Balance December 31, 2009 |
57,082 | 63,442 | (7,277 | ) | (13,717 | ) | 6,492 | ||||||||||
| (1) | Previously, shares of TDS held by its subsidiary were not reflected as issued shares and treasury shares in the consolidated financial statements. Effective January 1, 2009, these shares are reflected as treasury shares pursuant to the adoption of new required provisions under GAAP related to the accounting and reporting for noncontrolling interests. See Note 2—Noncontrolling Interests for additional details on changes to accounting and reporting for noncontrolling interests. |
Share Repurchase Programs
On November 19, 2009, the Board of Directors of TDS authorized a new $250 million stock repurchase program for both TDS Common and Special Common Shares from time to time pursuant to open market purchases, block transactions, private purchases or otherwise, depending on market conditions. This new authorization will expire on November 19, 2012.
On November 17, 2009, the Board of Directors of U.S. Cellular authorized the repurchase of up to 1,300,000 Common Shares on an annual basis beginning in 2009 and continuing each year thereafter, on a cumulative basis. These purchases will be made pursuant to open market purchases, block purchases, private purchases, or otherwise, depending on market prices and other conditions. This authorization does not have an expiration date.
Share repurchases made under these authorizations and prior authorizations, were as follows:
Year Ended December 31,
|
Number of Shares |
Average Cost Per Share |
Amount(2) | ||||||||
|---|---|---|---|---|---|---|---|---|---|---|---|
| |
(Dollars amounts and shares in thousands) |
||||||||||
2009 |
|||||||||||
U.S. Cellular Common Shares |
887 | $ | 37.86 | $ | 33,585 | ||||||
TDS Common Shares |
1,854 | 29.71 | 55,103 | ||||||||
TDS Special Common Shares |
4,520 | 26.88 | 121,497 | ||||||||
2008 |
|||||||||||
U.S. Cellular Common Shares |
600 | $ | 54.87 | $ | 32,920 | ||||||
TDS Common Shares |
1,556 | 28.69 | 44,624 | ||||||||
TDS Special Common Shares |
4,306 | 35.99 | 154,983 | ||||||||
2007 |
|||||||||||
U.S. Cellular Common Shares |
— | $ | — | $ | — | ||||||
U.S. Cellular Common Shares purchased through ASR transactions(1) |
1,006 | 82.85 | 83,348 | ||||||||
TDS Common Shares |
— | — | — | ||||||||
TDS Special Common Shares |
2,077 | 60.99 | 126,668 | ||||||||
| (1) | TDS received $4.6 million in 2008 as a final cash settlement of U.S. Cellular Common Share repurchases executed in 2007 through accelerated share repurchase transactions with an investment banking firm. |
| (2) | Amounts reported on the Consolidated Statement of Cash Flows may differ from these amounts due to repurchases and subsequent cash settlements occurring in different years. |
TDS' ownership percentage of U.S. Cellular increases upon U.S. Cellular share repurchases. Prior to January 1, 2009, TDS accounted for U.S. Cellular's purchases of U.S. Cellular Common Shares as step acquisitions using purchase accounting, as required by GAAP in effect at that time. See Note 9—Licenses and Goodwill for details on the amounts allocated to goodwill and intangible assets related to the repurchase of U.S. Cellular Common Shares in 2008. Subsequent to January 1, 2009, TDS accounts for U.S. Cellular's purchases of U.S. Cellular Common Shares as equity transactions. See Note 1—Summary of Significant Accounting Policies and Recent Accounting Pronouncements for additional information on the adoption of the revised provisions under GAAP for business combinations and Note 2—Noncontrolling Interests for additional information on the adoption of revised provisions related to the accounting for noncontrolling interests.
Accumulated Other Comprehensive Income
The changes in the cumulative balance of Accumulated other comprehensive income were as follows:
Year Ended December 31,
|
2009 | 2008 | |||||||
|---|---|---|---|---|---|---|---|---|---|
| |
(Dollars in thousands) |
||||||||
Marketable equity securities |
|||||||||
Balance, beginning of period (prior to the adjustment) |
$ | 608 | $ | 665,377 | |||||
Cumulative effect adjustment related to fair value accounting(1) |
— | (647,260 | ) | ||||||
Balance, beginning of period (including the adjustment) |
608 | 18,117 | |||||||
Add (deduct): |
|||||||||
Unrealized gain on marketable equity securities |
— | 654 | |||||||
Deferred income taxes |
— | (251 | ) | ||||||
|
— | 403 | |||||||
Unrealized gains/(losses) of equity method companies |
(302 | ) | 221 | ||||||
Noncontrolling share of unrealized gains |
— | (17 | ) | ||||||
Net change in unrealized gains/(losses) |
(302 | ) | 607 | ||||||
Recognized gain on sale of marketable equity securities(2) |
— | (31,725 | ) | ||||||
Deferred income taxes |
— | 11,647 | |||||||
|
— | (20,078 | ) | ||||||
Noncontrolling share of recognized gain |
— | 1,962 | |||||||
Net recognized gain |
— | (18,116 | ) | ||||||
Net change in marketable equity securities |
(302 | ) | (19,454 | ) | |||||
Net change attributable to noncontrolling interests |
— | 1,945 | |||||||
Net change attributable to TDS stockholders |
(302 | ) | (17,509 | ) | |||||
Balance, end of period |
$ | 306 | $ | 608 | |||||
Derivative instruments |
|||||||||
Balance, beginning of period (prior to the adjustment) |
$ | — | $ | (144,583 | ) | ||||
Cumulative effect adjustment related to fair value accounting(1) |
— | 144,583 | |||||||
Balance, beginning of period (including the adjustment) |
— | — | |||||||
Net change in derivative instruments |
— | — | |||||||
Balance, end of period |
$ | — | $ | — | |||||
Retirement plan |
|||||||||
Balance, beginning of period |
$ | (17,420 | ) | $ | (9,018 | ) | |||
Add (deduct): |
|||||||||
Amounts included in net periodic benefit cost for the period |
|||||||||
Net actuarial loss |
(4,700 | ) | (13,193 | ) | |||||
Prior service cost |
30,447 | (355 | ) | ||||||
Amortization of prior service cost |
(801 | ) | (830 | ) | |||||
Amortization of unrecognized net loss |
1,806 | 968 | |||||||
|
26,752 | (13,410 | ) | ||||||
Deferred income taxes |
(12,348 | ) | 5,008 | ||||||
Net change in retirement plan |
14,404 | (8,402 | ) | ||||||
Balance, end of period |
$ | (3,016 | ) | $ | (17,420 | ) | |||
Year Ended December 31,
|
2009 | 2008 | |||||||
|---|---|---|---|---|---|---|---|---|---|
| |
(Dollars in thousands) |
||||||||
Accumulated other comprehensive income |
|||||||||
Balance, beginning of period (prior to the adjustment) |
$ | (16,812 | ) | $ | 511,776 | ||||
Cumulative effect adjustment related to fair value accounting(1) |
— | (502,677 | ) | ||||||
Balance, beginning of period (including the adjustment) |
(16,812 | ) | 9,099 | ||||||
Add (deduct): |
|||||||||
Net change in marketable equity securities and equity method investments |
(302 | ) | (19,454 | ) | |||||
Net change in derivative instruments |
— | — | |||||||
Net change in retirement plan |
14,404 | (8,402 | ) | ||||||
Net change included in comprehensive income |
14,102 | (27,856 | ) | ||||||
Less: Net change attributable to noncontrolling interests |
— | 1,945 | |||||||
Net change attributable to TDS stockholders |
14,102 | (25,911 | ) | ||||||
Balance, end of period |
$ | (2,710 | ) | $ | (16,812 | ) | |||
| (1) | As permitted under GAAP, TDS elected to adopt fair value accounting for its investment in Deutsche Telekom Ordinary Shares and for the "collar" portions of the variable prepaid forward contracts related to such Deutsche Telekom Ordinary Shares as of January 1, 2008. This election, referred to as the fair value option, was made in order to better align the financial statement presentation of the unrealized gains and losses attributable to these items with their underlying economics. Entities which elect the fair value option are required to record a cumulative-effect adjustment to beginning retained earnings at the date of adoption. In subsequent periods, for those instruments for which the fair value option is elected, unrealized gains and losses are recorded in the Statement of Operations. See Note 3—Fair Value Measurements for additional details related to the cumulative effect adjustment related to fair value accounting. |
| (2) | See Note 10—Marketable Equity Securities and Variable Prepaid Forward Contracts for additional details on the disposition of marketable equity securities. |
NOTE 18 STOCK-BASED COMPENSATION
TDS Consolidated
The following table summarizes stock-based compensation expense recognized during 2009, 2008 and 2007:
Year Ended December 31,
|
2009 | 2008 | 2007 | |||||||
|---|---|---|---|---|---|---|---|---|---|---|
| |
(Dollars in thousands) |
|||||||||
Stock option awards |
$ | 17,075 | $ | 10,013 | $ | 18,961 | ||||
Restricted stock unit awards |
13,823 | 11,125 | 12,400 | |||||||
Deferred compensation matching stock unit awards |
281 | 389 | 155 | |||||||
Employee stock purchase plans |
471 | 469 | 229 | |||||||
Awards under non-employee directors' compensation plan |
836 | 697 | 146 | |||||||
Total stock-based compensation, before income taxes |
32,486 | 22,693 | 31,891 | |||||||
Income tax benefit |
(12,228 | ) | (8,354 | ) | (11,783 | ) | ||||
Total stock-based compensation expense, net of income taxes |
$ | 20,258 | $ | 14,339 | $ | 20,108 | ||||
At December 31, 2009, unrecognized compensation cost for all stock-based compensation awards was $31.4 million. The unrecognized compensation cost for stock-based compensation awards at December 31, 2009, is expected to be recognized over a weighted average period of 1.3 years.
In 2009, 2008 and 2007, stock-based compensation expense of $30.0 million, $21.0 million and $30.0 million, respectively, was recorded in Selling, general and administrative expense and $2.5 million, $1.7 million and $1.9 million, respectively, was recorded in Cost of services and products.
TDS' tax benefits from the exercise of stock options and other awards totaled $3.5 million in 2009.
TDS (excluding U.S. Cellular)
The information in this section relates to stock-based compensation plans using the equity instruments of TDS. Participants in these plans are generally employees of TDS Corporate and TDS Telecom, although U.S. Cellular employees are eligible to participate in the TDS Employee Stock Purchase Plan. Information related to plans using the equity instruments of U.S. Cellular are shown in the U.S. Cellular section following the TDS section.
Under the TDS 2004 Long-Term Incentive Plan, TDS may grant fixed and performance-based incentive and non-qualified stock options, restricted stock, restricted stock units, and deferred compensation stock unit awards to key employees. TDS had reserved 1,960,000 Common Shares and 9,221,000 Special Common Shares at December 31, 2009 for equity awards granted and to be granted under this plan. At December 31, 2009 the only types of awards outstanding are fixed non-qualified stock option awards, restricted stock unit awards, and deferred compensation stock unit awards. As of December 31, 2009, TDS also had reserved 119,000 Special Common Shares under an employee stock purchase plan. The maximum number of TDS Common Shares and TDS Special Common Shares that may be issued to employees under all stock-based compensation plans in effect at December 31, 2009 was 1,960,000 and 9,340,000 shares, respectively. TDS has also created a Non-Employee Directors' Plan under which it has reserved 92,000 TDS Special Common Shares as of December 31, 2009 for issuance as compensation to members of the Board of Directors who are not employees of TDS. When shares are issued upon stock option exercises or restricted stock unit vesting, TDS uses treasury shares.
Long-Term Incentive Plan—Stock Options—Stock options granted to key employees are exercisable over a specified period not in excess of ten years. Stock options generally vest over periods up to three years from the date of grant. Stock options outstanding at December 31, 2009 expire between 2010 and 2019. However, vested stock options typically expire 30 days after the effective date of an employee's termination of employment for reasons other than retirement. Employees who leave at the age of retirement have 90 days (or one year if they satisfy certain requirements) within which to exercise their vested stock options. The exercise price of the option generally equals the market value of TDS common stock on the date of grant.
TDS options granted in 2007 became exercisable on December 15, 2007. TDS options granted in 2008 and 2009 become exercisable with respect to one-third of the number of shares subject to the option on each of the first, second and third anniversaries of the grant date. As a result of this change, the expense related to options granted in 2008 and 2009 will be reflected over a three year period, instead of entirely in the year of grant as in 2007. As a result, the amount of expense recognized related to stock option awards in 2009 and 2008 is lower than the corresponding expense amount recognized in 2007.
TDS estimated the fair value of stock options granted in 2009, 2008 and 2007 using the Black-Scholes valuation model and the assumptions shown in the table below:
| |
2009 | 2008 | 2007 | |||||||
|---|---|---|---|---|---|---|---|---|---|---|
Expected life |
5.1 Years | 5.0 Years | 4.0 Years | |||||||
Expected annual volatility rate |
43.01% | 25.95% | 19.50% | |||||||
Dividend yield |
1.60% | 1.16% | 0.70% | |||||||
Risk-free interest rate |
2.46% | 3.06% | 4.70% | |||||||
Estimated annual forfeiture rate |
1.88% | 1.88% | 1.00% | |||||||
Any employee with stock options granted prior to the date of the TDS Special Common Share dividend on May 13, 2005, receives one Common Share and one Special Common Share per tandem option exercised. Each tandem option is exercisable at its original exercise price. TDS options granted after the distribution of the TDS Special Common Share dividend will receive one Special Common Share per option exercised.
A summary of TDS stock options (total and portion exercisable) and changes during the three years ended December 31, 2009, is presented in the tables and narrative below:
Tandem Options
|
Number of Tandem Options(1) |
Weighted Average Exercise Price |
Weighted Average Grant Date Fair Value |
Aggregate Intrinsic Value |
Weighted Average Remaining Contractual Life (in years) |
|||||||||||
|---|---|---|---|---|---|---|---|---|---|---|---|---|---|---|---|---|
Outstanding at December 31, 2006 |
2,254,000 | $ | 76.59 | |||||||||||||
(2,193,000 exercisable) |
76.89 | |||||||||||||||
Exercised |
(1,205,000 | ) | 74.21 | $ | 58,233,000 | |||||||||||
Forfeited |
(1,000 | ) | 65.96 | |||||||||||||
Expired |
(11,000 | ) | 77.69 | |||||||||||||
Outstanding at December 31, 2007 |
1,037,000 | $ | 79.25 | |||||||||||||
(1,037,000 exercisable) |
79.25 | |||||||||||||||
Exercised |
(48,000 | ) | 42.88 | $ | 2,873,000 | |||||||||||
Forfeited |
— | — | ||||||||||||||
Expired |
(2,000 | ) | 81.26 | |||||||||||||
Outstanding at December 31, 2008 |
987,000 | $ | 81.03 | |||||||||||||
(987,000 exercisable) |
81.03 | |||||||||||||||
Exercised |
(6,000 | ) | 49.84 | $ | 50,000 | |||||||||||
Forfeited |
— | — | ||||||||||||||
Expired |
(80,000 | ) | 75.44 | |||||||||||||
Outstanding at December 31, 2009 |
901,000 | $ | 81.73 | $ | 2,144,000 | 2.9 | ||||||||||
(901,000 exercisable) |
$ | 81.73 | $ | 2,144,000 | 2.9 | |||||||||||
| (1) | Upon exercise, each tandem option is converted into one TDS Common Share and one TDS Special Common Share. |
Special Common Share Options
|
Number of Options |
Weighted Average Exercise Prices |
Weighted Average Grant Date Fair Value |
Aggregate Intrinsic Value |
Weighted Average Remaining Contractual Life (in years) |
||||||||||||
|---|---|---|---|---|---|---|---|---|---|---|---|---|---|---|---|---|---|
Outstanding at December 31, 2006 |
1,402,000 | $ | 40.15 | ||||||||||||||
(1,400,000 exercisable) |
40.15 | ||||||||||||||||
Granted |
873,000 | 59.45 | $ | 13.20 | |||||||||||||
Exercised |
(824,000 | ) | 38.59 | $ | 16,543,000 | ||||||||||||
Forfeited |
(4,000 | ) | 59.45 | ||||||||||||||
Outstanding at December 31, 2007 |
1,447,000 | $ | 52.63 | ||||||||||||||
(1,446,000 exercisable) |
52.63 | ||||||||||||||||
Granted |
1,189,000 | 35.35 | $ | 8.85 | |||||||||||||
Exercised |
(4,000 | ) | 38.11 | $ | 48,965 | ||||||||||||
Forfeited |
(3,000 | ) | 35.35 | ||||||||||||||
Expired |
(15,000 | ) | 59.45 | ||||||||||||||
Outstanding at December 31, 2008 |
2,614,000 | $ | 44.77 | ||||||||||||||
(1,428,000 exercisable) |
52.59 | ||||||||||||||||
Granted |
1,399,000 | 26.95 | $ | 9.60 | |||||||||||||
Exercised |
— | — | $ | — | |||||||||||||
Forfeited |
(68,000 | ) | 31.19 | ||||||||||||||
Expired |
(85,000 | ) | 48.81 | ||||||||||||||
Outstanding at December 31, 2009 |
3,860,000 | $ | 38.46 | $ | 4,439,000 | 8.4 | |||||||||||
(1,732,000 exercisable) |
$ | 48.91 | $ | — | 7.5 | ||||||||||||
The aggregate intrinsic value in the tables above represents the total pre-tax intrinsic value (the difference between TDS' closing stock prices and the exercise price, multiplied by the number of in-the-money options) that was received by the option holders upon exercise or that would have been received by option holders had all options been exercised on December 31, 2009.
Long-Term Incentive Plan—Restricted Stock Units—TDS also grants restricted stock unit awards to key employees. Each restricted stock unit outstanding is convertible into one Special Common Share upon the vesting of such restricted stock units. The restricted stock unit awards currently outstanding were granted in 2008 and 2009 and will vest in December 2010 and 2011, respectively.
TDS estimates the fair value of restricted stock units based on the closing market price of TDS shares on the date of grant. The fair value is then recognized as compensation cost on a straight-line basis over the requisite service periods of the awards, which is generally the vesting period.
A summary of TDS nonvested restricted stock units and changes during the year ended December 31, 2009 is presented in the table below.
Special Common Restricted Stock Units
|
Number | Weighted Average Grant Date Fair Value |
||||||
|---|---|---|---|---|---|---|---|---|
Nonvested at December 31, 2008 |
237,000 | $ | 44.63 | |||||
Granted |
192,000 | 26.95 | ||||||
Vested |
(87,000 | ) | 59.45 | |||||
Forfeited |
(17,000 | ) | 36.35 | |||||
Nonvested at December 31, 2009 |
325,000 | $ | 30.58 | |||||
The total fair values as of the respective vesting dates of restricted stock units vested during 2009, 2008 and 2007 were $2.6 million, $2.5 million and $10.9 million, respectively. The weighted average grant date fair value of restricted stock units granted in 2009, 2008 and 2007 was $26.95, $35.35 and $59.45, respectively.
Long-Term Incentive Plan—Deferred Compensation Stock Units —Certain TDS employees may elect to defer receipt of all or a portion of their annual bonuses and to receive stock unit matches on the amount deferred up to $400,000. Deferred compensation, which is immediately vested, is deemed to be invested in TDS Common Share units or TDS Special Common Share units. TDS match amounts depend on the amount of annual bonus that is deferred into stock units. Participants receive a 25% stock unit match for amounts deferred up to 50% of their total annual bonus and a 33% match for amounts that exceed 50% of their total annual bonus. The matched stock units vest ratably at a rate of one-third per year over three years. When fully vested and upon distribution, employees will receive the vested TDS Common Shares and/or TDS Special Common Shares, as applicable.
TDS estimates the fair value of deferred compensation matching stock units based on the closing market price of TDS shares on the date of grant. The fair value of the matched stock units is then recognized as compensation cost using an accelerated attribution method over the requisite service periods of the awards, which is generally the vesting period.
A summary of TDS' nonvested deferred compensation stock units and changes during the year ended December 31, 2009 is presented in the table below.
Special Common Deferred Compensation Stock Units
|
Number | Weighted Average Grant Date Fair Value |
||||||
|---|---|---|---|---|---|---|---|---|
Nonvested at December 31, 2008 |
2,600 | $ | 41.67 | |||||
Granted |
4,500 | 23.35 | ||||||
Vested |
(3,000 | ) | 33.74 | |||||
Nonvested at December 31, 2009 |
4,100 | $ | 27.20 | |||||
The total fair values as of the respective vesting dates of deferred compensation stock units vested during 2009, 2008 and 2007 were $0.1 million, $0.1 million and $0.1 million, respectively. The weighted average grant date fair value of deferred compensation stock units granted in 2009, 2008 and 2007 was $23.35, $38.60 and $52.58, respectively.
Employee Stock Purchase Plan—The TDS 2009 Employee Stock Purchase Plan became effective January 1, 2009 and will terminate December 31, 2013. Under this plan, eligible employees of TDS and its subsidiaries may purchase a limited number of TDS Special Common Shares on a quarterly basis. During 2008 and 2007, the 2003 Employee Stock Purchase Plan was effective but terminated December 31, 2008.
Under these plans, the per share cost to each participant is 85% of the market value of the Common Shares or Special Common Shares as of the issuance date. The employee stock purchase plans are considered compensatory plans; therefore recognition of compensation costs for stock issued under these plans is required. Compensation cost is measured as the difference between the cost of the shares to the plan participants and the fair market value of the shares on the date of issuance.
Compensation of Non-Employee Directors—TDS issued 15,000, 8,400 and 3,500 Special Common Shares under its Non-Employee Directors' plan in 2009, 2008 and 2007, respectively.
Dividend Reinvestment Plans—TDS had reserved 442,000 Common Shares and 289,000 Special Common Shares at December 31, 2009, for issuance under Automatic Dividend Reinvestment and Stock Purchase Plans and 138,000 Series A Common Shares for issuance under the Series A Common Share Automatic Dividend Reinvestment Plan. These plans enable holders of TDS' Common Shares, Special Common Shares and Preferred Shares to reinvest cash dividends in Common Shares and Special Common Shares and holders of Series A Common Shares to reinvest cash dividends in Series A Common Shares. The purchase price of the shares is 95% of the market value, based on the average of the daily high and low sales prices for TDS' Common Shares and Special Common Shares on the New York Stock Exchange for the ten trading days preceding the date on which the purchase is made. These plans are considered non-compensatory plans, therefore no compensation expense is recognized for stock issued under these plans.
U.S. Cellular
The information in this section relates to stock-based compensation plans using the equity instruments of U.S. Cellular. Participants in these plans are employees of U.S. Cellular. Information related to plans using the equity instruments of TDS are shown in the previous section.
U.S. Cellular has established the following stock-based compensation plans: a long-term incentive plan, an employee stock purchase plan, and a non-employee director compensation plan. Also, U.S. Cellular employees are eligible to participate in the TDS employee stock purchase plan.
Under the U.S. Cellular 2005 Long-Term Incentive Plan, U.S. Cellular may grant fixed and performance-based incentive and non-qualified stock options, restricted stock, restricted stock units, and deferred compensation stock unit awards to key employees. At December 31, 2009, the only types of awards outstanding are fixed non-qualified stock option awards, restricted stock unit awards, and deferred compensation stock unit awards.
At December 31, 2009, U.S. Cellular had reserved 6,266,000 Common Shares for equity awards granted and to be granted under the long-term incentive plan, and also had reserved 83,000 Common Shares for issuance to employees under an employee stock purchase plan. The maximum number of U.S. Cellular Common Shares that may be issued to employees under all stock-based compensation plans in effect at December 31, 2009, was 6,349,000.
U.S. Cellular also has established a Non-Employee Director Compensation Plan under which it has reserved 48,000 Common Shares for issuance as compensation to members of the Board of Directors who are not employees of U.S. Cellular or TDS.
U.S. Cellular uses treasury stock to satisfy requirements for Common Shares issued pursuant to its various stock-based compensation plans.
Long-Term Incentive Plan—Stock Options—Stock options granted to key employees are exercisable over a specified period not in excess of ten years. Stock options generally vest over periods of between three and five years from the date of grant. Stock options outstanding at December 31, 2009 expire between 2010 and 2019. However, vested stock options typically expire 30 days after the effective date of an employee's termination of employment for reasons other than retirement. Employees who leave at the age of retirement have 90 days (or one year if they satisfy certain requirements) within which to exercise their vested stock options. The exercise price of the option generally equals the market value of U.S. Cellular Common Shares on the date of grant.
U.S. Cellular estimated the fair value of stock options granted during 2009, 2008, and 2007 using the Black-Scholes valuation model and the assumptions shown in the table below.
| |
2009 | 2008 | 2007 | |||
|---|---|---|---|---|---|---|
Expected life |
3.9 Years | 3.7 Years | 3.1 Years | |||
Expected volatility |
40.3%-44.2% | 28.1%-40.3% | 22.5%-25.7% | |||
Dividend yield |
0% | 0% | 0% | |||
Risk-free interest rate |
1.2%-2.2% | 1.2%-3.5% | 3.3%-4.8% | |||
Estimated annual forfeiture rate |
6.89% | 11.29% | 9.60% |
A summary of U.S. Cellular stock options outstanding (total and portion exercisable) and changes during the three years ended December 31, 2009, is presented in the table below:
| |
Number of Options |
Weighted Average Exercise Price |
Weighted Average Grant Date Fair Value |
Aggregate Intrinsic Value |
Weighted Average Remaining Contractual Life (in years) |
||||||||||||
|---|---|---|---|---|---|---|---|---|---|---|---|---|---|---|---|---|---|
Outstanding at December 31, 2006 |
2,571,000 | $ | 44.07 | ||||||||||||||
(1,430,000 exercisable) |
42.15 | ||||||||||||||||
Granted |
477,000 | 74.29 | $ | 16.74 | |||||||||||||
Exercised |
(1,523,000 | ) | 45.53 | $ | 55,912,000 | ||||||||||||
Forfeited |
(122,000 | ) | 57.05 | ||||||||||||||
Expired |
(4,000 | ) | 34.44 | ||||||||||||||
Outstanding at December 31, 2007 |
1,399,000 | $ | 51.65 | ||||||||||||||
(544,000 exercisable) |
38.21 | ||||||||||||||||
Granted |
685,000 | 56.99 | $ | 14.08 | |||||||||||||
Exercised |
(415,000 | ) | 37.90 | $ | 7,487,000 | ||||||||||||
Forfeited |
(38,000 | ) | 61.40 | ||||||||||||||
Expired |
(5,000 | ) | 63.56 | ||||||||||||||
Outstanding at December 31, 2008 |
1,626,000 | $ | 57.15 | ||||||||||||||
(624,000 exercisable) |
51.56 | ||||||||||||||||
Granted |
748,000 | 34.21 | $ | 11.75 | |||||||||||||
Exercised |
(181,000 | ) | 34.01 | $ | 821,000 | ||||||||||||
Forfeited |
(130,000 | ) | 47.98 | ||||||||||||||
Expired |
(34,000 | ) | 56.84 | ||||||||||||||
Outstanding at December 31, 2009 |
2,029,000 | $ | 51.37 | $ | 5,438,000 | 7.0 | |||||||||||
(1,046,000 exercisable) |
$ | 54.40 | $ | 1,436,000 | 5.6 | ||||||||||||
The aggregate intrinsic value in the table above represents the total pre-tax intrinsic value (the difference between U.S. Cellular's closing stock price and the exercise price multiplied by the number of in-the-money options) that was received by the option holders upon exercise or that would have been received by option holders had all options been exercised on December 31, 2009.
Long-Term Incentive Plan—Restricted Stock Units—U.S. Cellular grants restricted stock unit awards, which generally vest after three years, to key employees.
U.S. Cellular estimates the fair value of restricted stock units based on the closing market price of U.S. Cellular shares on the date of grant. The fair value is then recognized as compensation cost on a straight-line basis over the requisite service periods of the awards, which is generally the vesting period. Awards granted under this plan prior to 2005 were classified as liability awards due to a plan provision which allowed participants to elect tax withholding in excess of minimum statutory tax rates. In 2005, this provision was removed from the plan and, thus, awards after 2005 have been classified as equity awards (except for awards that may be settled in stock or cash at the option of the recipient, which are classified as liability awards). All restricted stock units that were classified as liability awards vested prior to 2008.
A summary of U.S. Cellular nonvested restricted stock units at December 31, 2009 and changes during the year then ended is presented in the table below:
Equity Classified Awards
|
Number | Weighted Average Grant Date Fair Value |
||||||
|---|---|---|---|---|---|---|---|---|
Nonvested at December 31, 2008 |
457,000 | $ | 61.51 | |||||
Granted |
291,000 | 33.00 | ||||||
Vested |
(114,000 | ) | 58.88 | |||||
Forfeited |
(53,000 | ) | 51.29 | |||||
Nonvested at December 31, 2009 |
581,000 | $ | 48.68 | |||||
The total fair value of liability classified restricted stock units that vested during 2007 was $4.3 million. The total fair value of equity classified restricted stock units that vested during 2009, 2008 and 2007 was $4.2 million, $8.3 million and $0.5 million, respectively, as of the respective vesting dates. The weighted average grant date fair value of restricted stock units granted in 2009, 2008 and 2007 was $33.00, $56.12 and $74.09, respectively.
Long-Term Incentive Plan—Deferred Compensation Stock Units —Certain U.S. Cellular employees may elect to defer receipt of all or a portion of their annual bonuses and to receive a company matching contribution on the amount deferred. All bonus compensation that is deferred by employees electing to participate is immediately vested and is deemed to be invested in U.S. Cellular Common Share stock units. Upon distribution of such stock units, participants will receive U.S. Cellular Common Shares. The amount of U.S. Cellular's matching contribution depends on the portion of the annual bonus that is deferred. Participants receive a 25% match for amounts deferred up to 50% of their total annual bonus and a 33% match for amounts that exceed 50% of their total annual bonus; such matching contributions also are deemed to be invested in U.S. Cellular Common Share stock units. The matching contribution stock units vest ratably at a rate of one-third per year over three years. Upon vesting and distribution of such matching contribution stock units, participants will receive U.S. Cellular Common Shares.
U.S. Cellular estimates the fair value of deferred compensation matching contribution stock units based on the closing market price of U.S. Cellular Common Shares on the date of match. The fair value of such matching contribution stock units is then recognized as compensation cost using an accelerated attribution method over the requisite service periods of the awards, which is generally the vesting period.
A summary of U.S. Cellular nonvested deferred compensation stock units at December 31, 2009 and changes during the year then ended is presented in the table below:
| |
Number | Weighted Average Grant Date Fair Value |
||||||
|---|---|---|---|---|---|---|---|---|
Nonvested at December 31, 2008 |
3,600 | $ | 59.65 | |||||
Granted |
3,700 | 33.58 | ||||||
Vested |
(3,400 | ) | 51.83 | |||||
Nonvested at December 31, 2009 |
3,900 | $ | 41.73 | |||||
The total fair value of deferred compensation stock units that vested during 2009, 2008 and 2007 was $0.1 million, $0.1 million and $0.2 million, respectively. The weighted average grant date fair value of deferred compensation stock units granted in 2009, 2008 and 2007 was $33.58, $56.23 and $70.55, respectively.
Employee Stock Purchase Plan—The U.S. Cellular 2009 Employee Stock Purchase Plan became effective January 1, 2009 and will terminate December 31, 2013. Under this plan, eligible employees of U.S. Cellular and its subsidiaries may purchase a limited number of U.S. Cellular Common Shares on a quarterly basis. During 2008 and 2007, the 2003 Employee Stock Purchase Plan was effective but terminated December 31, 2008. U.S. Cellular employees are also eligible to participate in the TDS Employee Stock Purchase Plan.
Under these plans, the per share cost to participants is 85% of the market value of the U.S. Cellular Common Shares, TDS Common Shares or TDS Special Common Shares as of the issuance date. The employee stock purchase plans are considered compensatory plans; therefore, recognition of compensation cost for stock issued under these plans is required. Compensation cost is measured as the difference between the cost of the shares to plan participants and the market value of the shares on the date of issuance.
Compensation of Non-Employee Directors—U.S. Cellular issued 5,200 and 700 Common Shares in 2009 and 2007, respectively, under its Non-Employee Director Compensation Plan. No Common Shares were issued under this plan in 2008.
NOTE 19 BUSINESS SEGMENT INFORMATION
U.S. Cellular and TDS Telecom are billed for all services they receive from TDS, consisting primarily of information processing and general management services. Such billings are based on expenses specifically identified to U.S. Cellular and TDS Telecom and on allocations of common expenses.
Management believes the method used to allocate common expenses is reasonable and that all expenses and costs applicable to U.S. Cellular and TDS Telecom are reflected in the accompanying business segment information on a basis that is representative of what they would have been if U.S. Cellular and TDS Telecom operated on a stand-alone basis.
Financial data for TDS' business segments for 2009, 2008 and 2007 is as follows.
| |
|
TDS Telecom | |
|
|
|||||||||||||||
|---|---|---|---|---|---|---|---|---|---|---|---|---|---|---|---|---|---|---|---|---|
| |
U.S. Cellular |
Non- Reportable Segment(1) |
Other Reconciling Items(2) |
|
||||||||||||||||
Year Ended or at December 31, 2009
|
ILEC | CLEC | Total | |||||||||||||||||
| |
(Dollars in thousands) |
|||||||||||||||||||
Operating revenues |
$ | 4,214,611 | $ | 599,527 | $ | 199,375 | $ | 46,714 | $ | (39,553 | ) | $ | 5,020,674 | |||||||
Cost of services and products |
1,539,610 | 194,030 | 104,057 | 36,573 | (9,844 | ) | 1,864,426 | |||||||||||||
Selling, general and administrative expense |
1,748,760 | 171,250 | 67,283 | 7,126 | (27,712 | ) | 1,966,707 | |||||||||||||
Operating income before certain non-cash items(3) |
926,241 | 234,247 | 28,035 | 3,015 | (1,997 | ) | 1,189,541 | |||||||||||||
Depreciation, amortization and accretion expense |
570,658 | 142,913 | 24,403 | 2,542 | 9,454 | 749,970 | ||||||||||||||
Loss on impairment of intangible assets |
14,000 | — | — | — | — | 14,000 | ||||||||||||||
Loss on asset disposals, net |
15,176 | 1,949 | 452 | 100 | 88 | 17,765 | ||||||||||||||
Operating income (loss) |
326,407 | 89,385 | 3,180 | 373 | (11,539 | ) | 407,806 | |||||||||||||
Significant non-operating items: |
||||||||||||||||||||
Equity in earnings of unconsolidated entities |
96,800 | 17 | — | — | (6,085 | ) | 90,732 | |||||||||||||
Investments in unconsolidated entities |
161,481 | 3,660 | — | — | 38,658 | 203,799 | ||||||||||||||
Total assets |
5,745,217 | 1,463,275 | 125,508 | 24,372 | 250,412 | 7,608,784 | ||||||||||||||
Capital expenditures |
$ | 546,758 | $ | 98,297 | $ | 22,240 | $ | 346 | $ | 3,524 | $ | 671,165 | ||||||||
| |
|
TDS Telecom | |
|
|
|||||||||||||||
|---|---|---|---|---|---|---|---|---|---|---|---|---|---|---|---|---|---|---|---|---|
| |
U.S. Cellular |
Non- Reportable Segment(1) |
Other Reconciling Items(2) |
|
||||||||||||||||
Year Ended or at December 31, 2008
|
ILEC | CLEC | Total | |||||||||||||||||
| |
(Dollars in thousands) |
|||||||||||||||||||
Operating revenues |
$ | 4,243,185 | $ | 611,034 | $ | 220,002 | $ | 53,170 | $ | (35,372 | ) | $ | 5,092,019 | |||||||
Cost of services and products |
1,527,463 | 184,285 | 109,457 | 40,381 | (7,900 | ) | 1,853,686 | |||||||||||||
Selling, general and administrative expense |
1,701,050 | 166,787 | 69,040 | 9,251 | (24,698 | ) | 1,921,430 | |||||||||||||
Operating income before certain non-cash items(3) |
1,014,672 | 259,962 | 41,505 | 3,538 | (2,774 | ) | 1,316,903 | |||||||||||||
Depreciation, amortization and accretion expense |
576,931 | 134,935 | 23,431 | 2,909 | 11,871 | 750,077 | ||||||||||||||
Loss on impairment of intangible assets |
386,653 | — | — | — | 27,723 | 414,376 | ||||||||||||||
Loss on asset disposals, net |
23,378 | 466 | 391 | — | 61 | 24,296 | ||||||||||||||
Operating income (loss) |
27,710 | 124,561 | 17,683 | 629 | (42,429 | ) | 128,154 | |||||||||||||
Significant non-operating items: |
||||||||||||||||||||
Equity in earnings of unconsolidated entities |
91,981 | 22 | — | — | (2,191 | ) | 89,812 | |||||||||||||
Gain (loss) on investments and financial instruments |
16,628 | 17,758 | — | — | (2,791 | ) | 31,595 | |||||||||||||
Investments in unconsolidated entities |
156,637 | 6,517 | — | — | 42,614 | 205,768 | ||||||||||||||
Total assets |
5,566,042 | 1,397,414 | 127,673 | 26,733 | 534,554 | 7,652,416 | ||||||||||||||
Capital expenditures |
$ | 585,590 | $ | 120,927 | $ | 19,832 | $ | 1,362 | $ | 7,212 | $ | 734,923 | ||||||||
| |
|
TDS Telecom | |
|
|
|||||||||||||||
|---|---|---|---|---|---|---|---|---|---|---|---|---|---|---|---|---|---|---|---|---|
| |
U.S. Cellular |
Non- Reportable Segment(1) |
Other Reconciling Items(2) |
|
||||||||||||||||
Year Ended or at December 31, 2007
|
ILEC | CLEC | Total | |||||||||||||||||
| |
(Dollars in thousands) |
|||||||||||||||||||
Operating revenues |
$ | 3,946,264 | $ | 629,983 | $ | 236,529 | $ | 48,016 | $ | (31,808 | ) | $ | 4,828,984 | |||||||
Cost of services and products |
1,354,372 | 193,761 | 116,612 | 36,225 | (7,439 | ) | 1,693,531 | |||||||||||||
Selling, general and administrative expense |
1,558,568 | 175,392 | 82,083 | 8,145 | (23,708 | ) | 1,800,480 | |||||||||||||
Operating income before certain non-cash items(3) |
1,033,324 | 260,830 | 37,834 | 3,646 | (661 | ) | 1,334,973 | |||||||||||||
Depreciation, amortization and accretion expense |
578,186 | 133,440 | 24,022 | 2,665 | 9,823 | 748,136 | ||||||||||||||
Loss on impairment of intangible assets |
24,923 | — | — | — | — | 24,923 | ||||||||||||||
Loss on asset disposals, net |
34,016 | — | — | — | — | 34,016 | ||||||||||||||
Operating income (loss) |
396,199 | 127,390 | 13,812 | 981 | (10,484 | ) | 527,898 | |||||||||||||
Significant non-operating items: |
||||||||||||||||||||
Equity in earnings of unconsolidated entities |
90,033 | 70 | — | — | 1,728 | 91,831 | ||||||||||||||
Gain (loss) on investments and financial instruments |
132,599 | — | — | — | (51,176 | ) | 81,423 | |||||||||||||
Marketable equity securities |
16,352 | — | — | — | 1,901,542 | 1,917,894 | ||||||||||||||
Investments in unconsolidated entities |
157,693 | 3,677 | — | — | 45,048 | 206,418 | ||||||||||||||
Total assets |
5,611,874 | 1,679,838 | 145,864 | 27,792 | 2,428,775 | 9,894,143 | ||||||||||||||
Capital expenditures |
$ | 565,495 | $ | 111,806 | $ | 16,374 | $ | 1,461 | $ | 4,430 | $ | 699,566 | ||||||||
| (1) | Represents Suttle-Straus. |
| 2 | Consists of the corporate operations, intercompany eliminations and other corporate investments. |
| 3 | The amount of Operating income before certain non-cash items is a segment measure reported to the chief operating decision maker for purposes of making decisions about allocating resources to the segments and assessing their performance. The non-cash items excluded from this subtotal are Depreciation, amortization and accretion, Loss on asset disposals, net (if any) and Loss on impairment of intangible assets (if any). This amount may also be commonly referred to by management as operating cash flow. |
NOTE 20 SUPPLEMENTAL CASH FLOW DISCLOSURES
Following are supplemental cash flow disclosures regarding interest paid and income taxes paid.
Year Ended December 31,
|
2009 | 2008 | 2007 | |||||||
|---|---|---|---|---|---|---|---|---|---|---|
| |
(Dollars in thousands) |
|||||||||
Interest paid |
$ | 130,084 | $ | 136,156 | $ | 196,696 | ||||
Income taxes paid |
53,009 | 470,033 | 500,899 | |||||||
Following are supplemental cash flow disclosures regarding transactions related to stock-based compensation awards:
TDS:
Year Ended December 31,
|
2009 | 2008 | 2007 | ||||||||
|---|---|---|---|---|---|---|---|---|---|---|---|
| |
(Dollars in thousands) |
||||||||||
Common Shares withheld(1) |
— | 11,028 | 38,805 | ||||||||
Special Common Shares withheld(1) |
26,999 | 44,873 | 59,432 | ||||||||
Aggregate value of Common Shares withheld |
$ |
— |
$ |
559 |
$ |
2,531 |
|||||
Aggregate value of Special Common Shares withheld |
811 | 1,575 | 3,563 | ||||||||
Cash receipts upon exercise of stock options |
$ |
1,630 |
$ |
2,628 |
$ |
119,087 |
|||||
Cash disbursements for payment of taxes(2) |
(811 | ) | (1,219 | ) | (5,482 | ) | |||||
Net cash receipts from exercise of stock options and vesting of other stock awards |
$ | 819 | $ | 1,409 | $ | 113,605 | |||||
U.S. Cellular:
Year Ended December 31,
|
2009 | 2008 | 2007 | |||||||
|---|---|---|---|---|---|---|---|---|---|---|
| |
(Dollars in thousands) |
|||||||||
Common Shares withheld(1) |
200,025 | 368,231 | 716,446 | |||||||
Aggregate value of Common Shares withheld |
$ |
7,622 |
$ |
20,055 |
$ |
59,969 |
||||
Cash receipts upon exercise of stock options |
$ |
1,572 |
$ |
3,588 |
$ |
23,582 |
||||
Cash disbursements for payment of taxes(2) |
(1,654 | ) | (5,876 | ) | (13,509 | ) | ||||
Net cash receipts (disbursements) from exercise of stock options and vesting of other stock awards |
$ | (82 | ) | $ | (2,288 | ) | $ | 10,073 | ||
| (1) | Such shares were withheld to cover the exercise price of stock options, if applicable, and required tax withholdings. |
| (2) | In certain situations, TDS and U.S. Cellular withhold shares that are issuable upon the exercise of stock options or the vesting of restricted shares to cover, and with a value equivalent to, the exercise price and/or the amount of taxes required to be withheld from the stock award holder at the time of the exercise or vesting. TDS and U.S. Cellular then pay the amount of the required tax withholdings to the taxing authorities in cash. |
NOTE 21 CERTAIN RELATIONSHIPS AND RELATED TRANSACTIONS
The following persons are partners of Sidley Austin LLP, the principal law firm of TDS and its subsidiaries: Walter C.D. Carlson, a trustee and beneficiary of a voting trust that controls TDS, the non-executive Chairman of the Board and member of the Board of Directors of TDS and a director of U.S. Cellular, a subsidiary of TDS; William S. DeCarlo, the General Counsel of TDS and an Assistant Secretary of TDS and certain subsidiaries of TDS; and Stephen P. Fitzell, the General Counsel of U.S. Cellular and TDS Telecommunications Corporation and an Assistant Secretary of certain subsidiaries of TDS. Walter C.D. Carlson does not provide legal services to TDS or its subsidiaries. TDS, U.S. Cellular and their subsidiaries incurred legal costs from Sidley Austin LLP of $13.8 million in 2009, $12.0 million in 2008 and $11.2 million in 2007.
On May 29, 2009, TDS repurchased 1,730,200 Special Common Shares at the then current market price on the New York Stock Exchange ("NYSE") for a total price of $48.2 million, or an average of $27.89 per Special Common Share including broker fees, from an affiliate of Southeastern Asset Management, Inc. ("SEAM"). In addition, on July 20, 2009, TDS repurchased 405,000 Special Common Shares from SEAM at a price below the then current market price on the NYSE for a total price of $10.5 million, or an average of $25.87 per Special Common Share including broker fees.
At the time, SEAM was a shareholder of more than 5% of TDS Special Common Shares and Common Shares, and currently continues to hold more than 5% of the Special Common Shares. See "Security Ownership by Certain Beneficial Owners" in TDS' Notice of Annual Meeting and Proxy Statement filed with the SEC on April 28, 2009 for further information about SEAM and its interest in TDS. These transactions were not solicited by TDS and TDS did not enter into any agreements with SEAM. The May 29, 2009 transaction was effected by TDS' broker pursuant to TDS' existing institutional brokerage account agreement on the NYSE in compliance with Rule 10b-18 under the Securities Exchange Act of 1934, as amended ("Exchange Act"). The July 20, 2009 transaction was made by TDS' broker pursuant to an agreement entered into pursuant to Rule 10b5-1 under the Exchange Act and was effected on the NYSE in compliance with Rule 10b-18. The repurchases were made under TDS' existing share repurchase authorization.
The Audit Committee of the Board of Directors is responsible for the review and evaluation of all related party transactions, as such term is defined by the rules of the New York Stock Exchange.
Management's Responsibility for Financial Statements
Management of Telephone and Data Systems, Inc. has the responsibility for preparing the accompanying consolidated financial statements and for their integrity and objectivity. The statements were prepared in accordance with accounting principles generally accepted in the United States of America and, in management's opinion, were fairly presented. The financial statements included amounts that were based on management's best estimates and judgments. Management also prepared the other information in the annual report and is responsible for its accuracy and consistency with the financial statements.
PricewaterhouseCoopers LLP, an independent registered public accounting firm, has audited these consolidated financial statements in accordance with the standards of the Public Company Accounting Oversight Board (United States) and has expressed herein its unqualified opinion on these financial statements.
| /s/ LeRoy T. Carlson, Jr. LeRoy T. Carlson, Jr. President and Chief Executive Officer (Principal Executive Officer) |
/s/ Kenneth R. Meyers Kenneth R. Meyers Executive Vice President and Chief Financial Officer (Principal Financial Officer) |
/s/ Douglas D. Shuma Douglas D. Shuma Senior Vice President and Controller (Principal Accounting Officer) |
Management's Report on Internal Control Over Financial Reporting
Management is responsible for establishing and maintaining adequate internal control over financial reporting, as such term is defined in Rules 13a-15(f) and 15d-15(f) under the Exchange Act. TDS' internal control over financial reporting is a process designed to provide reasonable assurance regarding the reliability of financial reporting and the preparation of financial statements for external purposes in accordance with accounting principles generally accepted in the United States of America ("GAAP"). TDS' internal control over financial reporting includes those policies and procedures that (i) pertain to the maintenance of records that, in reasonable detail, accurately and fairly reflect the transactions and dispositions of the assets of the issuer; (ii) provide reasonable assurance that transactions are recorded as necessary to permit preparation of financial statements in accordance with GAAP, and that receipts and expenditures of the issuer are being made only in accordance with authorizations of management and, where required, the Board of Directors of the issuer; and (iii) provide reasonable assurance regarding prevention or timely detection of unauthorized acquisition, use, or disposition of the issuer's assets that could have a material effect on the interim or annual consolidated financial statements.
Because of its inherent limitations, internal control over financial reporting may not prevent or detect misstatements. Also, projections of any evaluation of effectiveness to future periods are subject to the risk that controls may become inadequate because of changes in conditions, or that the degree of compliance with the policies or procedures may deteriorate.
Under the supervision and with the participation of TDS' management, including its Chief Executive Officer and Chief Financial Officer, TDS conducted an evaluation of the effectiveness of its internal control over financial reporting as of December 31, 2009, based on the criteria established in Internal Control—Integrated Framework issued by the Committee of Sponsoring Organizations of the Treadway Commission (COSO). Management has concluded that TDS maintained effective internal control over financial reporting as of December 31, 2009 based on criteria established in Internal Control—Integrated Framework issued by the COSO.
The effectiveness of TDS' internal control over financial reporting as of December 31, 2009 has been audited by PricewaterhouseCoopers LLP, an independent registered public accounting firm, as stated in the firm's report included herein.
| /s/ LeRoy T. Carlson, Jr. LeRoy T. Carlson, Jr. President and Chief Executive Officer (Principal Executive Officer) |
/s/ Kenneth R. Meyers Kenneth R. Meyers Executive Vice President and Chief Financial Officer (Principal Financial Officer) |
/s/ Douglas D. Shuma Douglas D. Shuma Senior Vice President and Controller (Principal Accounting Officer) |
To the Board of Directors and Stockholders of
Telephone and Data Systems, Inc.:
In our opinion, based on our audits and the report of other auditors, the accompanying consolidated balance sheets and the related consolidated statements of operations, comprehensive income, changes in equity, and cash flows present fairly, in all material respects, the financial position of Telephone and Data Systems, Inc. and its subsidiaries at December 31, 2009 and 2008, and the results of their operations and their cash flows for each of the three years in the period ended December 31, 2009 in conformity with accounting principles generally accepted in the United States of America. Also in our opinion, based on our audit and the report of other auditors, the Company maintained, in all material respects, effective internal control over financial reporting as of December 31, 2009, based on criteria established in Internal Control—Integrated Framework issued by the Committee of Sponsoring Organizations of the Treadway Commission (COSO). The Company's management is responsible for these financial statements, for maintaining effective internal control over financial reporting and for its assessment of the effectiveness of internal control over financial reporting, included in the accompanying Management's Report on Internal Control over Financial Reporting. Our responsibility is to express opinions on these financial statements and on the Company's internal control over financial reporting based on our integrated audits. We did not audit the financial statements of Los Angeles SMSA Limited Partnership, a 5.5% owned entity accounted for by the equity method of accounting. The consolidated financial statements of Telephone and Data Systems, Inc. reflect an investment in this partnership of $116,000,000 and $117,300,000 as of December 31, 2009 and 2008, respectively, and equity earnings of $64,700,000, $66,100,000, and $71,200,000, respectively for each of the three years in the period ended December 31, 2009. The financial statements of Los Angeles SMSA Limited Partnership were audited by other auditors whose report thereon has been furnished to us, and our opinion on the financial statements expressed herein, insofar as it relates to the amounts included for Los Angeles SMSA Limited Partnership, is based solely on the report of the other auditors. We conducted our audits in accordance with the standards of the Public Company Accounting Oversight Board (United States). Those standards require that we plan and perform the audits to obtain reasonable assurance about whether the financial statements are free of material misstatement and whether effective internal control over financial reporting was maintained in all material respects. Our audits of the financial statements included examining, on a test basis, evidence supporting the amounts and disclosures in the financial statements, assessing the accounting principles used and significant estimates made by management, and evaluating the overall financial statement presentation. Our audit of internal control over financial reporting included obtaining an understanding of internal control over financial reporting, assessing the risk that a material weakness exists, and testing and evaluating the design and operating effectiveness of internal control based on the assessed risk. Our audits also included performing such other procedures as we considered necessary in the circumstances. We believe that our audits provide a reasonable basis for our opinions.
As discussed in Notes 1, 2, 3 and 4 to the consolidated financial statements, the Company changed the manner in which it accounts for noncontrolling interests and business combinations in 2009, financial assets and liabilities in 2008, and the manner in which it accounts for uncertain tax positions in 2007.
A company's internal control over financial reporting is a process designed to provide reasonable assurance regarding the reliability of financial reporting and the preparation of financial statements for external purposes in accordance with generally accepted accounting principles. A company's internal control over financial reporting includes those policies and procedures that (i) pertain to the maintenance of records that, in reasonable detail, accurately and fairly reflect the transactions and dispositions of the assets of the company; (ii) provide reasonable assurance that transactions are recorded as necessary to permit preparation of financial statements in accordance with generally accepted accounting principles, and that receipts and expenditures of the company are being made only in accordance with authorizations of management and directors of the company; and (iii) provide reasonable assurance regarding prevention or timely detection of unauthorized acquisition, use, or disposition of the company's assets that could have a material effect on the financial statements.
Because of its inherent limitations, internal control over financial reporting may not prevent or detect misstatements. Also, projections of any evaluation of effectiveness to future periods are subject to the risk that controls may become inadequate because of changes in conditions, or that the degree of compliance with the policies or procedures may deteriorate.

Chicago, Illinois
February 25, 2010
|
||||||||||||||||||||||||||||||||||||||||||||||||||||||||||||||||||||||||||||||||||||||||||||||||||||||||||||||||||||||||||||||||||||||||||||||||||||||||||||||||||||||||||||||||||||||||||||||||||||||||||||||||||||||||||||||||||||||||||||||||||||||||||||||||||||||||||||||||||||||||||||||||||||||||||||||||||||||||||||||||||||||||||||||||||||||||||||||||||||||||||||||||||||||||||||||||||||||||||||||||||||||||||||||||||||||||||||||||||||||||||||||||||||||||||||||||||||||||||||||||||||||||||||||||||||||||||||||||||||||||||||||||||||||||||||||||||||||||||||||||||||||||||||||||||||||||||||||||||||||||||||||||||||||||||||||||||||||||||||||||||||||||||||||||||||||||||||||||||||||||||||||||||||||||||||||||||||||||||||||||||||||||||||||||||||||||||||||||||||||||||||||||||||||||||||||||||||||||||||||||
(a)
Includes Loss on impairment of intangible assets of $14.0 million in 2009, $414.4 million in 2008 and $24.9 million in 2007.
(b)
TDS distributed one Special Common Share in the form of a stock dividend with respect to each outstanding Common Share and Series A Common Share of TDS on May 13, 2005 to shareholders of record on April 29, 2005. Earnings per share for the entire year 2005 was retroactively adjusted to give effect to this new capital structure.
(c)
Calculated by dividing current assets by current liabilities. These amounts are taken directly from the Consolidated Balance Sheet.
(d)
Calculated by dividing Net income attributable to TDS shareholders excluding the impact of Extraordinary item, net of taxes, by the average of beginning and ending Total TDS stockholders' equity. Those amounts are taken from the Consolidated Statement of Operations and Balance Sheet. The result is shown as a percentage.
At or Year Ended December 31,
|
2009 | 2008 | 2007 | 2006 | 2005 | ||||||||||||
|---|---|---|---|---|---|---|---|---|---|---|---|---|---|---|---|---|---|
| |
(Dollars in thousands, except per unit amounts) |
||||||||||||||||
Wireless Operations |
|||||||||||||||||
Total customers |
6,141,000 | 6,196,000 | 6,102,000 | 5,815,000 | 5,482,000 | ||||||||||||
Postpay customers |
5,482,000 | 5,420,000 | 5,269,000 | 4,912,000 | 4,633,000 | ||||||||||||
Total population(a) |
|||||||||||||||||
Consolidated markets |
89,712,000 | 83,014,000 | 82,371,000 | 55,543,000 | 45,244,000 | ||||||||||||
Consolidated operating markets |
46,306,000 | 46,009,000 | 44,955,000 | 44,043,000 | 43,362,000 | ||||||||||||
Market penetration(b) |
|||||||||||||||||
Consolidated markets |
6.8 | % | 7.5 | % | 7.4 | % | 10.5 | % | 12.1 | % | |||||||
Consolidated operating markets |
13.3 | % | 13.5 | % | 13.6 | % | 13.2 | % | 12.6 | % | |||||||
Net customer additions (losses) |
(55,000 | ) | 91,000 | 301,000 | 281,000 | 477,000 | |||||||||||
Postpay churn rate(c) |
1.6 | % | 1.5 | % | 1.4 | % | 1.6 | % | 1.6 | % | |||||||
Average monthly service revenue per customer(d) |
$ | 53.00 | $ | 53.23 | $ | 51.17 | $ | 47.23 | $ | 45.24 | |||||||
Wireline Operations |
|||||||||||||||||
ILEC |
|||||||||||||||||
Equivalent access lines served(e) |
775,900 | 776,700 | 762,700 | 757,300 | 735,300 | ||||||||||||
Telephone companies |
115 | 114 | 111 | 111 | 111 | ||||||||||||
Capital expenditures |
$ | 87,348 | $ | 120,927 | $ | 111,806 | $ | 113,179 | $ | 97,493 | |||||||
CLEC |
|||||||||||||||||
Equivalent access lines served(e) |
355,900 | 393,000 | 435,000 | 456,200 | 448,600 | ||||||||||||
Capital expenditures |
$ | 19,033 | $ | 19,832 | $ | 16,374 | $ | 17,255 | $ | 27,117 | |||||||
Financial Position |
|||||||||||||||||
Common, Special Common and Series A Common Shares outstanding (000s) |
106,022 | 112,198 | 117,823 | 116,592 | 115,555 | ||||||||||||
Price/earnings ratio(f) |
36.23 | 74.81 | 42.03 | 75.86 | 12.71 | ||||||||||||
Common equity per share |
29.74 | 29.67 | 30.93 | 28.13 | 25.38 | ||||||||||||
Year-end stock price |
|||||||||||||||||
Common Shares |
$ | 33.92 | $ | 31.75 | $ | 62.60 | $ | 54.33 | $ | 36.03 | |||||||
Special Common Shares |
30.20 | 28.10 | 57.60 | 49.60 | 34.61 | ||||||||||||
Combined |
$ | 64.12 | $ | 59.85 | $ | 120.20 | $ | 103.93 | $ | 70.64 | |||||||
(a)
Calculated using Claritas population estimates for the preceding year. "Consolidated markets" represents 100% of the population of the markets that U.S. Cellular consolidates. "Consolidated operating markets" are markets that U.S. Cellular consolidates and in which wireless services are provided to customers as of December 31 of each year. This population measurement is used only for purposes of calculating market penetration (without duplication of population in overlapping markets).
(b)
Calculated by dividing "Customers" by "Total population of consolidated markets" or "Total population of consolidated operating markets."
(c)
Represents the percentage of the postpay customer base that disconnects service each month.
(d)
The numerator of this calculation consists of service revenues for the respective 12-month period divided by 12. The denominator consists of the average number of U.S. Cellular wireless customers.
(e)
Equivalent access lines are the sum of physical access lines and high-capacity data lines adjusted to estimate the equivalent number of physical access lines in terms of capacity. A physical access line is the individual circuit connecting a customer to a telephone company's central office facilities.
(f)
Based on the year-end stock price divided by diluted earnings per share from continuing operations attributable to TDS shareholders.
| |
Quarter Ended | ||||||||||||||
|---|---|---|---|---|---|---|---|---|---|---|---|---|---|---|---|
| |
March 31 | June 30 | September 30 | December 31 | |||||||||||
| |
(Amounts in thousands, except per share amounts) |
||||||||||||||
2009 |
|||||||||||||||
Operating revenues |
$ | 1,256,646 | $ | 1,242,477 | $ | 1,258,742 | $ | 1,262,809 | |||||||
Loss on impairment of intangible assets(1) |
— | — | — | 14,000 | |||||||||||
Operating income(1)(3)(4) |
136,209 | 154,600 | 77,663 | 39,334 | |||||||||||
Net income |
93,374 | 90,559 | 47,265 | 22,528 | |||||||||||
Net income attributable to TDS shareholders |
$ | 72,008 | $ | 69,731 | $ | 35,645 | $ | 16,518 | |||||||
Basic weighted average shares outstanding |
112,238 | 110,741 | 108,289 | 106,166 | |||||||||||
Basic earnings per share attributable to TDS shareholders |
$ | 0.64 | $ | 0.63 | $ | 0.33 | $ | 0.16 | |||||||
Diluted weighted average shares outstanding |
112,427 | 110,971 | 108,565 | 106,489 | |||||||||||
Diluted earnings per share attributable to TDS shareholders |
$ | 0.64 | $ | 0.63 | $ | 0.33 | $ | 0.15 | |||||||
Stock price |
|||||||||||||||
TDS Common Shares(2) |
|||||||||||||||
High |
$ | 35.98 | $ | 33.80 | $ | 31.69 | $ | 34.94 | |||||||
Low |
24.20 | 22.01 | 24.63 | 29.39 | |||||||||||
Close |
26.51 | 28.30 | 31.01 | 33.92 | |||||||||||
TDS Special Common Shares(2) |
|||||||||||||||
High |
31.17 | 30.49 | 30.45 | 30.95 | |||||||||||
Low |
21.89 | 22.87 | 23.33 | 27.16 | |||||||||||
Close |
23.65 | 25.96 | 29.68 | 30.20 | |||||||||||
Dividends paid |
$ | 0.1075 | $ | 0.1075 | $ | 0.1075 | $ | 0.1075 | |||||||
| |
Quarter Ended | ||||||||||||||
|---|---|---|---|---|---|---|---|---|---|---|---|---|---|---|---|
| |
March 31 | June 30 | September 30 | December 31 | |||||||||||
| |
(Amounts in thousands, except per share amounts) |
||||||||||||||
2008 |
|||||||||||||||
Operating revenues |
$ | 1,249,101 | $ | 1,274,351 | $ | 1,304,598 | $ | 1,263,969 | |||||||
Loss on impairment of intangible assets(1) |
— | — | — | 414,376 | |||||||||||
Operating income(1) |
153,609 | 149,743 | 152,139 | (327,337 | ) | ||||||||||
Gain (loss) on investments and financial instruments |
(3,490 | ) | 3,088 | 31,997 | — | ||||||||||
Net income |
90,505 | 106,266 | 122,994 | (196,852 | ) | ||||||||||
Net income attributable to TDS shareholders |
$ | 73,487 | $ | 87,757 | $ | 101,223 | $ | (168,926 | ) | ||||||
Basic weighted average shares outstanding |
117,570 | 116,267 | 115,700 | 113,711 | |||||||||||
Basic earnings per share attributable to TDS shareholders |
$ | 0.62 | $ | 0.75 | $ | 0.87 | $ | (1.49 | ) | ||||||
Diluted weighted average shares outstanding |
118,191 | 116,814 | 116,193 | 113,711 | |||||||||||
Diluted earnings per share attributable to TDS shareholders |
$ | 0.62 | $ | 0.75 | $ | 0.87 | $ | (1.49 | ) | ||||||
Stock price |
|||||||||||||||
TDS Common Shares(2) |
|||||||||||||||
High |
$ | 66.19 | $ | 54.00 | $ | 51.89 | $ | 38.93 | |||||||
Low |
37.84 | 37.02 | 27.96 | 21.24 | |||||||||||
Close |
39.27 | 47.27 | 35.75 | 31.75 | |||||||||||
TDS Special Common Shares(2) |
|||||||||||||||
High |
58.30 | 51.72 | 43.85 | 37.95 | |||||||||||
Low |
35.90 | 35.06 | 31.55 | 22.18 | |||||||||||
Close |
37.30 | 44.10 | 35.90 | 28.10 | |||||||||||
Dividends paid |
$ | 0.1025 | $ | 0.1025 | $ | 0.1025 | $ | 0.1025 | |||||||
| (1) | During the fourth quarters of 2009 and 2008, TDS recognized a Loss on impairment of intangible assets related to licenses of $14.0 million and $414.4 million, respectively. See Note 9—Licenses and Goodwill in the Notes to Consolidated Financial Statements for details of these impairments. |
| (2) | The high, low and closing sales prices as reported by either the American Stock Exchange ("AMEX") or the New York Stock Exchange ("NYSE"). TDS' Common Shares and Special Common Shares traded on the AMEX prior to and on September 14, 2008, and traded on the NYSE after this date. |
| (3) | During the quarter ended December 31, 2009, Operating expenses were reduced by a $7.1 million out-of period adjustment to correct rent expense. Approximately $6.1 million of this adjustment reduced Cost of services and products and $1.0 million reduced Selling, general and administrative expense. Management does not believe that the adjustment is material to the current year or any prior year's earnings, earnings trends or financial statement line items. The adjustment was recorded in the quarter ended December 31, 2009 and no prior periods were adjusted. The impact of the out-of-period adjustment on the affected line items in the Consolidated Statement of Operations is as follows: |
| |
Quarter Ended December 31, 2009 Increase (Decrease) |
Year Ended December 31, 2009 Increase (Decrease) |
||||||
|---|---|---|---|---|---|---|---|---|
| |
(Amounts in thousands) |
|||||||
Cost of services and products |
$ | (6,090 | ) | $ | (5,813 | ) | ||
Selling, general and administrative |
(1,009 | ) | (696 | ) | ||||
Total operating expenses |
(7,099 | ) | (6,509 | ) | ||||
Operating income |
7,099 | 6,509 | ||||||
Income before income taxes |
7,099 | 6,509 | ||||||
| (4) | During the quarter ended December 31, 2009, TDS recorded adjustments that reduced Cost of services and products and increased Selling, general and administrative expense by $9.7 million and $11.6 million, respectively, to reflect revised estimates related to customer usage charges and bad debts expense. The net of these adjustments was an increase to Operating expenses of $1.9 million during the quarter ended December 31, 2009. |
TDS Stock and dividend information
TDS' Common Shares are listed on the New York Stock Exchange ("NYSE") under the symbol "TDS." TDS' Special Common Shares are listed on the NYSE under the symbol "TDS.S." As of January 29, 2010, the last trading day of the month, TDS Common Shares were held by 1,650 record owners, the Special Common Shares were held by 1,722 record owners, and the Series A Common Shares were held by 81 record owners.
TDS has paid cash dividends on its common stock since 1974, and paid dividends of $0.43 per Common, Special Common and Series A Common Share during 2009. During 2008, TDS paid dividends of $0.41 per Common, Special Common and Series A Common Share.
The Common Shares of United States Cellular Corporation, an 82%-owned subsidiary of TDS, are listed on the NYSE under the symbol "USM".
See "Consolidated Quarterly Information (Unaudited)" for information on the high and low trading prices of the TDS Common Shares and TDS Special Common Shares for 2009 and 2008.
Stock performance graph
The following chart provides a comparison of TDS' cumulative total return to shareholders (stock price appreciation plus dividends) during the previous five years to the returns of the Standard & Poor's 500 Composite Stock Price Index and the Dow Jones U.S. Telecommunications Index. As of December 31, 2009, the Dow Jones U.S. Telecommunications Index was composed of the following companies: AT&T Inc., CenturyTel Inc., Cincinnati Bell Inc., Frontier Communications Corp., Leap Wireless International Inc., Leucadia National Corp., Level 3 Communications Inc., MetroPCS Communications Inc., NII Holdings Inc., Qwest Communications International Inc., Sprint Nextel Corp., Telephone and Data Systems, Inc. (TDS and TDS.S), tw telecom, inc., United States Cellular Corporation, Verizon Communications Inc., Virgin Media Inc. and Windstream Corp.
Comparison of Cumulative Five Year Total Return*
TDS, S&P 500 and Dow Jones U.S. Telecommunications Index
(Performance Results Through 12/31/09)
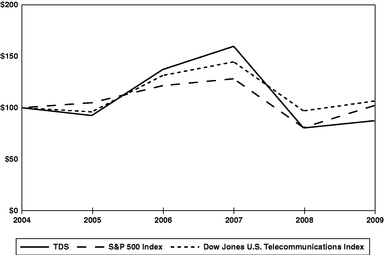
*
Cumulative total return assumes reinvestment of dividends.
| |
2004 | 2005 | 2006 | 2007 | 2008 | 2009 | |||||||||||||
|---|---|---|---|---|---|---|---|---|---|---|---|---|---|---|---|---|---|---|---|
Telephone and Data Systems, Inc. |
$ | 100 | $ | 92.44 | $ | 137.14 | $ | 159.67 | $ | 80.35 | $ | 87.41 | |||||||
S&P 500 Index |
100 | 104.91 | 121.48 | 128.16 | 80.74 | 102.11 | |||||||||||||
Dow Jones U.S. Telecommunications Index |
100 | 96.00 | 131.36 | 144.55 | 96.94 | 106.49 | |||||||||||||
Assumes $100.00 invested at the close of trading on the last trading day preceding the first day of 2004, in TDS Common Shares, S&P 500 Index and the Dow Jones U.S. Telecommunications Index.
After the close of business on May 13, 2005, TDS distributed a stock dividend of one Special Common Share of TDS with respect to each outstanding TDS Common Share and Series A Common Share. For purposes of the stock performance chart, the performance of TDS for all periods presented prior to May 13, 2005 is represented by the TDS Common Shares, and for the period between May 13, 2005 and December 31, 2009 includes both the TDS Common Shares and TDS Special Common Shares. The last closing price of TDS Common Shares on May 13, 2005 prior to the impact of the stock dividend was $74.57. The closing price on May 16, 2005, the first trading day after the stock dividend, was $38.19 for the TDS Common Shares and $36.25 for the TDS Special Common Shares, or a total of $74.44. The closing price on December 31, 2009, the last trading day of 2009, was $33.92 for the TDS Common Shares and $30.20 for the TDS Special Common Shares, or a total of $64.12.
Dividend reinvestment plan
TDS' dividend reinvestment plans provide its common and preferred shareholders with a convenient and economical way to participate in the future growth of TDS. Common, Special Common and Preferred shareholders of record owning ten (10) or more shares may purchase Common Shares (in the case of Common and Preferred shareholders) and Special Common Shares (in the case of Special Common shareholders) with their reinvested dividends at a five percent discount from market price. Shares may also be purchased, at market price, on a monthly basis through optional cash payments of up to $5,000 in any calendar quarter. The initial ten (10) shares cannot be purchased directly from TDS. An authorization card and prospectus will be mailed automatically by the transfer agent to all registered record holders with ten (10) or more shares. Once enrolled in the plan, there are no brokerage commissions or service charges for purchases made under the plan.
Investor relations
TDS' annual report, SEC filings and news releases are available to investors, securities analysts and other members of the investment community. These reports are provided, without charge, upon request to our Corporate Office. Investors may also access these and other reports through the Investor Relations portion of the TDS website (www.teldta.com).
Questions regarding lost, stolen or destroyed certificates, consolidation of accounts, transferring of shares and name or address changes should be directed to:
Julie Mathews,
Manager—Investor Relations
Telephone and Data Systems, Inc.
30 North LaSalle Street, Suite 4000
Chicago, IL 60602
312.592.5341
312.630.1908 (fax)
julie.mathews@teldta.com
General inquiries by investors, securities analysts and other members of the investment community should be directed to:
Jane W. McCahon,
Vice President—Corporate Relations
Telephone and Data Systems, Inc.
30 North LaSalle Street, Suite 4000
Chicago, IL 60602
312.592.5379
312.630.1908 (fax)
jane.mccahon@teldta.com
Directors and executive officers
See "Election of Directors" and "Executive Officers" sections of the Proxy Statement issued in 2010 for the 2010 Annual Meeting.
Principal counsel
Sidley Austin LLP, Chicago, Illinois
Transfer agent
ComputerShare Investor Services
2 North LaSalle Street, 3rd Floor
Chicago, IL 60602
877.337.1575
Independent registered public accounting firm
PricewaterhouseCoopers LLP
Visit TDS' web site at www.teldta.com