|
|
EXECUTIVE OVERVIEW
Effective in the fourth quarter of 2003, the Company instituted a new segment reporting format to include three reportable business segments: Equity Markets, Derivative Markets, and Asset Management. Prior to this change, the Company reported two business segments: Equity Markets, which included equity and derivatives business activities, and Asset Management. This segment reporting change was made to better reflect management's approach to operating and directing the businesses and to more closely align financial and managerial reporting. Prior period segment data has been restated to conform to the 2003 presentation.
- Equity Markets We are a leading execution specialist providing comprehensive trade execution services to institutional and broker-dealer clients, offering capital commitment and access to a deep pool of liquidity across the depth and breadth of the U.S. equity markets.
- Derivative Markets We are a leading U.S. listed options market maker and specialist, providing comprehensive trade execution services to institutions and broker-dealers across a significant number of U.S. option products.
- Asset Management We operate an asset management business for institutions and high net worth individuals, managing $1.6 billion of assets as of the end of 2003. The Company's investment in the Deephaven Funds, which was $201.1 million at December 31, 2003, and related investment returns, are included within this segment.
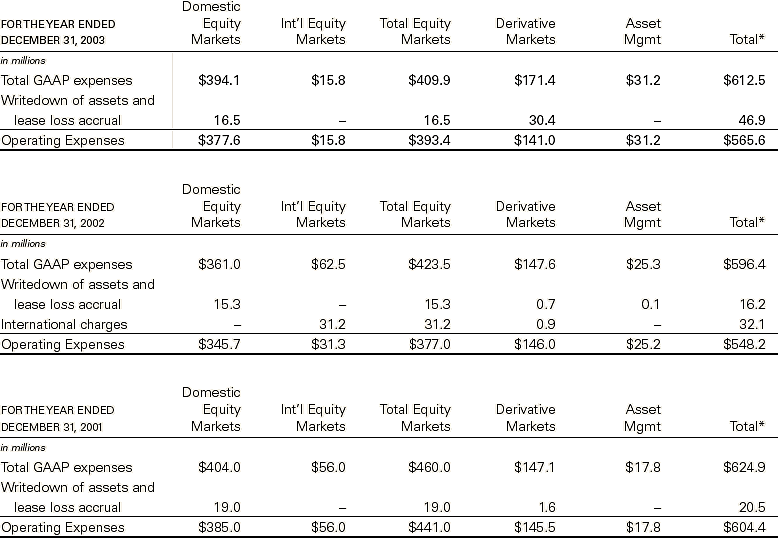
The following table sets forth the revenues, expenses excluding international charges and writedown of assets and lease loss accrual ("Operating Expenses") and income (loss) before international charges, writedown of assets and lease loss accrual, income taxes, minority interest and discontinued operations ("Pre-Tax Operating Earnings") of our segments and on a consolidated basis:
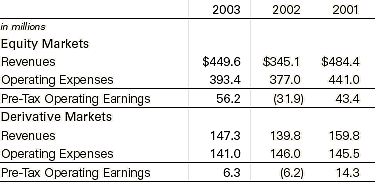
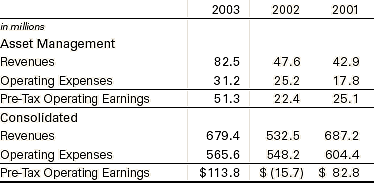
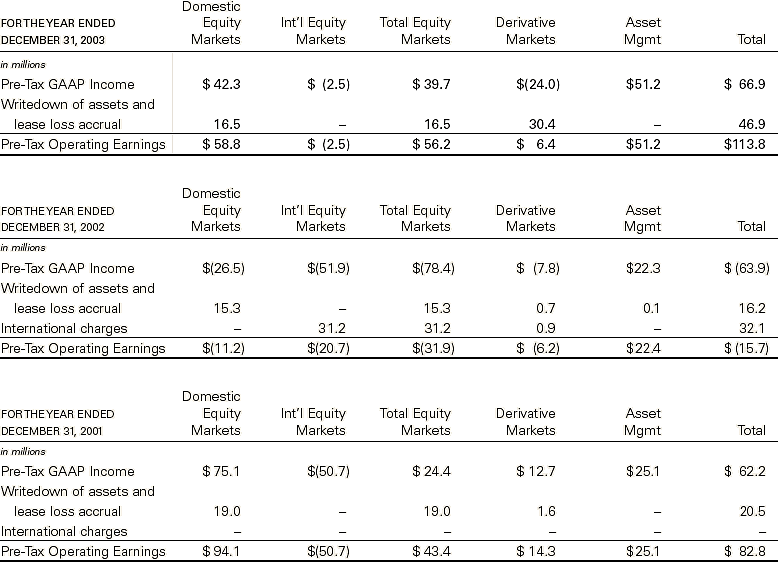
Our diluted earnings per share were $0.33 for 2003, up from a loss of $0.36 per share in 2002.Total revenues in 2003 increased 28% from 2002, while Operating Expenses increased 3%. Our Pre-Tax Operating Earnings increased to $113.8 million in 2003, up from a loss of $15.7 million in 2002.
The improvement in our 2003 financial results were primarily a result of the strong turnaround in our Equity Markets business, driven by the improvement in market conditions, the growth of our institutional business and cost cutting in the U.S., and the closure of our unprofitable international market-making businesses in Europe and Japan. Pre-tax Operating Earnings from our Asset Management business increased by over 100% in 2003 due to greater fund returns, the growth in our assets under management and the increase in our investment in the Deephaven Funds. Derivative Markets results also improved due to higher contract volumes and cost cutting.
A reconciliation of Pre-Tax Operating Earnings to GAAP income before income taxes, minority interest and discontinued operations ("Pre-Tax GAAP Income") is included elsewhere in this section.
Market and Economic Conditions in 2003
During the first few months of 2003, investors continued to be concerned with weak corporate earnings and increased uncertainty about the strength and pace of the domestic economic recovery coupled with increased geopolitical unrest. However, U.S. market and economic conditions improved significantly as the year progressed. As a result, U.S. financial markets rebounded and experienced increased volumes as investors began to re-enter the financial markets. During 2003, the Nasdaq Composite Index was up 50% from December 31, 2002. Similarly, the DJIA and the S&P 500 were up 25% and 26%, respectively, from December 31, 2002.
Certain Factors Affecting Results of Operations
We have experienced, and expect to continue to experience, significant fluctuations in operating results due to a variety of factors, including, but not limited to, introductions or enhancements to market-making services by us or our competitors; the value of our securities positions and our ability to manage the risks attendant thereto; the volume of our market-making activities; the dollar value of securities traded; volatility in the securities markets; our market share with institutional clients; the performance of our international operations; our ability to manage personnel, overhead and other expenses, including our occupancy expenses under our office leases and legal fees related to our legal proceedings; the strength of our client relationships; the amount of, and volatility in, the results of our quantitative market-making and program trading portfolios; changes in payments for order flow and clearing costs; the addition or loss of executive management and sales, trading and technology professionals; legislative, legal and regulatory changes; legal and regulatory matters; geopolitical risk; the amount and timing of capital expenditures and divestitures; the incurrence of costs associated with acquisitions and dispositions; investor sentiment; the level of assets under management; technological changes and events; seasonality; competition and market and economic conditions. Such factors may also have an impact on our ability to achieve our strategic objectives, including, without limitation, increases in our market share and revenue capture in our Equity and Derivative Markets segments and increases in our fund returns and assets under management in our Asset Management segment. If demand for our services declines in any of our business segments due to any of the above factors, and we are unable to adjust our cost structure on a timely basis, our operating results and strategic objectives could be materially and adversely affected.
As a result of the foregoing factors, period-to-period comparisons of our revenues and operating results are not necessarily meaningful and such comparisons cannot be relied upon as indicators of future performance.There also can be no assurance that we will be able to maintain the current rate of revenue growth or return to the rates of revenue growth that we have experienced in the past or that we will be able to improve our operating results.
Trends
We believe that our business is currently impacted by the following trends that may affect our financial condition and results of operations.
- Over the past three years, the effects of decimalization and other market structure changes, competition and market conditions have resulted in a decline in revenue capture per U.S. equity dollar value traded in our Equity Markets operations and revenue capture per contract in our Derivative Markets operations.
- Retail investor participation in the equity and options markets increased in 2003 from the prior two years, particularly in low-priced OTC Bulletin Board issues. This growth in retail transaction volumes may not be sustainable.
- Decimalization, market structure changes, competition and market conditions have triggered an industry shift from market makers trading OTC securities solely as principal to executing trades on a riskless principal or agency basis with institutions paying commission-equivalents or commissions, respectively. Currently, we execute the majority of our institutional client orders on a riskless principal or agency basis, charging commission-equivalents or commissions, respectively, and we execute the majority of our broker-dealer client orders as principal. In addition, institutional commission rates have fallen in the past few years, and this may continue in 2004.
- Market makers have reduced their payment for order flow rates as average revenue capture per U.S. equity dollar value traded and average revenue capture per contract have fallen. As a result, we have changed our payment for order flow rates several times over the past three years. In addition, we also have expanded our program of charging execution fees to certain of our broker-dealer clients for certain order flow.
- The introduction of SuperMontageSM by Nasdaq and the increase in trading of Nasdaq-listed securities on other exchanges has increased market fragmentation in the Equity Markets segment, resulting in increased execution expenses, fragmented liquidity pools and different market centers using different sets of regulatory rules and regulations. The Derivative Markets segment is also experiencing changes in market structure.
- Due to regulatory scrutiny over the past two years relating to equity research and the continued focus by investors on execution quality and overall transaction costs, more institutional commissions are being allocated to broker-dealers based on the quality of executions. In the past, institutional equity commissions were primarily allocated to broker-dealers in exchange for either research or soft dollar and commission recapture programs.This change is also resulting in pressure on commissions.
- Executions in the Equity Markets and Derivatives Markets segments are becoming increasingly automated. Increased automation results in improved efficiency and lower transaction costs, although it may lower the barriers to entry.
- There has been increased scrutiny of hedge funds and soft dollar practices by the regulatory and legislative authorities. New legislation or modifications to existing regulations and rules could occur in the future.
- There has been a growing trend among fund management companies and institutions to allocate more of their assets to hedge fund investments. This has influenced the growth in the hedge fund industry and may provide for greater competition in the future.
INCOME STATEMENT ITEMS
The following section briefly describes the key components of, and drivers to, our significant revenues and expenses.
Revenues
Our revenues consist principally of net trading revenue from U.S. securities trading and market-making activities from both Equity and Derivative Markets. Net trading revenue, which consists of trading gains net of trading losses and commission equivalents, is primarily affected by changes in the amount and mix of U.S. equity trade and share volumes and U.S. option contract volumes, our revenue capture, dollar value of equities traded, our ability to derive trading gains by taking proprietary positions, changes in our execution standards, volatility in the marketplace, our mix of broker-dealer and institutional clients and by regulatory changes and evolving industry customs and practices.
Securities transactions with clients are executed as principal, riskless principal or agent. Profits and losses on principal transactions and commission equivalents on riskless principal transactions are included within net trading revenue, and commissions earned on agency transactions are included within commissions and fees.We execute the majority of our institutional client orders on a riskless principal or agency basis, generating commission equivalents or commissions, respectively. We execute the majority of our broker-dealer client orders as principal.We also receive fees for providing certain information to market data providers and for directing trades to certain destinations for execution. Commissions and fees are primarily affected by changes in our trade and share volumes in listed securities, changes in commission rates as well as by changes in fees earned for directing trades to certain destinations for execution.
Asset management fees represent fees earned by Deephaven Capital Management LLC ("Deephaven") for sponsoring and managing the Deephaven investment funds (the "Deephaven Funds"). Asset management fees are primarily affected by the rates of return earned on the Deephaven Funds and changes in the amount of assets under management.
We earn interest income from our cash held at banks and cash held in trading accounts at clearing brokers. The Company's clearing agreements call for payment or receipt of interest income, net of transaction-related interest charged by clearing brokers for facilitating the settlement and financing of securities transactions. Net interest is primarily affected by interest rates, the changes in cash balances held at banks and clearing brokers and our level of securities positions in which we are long compared to our securities positions in which we are short.
Investment income and other income primarily represents income earned, net of losses, related to our investment in the Deephaven Funds and, to a lesser extent, our strategic investments. Investment income and other income are primarily affected by the rates of return earned by the Deephaven Funds as well as the performance and activity of our strategic investments.
Expenses
Our operating expenses largely consist of employee compensation and benefits, payments for order flow and execution and clearance fees. Employee compensation and benefits expense fluctuates, for the most part, based on changes in net trading revenue, asset management fees, our profitability and our number of employees. Payments for order flow fluctuate based on U.S. equity share and option volume, our profitability, the mix of market orders and limit orders, the mix of orders received from broker-dealers and institutions who accept payments for order flow and changes in our payment for order flow policy. Execution and clearance fees primarily fluctuate based on changes in equity trade and share volume, option contract volume, clearance fees charged by clearing brokers and fees paid to access ECNs, exchanges and certain regulatory bodies.
Employee compensation and benefits expense primarily consists of salaries and wages paid to all employees and profitability based compensation, which includes compensation paid to market-making and sales personnel primarily based on their individual and overall performance and incentive compensation paid to other employees based on our overall profitability. Compensation for employees engaged in sales activities is determined primarily based on a percentage of their gross revenues net of expenses including payments for order flow, execution and clearance costs and overhead allocations ("net profitability"). Through October 2002, compensation for our Equity Markets market-making personnel was determined primarily based on a percentage of net profitability. Effective November 2002, the compensation model for our Equity Markets market-making personnel changed to a salary and discretionary bonus.The compensation model for our Derivative Markets market-making personnel was based on a salary and discretionary bonus from 2001 to 2003. The majority of compensation in Asset Management is determined based on a profitability-based formula.
Execution and clearance fees primarily represent clearance fees paid to clearing brokers for equities and options transactions, transaction fees paid to Nasdaq and other regional exchanges and regulatory bodies, option exchange fees, payments made to third parties for exchange seat leases and execution fees paid to third parties, primarily for executing trades in listed securities on the NYSE and AMEX, and for executing orders through ECNs.
Payments for order flow represent payments to certain clients, in the normal course of business, for directing their order flow in U.S. equities and U.S. option contracts to us and payments to institutions in connection with our commission recapture programs. Payments for order flow fluctuate as we modify our payment rates and as our percentage of clients whose policy is not to accept payments for order flow varies. Due to lower revenue capture and lower overall profitability, we reduced our payment for order flow rates several times over the past three years.
International charges consists of charges from continuing operations related to the reduction of European businesses as well as charges related to the writedown of certain international strategic investments to fair value.
The writedown of assets and lease loss accrual related to our domestic businesses consists of costs associated with impairment charges on intangible assets, excess real estate, fixed assets that are no longer actively used, and the writedown of certain domestic strategic investments and exchange seats to fair value.
RESULTS OF OPERATIONS
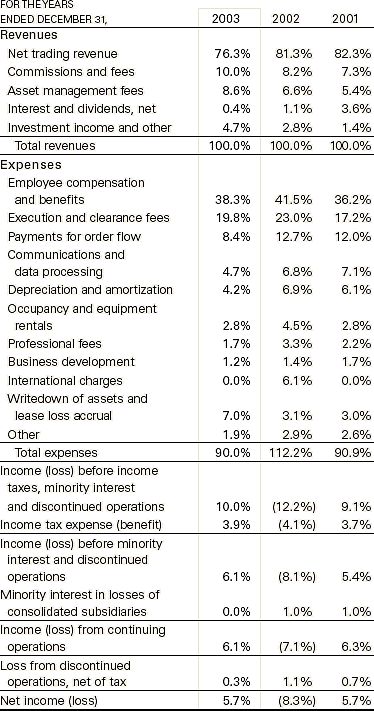
The following table sets forth the consolidated statement of operations data as a percentage of total revenues:
YEARS ENDED DECEMBER 31, 2003 AND 2002
Revenues
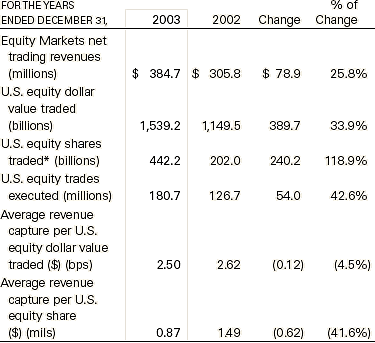
Net trading revenue from Equity Markets increased 25.8% to $384.7 million in 2003, from $305.8 million in 2002. Equity Markets' trading revenues are almost entirely comprised of revenues from U.S. equity trading and market making. This increase in equity trading revenue was primarily due to a 33.9% increase in total U.S. equity dollar value traded in 2003 as compared to 2002, offset, in part, by a 4.5% decrease in average revenue capture per U.S. equity dollar value traded. The total U.S. equity dollar value traded amount represents the aggregate dollar amount of principal and riskless principal transactions executed during the period.
 |
| * |
Includes 305.3 billion and 107.4 billion of OTC Bulletin Board and Pink Sheet shares for 2003 and 2002, respectively |
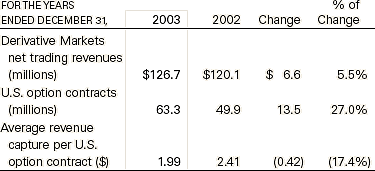
Net trading revenue from Derivative Markets increased 5.5% to $126.7 million in 2003, from $120.1 million in 2002.The increase was primarily due to a 27.0% increase in the number of option contracts traded in 2003 as compared to 2002, offset, in part, by a 17.4% decrease in average revenue capture per contract.
Commissions and fees increased 55.9% to $67.1 million in 2003, from $43.0 million in 2002.This increase is primarily due to higher commission-based volumes. Additionally, commissions increased by $5.0 million due to the one month of activity following the December 1, 2003 closing of the purchase of Donaldson and Co., Incorporated's ("Donaldson") soft dollar and commission recapture business.
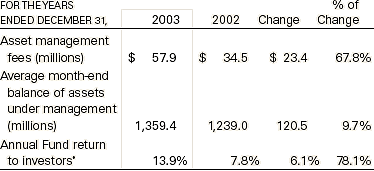
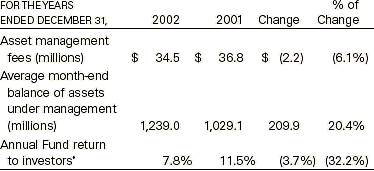
Asset management fees increased 67.8% to $57.9 million in 2003 from $34.5 million in 2002. The increase in fees was primarily due to an increase in average fund returns to the investor from 7.8% in 2002 to 13.9% in 2003. Additionally, asset management fees increased due to the increase in the average amount of funds under management throughout the year in the Deephaven Funds. The average month-end balance of funds under management increased to approximately $1.36 billion during 2003, from an average of approximately $1.24 billion in 2002.
 |
| * |
Return represents average return across all assets under management in the Deephaven Funds |
Interest and dividends, net of interest expense, decreased 55.7% to $2.6 million in 2003, from $5.9 million in 2002. This decrease was primarily due to lower cash balances held at banks and at our clearing brokers, changes in the composition of our market-making positions as well as lower interest rates.
Investment income and other income increased 116.5% to $31.1 million in 2003, from $14.4 million in 2002.This increase was primarily due to earnings related to our investment in the Deephaven Funds, which increased to $23.9 million in 2003 from $10.1 million in 2002.The increased earnings were directly related to the increase in our investment in the Deephaven Funds and greater fund returns.The Company's average monthend balance invested in the Deephaven Funds increased to $186.7 million during 2003, up from $128.9 million during 2002.
Expenses
Employee compensation and benefits expense increased 18.1% to $256.7 million in 2003, from $217.3 million in 2002. As a percentage of total revenue, employee compensation and benefits decreased to 38.3% in 2003 from 41.5% in 2002. These changes were primarily due to higher incentive compensation as a result of an increase in gross trading profits and margins, as well as the hiring and retention of senior management, sales and trading professionals offset, in part, by reduced headcount. Our number of full time employees decreased to 933 at December 31, 2003, from 1,027 full time employees at December 31, 2002. In connection with these headcount reductions, we incurred severance costs of $7.0 million in 2003, down from $10.2 million in 2002. Execution and clearance fees increased 10.1% to $132.7 million in 2003, from $120.5 million in 2002. As a percentage of total revenue, execution and clearance fees decreased to 19.8% in 2003, from 23.0% in 2002.The increase on a dollar basis was due to the increase in equity trades and options contracts executed as well as increased costs related to executing orders through ECNs offset, in part, by a reduction in clearance and execution rates and the closure of European equities market making in 2002.The decrease as a percentage of total revenue was primarily due to lower clearance rates and the overall increase in asset management fees and investment income, which have no associated execution and clearance fees.
Payments for order flow decreased 15.0% to $56.6 million in 2003, from $66.6 million in 2002. As a percentage of total revenue, payments for order flow decreased to 8.4% in 2003, from 12.7% in 2002.The decrease on both a dollar basis and as a percentage of total revenue was primarily due to changes in our payment for order flow policy over the prior two years, partially offset by increased volumes.
Communications and data processing expense decreased 11.0% to $31.5 million in 2003, from $35.4 million in 2002.This decrease was generally attributable to a decrease in headcount and related technology costs as well as the reduction in our European operations.
Depreciation and amortization expense decreased 21.5% to $28.3 million in 2003, from $36.1 million in 2002.This decrease was primarily due to the write-off of fixed assets over the past two years as well as assets fully depreciating in the normal course of business, offset, in part, by the purchases of additional fixed assets during 2003.
Occupancy and equipment rentals expense decreased 22.1% to $18.3 million in 2003, from $23.6 million in 2002.This decrease was primarily attributable to the lease loss accruals recorded in 2002 and 2003 related to our excess real estate capacity, primarily in Jersey City, NJ.We currently have 266,000 square feet of unoccupied office space in Jersey City.
Professional fees decreased 32.5% to $11.6 million in 2003, from $17.1 million in 2002.The decrease in 2003 was primarily due to the payment in 2002 of a one-time asset management consulting fee related to the retirement of Deephaven's CEO as of the end of 2001.
Business development expense increased 1.9%, while Other expenses decreased 16.1%. The primary reasons for the changes were higher advertising, travel and entertainment costs, consistent with our business growth in the past year, coupled with a decrease in other administrative costs.
There were no International charges from continuing operations during 2003. International charges from continuing operations were $32.1 million in 2002, primarily related to the closure of our European market-making operations. The international charges from continuing operations incurred in 2002 included $13.1 million related to the writedown of our investment in Nasdaq Europe, $7.4 million related to the writedown of fixed assets that are no longer actively used, $6.4 million related to contract settlements and terminations, $4.2 million related to the costs associated with excess real estate capacity and $900,000 of other charges.
During 2003, charges of $46.9 million were incurred related to our domestic businesses, compared to charges of $16.2 million in 2002.The charges in 2003 consist of $29.6 million related to the impairment of intangible assets (representing our options trading posts) in our Derivative Markets business segment, $10.3 million of lease loss accruals related to the costs associated with our excess real estate capacity, primarily in Jersey City, NJ, $6.8 million related to the writedown of our strategic investment in Nasdaq to fair value and $260,000 related to the writedown of fixed assets that are no longer actively used. The charges incurred in 2002 consist of $8.9 million of a lease loss accrual related to the costs associated with our excess real estate capacity, $3.6 million related to the writedown of fixed assets that are no longer actively used, $3.0 million related to the writedown of impaired strategic investments to fair value and $700,000 related to a writedown of option exchange seats to fair value.
Our effective income tax rates, from continuing operations, of 39.2% and 33.7% for 2003 and 2002, respectively, differ from the federal statutory income tax rate of 35% due primarily to state income taxes and, for 2002, non-deductible foreign losses.
YEARS ENDED DECEMBER 31, 2002 AND 2001
Revenues
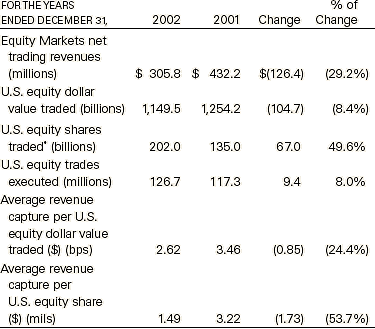
Net trading revenue from Equity Markets decreased 29.2% to $305.8 million in 2002, from $432.2 million in 2001. Equity trading revenues are almost entirely comprised of revenues from U.S. equity trading and market making. This decrease in equity trading revenue was primarily due to an 8.4% decrease in U.S. equity dollar value traded in 2002 as compared to 2001, and a 24.4% decrease in average revenue capture per U.S. equity dollar value traded. Average revenue capture per U.S. equity dollar value traded was adversely impacted by a reduction in spreads due to decimalization and the resulting one-penny minimum price spread.
 |
| * |
Includes 107.4 billion and 64.4 billion of OTC Bulletin Board and Pink Sheet shares for 2002 and 2001, respectively. |
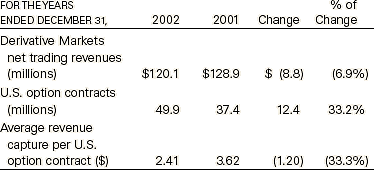
Net trading revenue from Derivative Markets decreased 6.9% to $120.1 million in 2002, from $128.9 million in 2001. The decrease was primarily due to a 33.3% decrease in average revenue capture per contract, offset in part, by a 33.2% increase in U.S. option contract volume. Our U.S. option contract volume was positively impacted by Knight Financial Products LLC's ("KFP") purchases of additional exchange posts during 2001 and 2002, which increased our overall options market-making coverage but was offset, in part, by the delisting of a number of option classes with limited volumes.
Commissions and fees decreased 13.1% to $43.0 million in 2002, from $49.5 million in 2001.This decrease is primarily due to lower commission-based volumes and lower commission rates in our options order routing activities. Additionally, there was a decrease in the fees we receive for providing certain information to market data providers.
Asset management fees decreased 6.1% to $34.5 million in 2002 from $36.8 million in 2001. The decrease in fees was primarily due to a decrease in average fund returns to the investor from 11.5% in 2001 to 7.8% in 2002.The decrease was offset, in part, by the increase in the average amount of funds under management throughout the year in the Deephaven Funds. The average month-end balance of funds under management increased to approximately $1.24 billion during 2002, from an average of approximately $1.03 billion in 2001.
 |
| * |
Return represents average return across all assets under management in the Deephaven Funds |
Interest and dividends income, net of interest expense, decreased 76.4% to $5.9 million in 2002, from $24.9 million in 2001.This decrease was primarily due to lower cash balances held at banks and at our clearing brokers, changes in the composition of our market-making positions as well as lower interest rates.
Investment income and other income increased 48.0% to $14.4 million in 2002, from $9.7 million in 2001. This increase was primarily due to earnings related to our investment in the Deephaven Funds, which increased to $10.1 million in 2002, from $5.0 million in 2001. The increased earnings were primarily related to the increase in our investment in the Deephaven Funds.The Company's average month-end balance invested in the Deephaven Funds increased to $128.9 million during 2002, up from $41.1 million during 2001.
Expenses
Employee compensation and benefits expense decreased 11.9% to $217.3 million in 2002, from $246.7 million in 2001.The decrease was primarily due to lower headcount and lower incentive compensation as a result of a decrease in gross trading profits and margins, offset in part by increased severance costs. Due to a decrease in revenues and our profitability, employee headcount was reduced during 2001 and 2002. Our number of full-time employees decreased to 1,027 at December 31, 2002, from 1,307 full-time employees at December 31, 2001. In connection with these headcount reductions, we incurred severance costs of $10.2 million in 2002, up from $5.9 million for 2001.
Execution and clearance fees increased 2.5% to $120.5 million in 2002, from $117.5 million in 2001. Execution and clearance fees increased due to the increase in U.S. options contracts and U.S. equity trades executed as well as increased costs related to executing orders through ECNs. The increase in execution and clearance fees was partially offset as a result of the reduction in clearing rates in our U.S. equities marketmaking businesses in 2001 and the closure of European equities market making in 2002.
Payments for order flow decreased 18.8% to $66.6 million in 2002, from $81.9 million in 2001. The decrease was primarily due to changes in our payment for order flow policy initiated in 2001 and 2002, partially offset by increased volumes for U.S. equity shares traded and U.S. options contracts executed.
Communications and data processing expense decreased 26.5% to $35.4 million in 2002, from $48.2 million in 2001. This decrease was generally attributable to a decrease in headcount and related technology costs as well as the reduction in our European operations.
Depreciation and amortization expense decreased 12.9% to $36.1 million in 2002, from $41.4 million in 2001.This decrease was primarily due to the adoption of SFAS No. 142 and the write-off of $11.0 million of fixed assets. The adoption of this statement decreased amortization expense by approximately $6.8 million in 2002, compared to 2001. Additionally, depreciation expense was impacted by both our purchases and writedowns of fixed assets throughout 2002. See Footnote 5 to the Consolidated Financial Statements for further information on our adoption of SFAS No. 142.
Occupancy and equipment rentals expense increased 23.2% to $23.6 million in 2002, from $19.1 million in 2001. This increase was primarily attributable to additional leased office space in Jersey City, NJ.We currently have 266,000 square feet of unoccupied office space in Jersey City.
Professional fees increased 15.0% to $17.1 million in 2002, from $14.9 million in 2001.The increase in 2002 was primarily due to the payment in 2002 of a one-time asset management consulting fee related to the retirement of Deephaven's CEO as of the end of 2001, offset in part by a decrease in technology consulting expenses, and professional fees related to our European business.
Business development and Other expenses decreased 34.5% and 13.3%, respectively.The primary reasons for the decreases were lower travel and entertainment and administrative costs.
International charges from continuing operations were $32.1 million in 2002, primarily related to the closure of our European market-making operations.The international charges from continuing operations incurred in 2002 included $13.1 million related to the writedown of our investment in Nasdaq Europe, $7.4 million related to the writedown of fixed assets that are no longer actively used, $6.4 million related to contract settlements and terminations, $4.2 million related to the costs associated with excess real estate capacity and $900,000 of other charges.
During 2002, charges of $16.2 million were incurred related to our domestic businesses.The charges consist of $8.9 million of a lease loss accrual related to the costs associated with our excess real estate capacity, $3.6 million related to the writedown of fixed assets that are no longer actively used, $3.0 million related to the writedown of impaired strategic investments and $700,000 related to a writedown of exchange seats.
Our effective income tax rates, from continuing operations, of 33.7% and 40.9% for 2002 and 2001, respectively, differ from the federal statutory income tax rate of 35% due primarily to state income taxes, non-deductible foreign losses and the amortization of goodwill in 2001.
RECONCILIATION OF TOTAL GAAP EXPENSES AND PRE-TAX GAAP INCOME TO OPERATING EXPENSES AND PRE-TAX OPERATING EARNINGS, RESPECTIVELY
In an effort to provide additional information regarding the Company's results as determined by generally accepted accounting principles ("GAAP"), the Company also discloses certain non-GAAP information which management believes provides useful information to investors. Within this Annual Report, the Company has disclosed its Operating Expenses and Pre-Tax Operating Earnings to assist the reader in understanding the impact of the international charges and writedown of assets and lease loss accrual on the Company's segmented financial results, thereby facilitating more useful period-to-period comparisons of the Company's businesses. For additional information related to segments, please see Note 19 to the Consolidated Financial Statements included elsewhere in this document.
Total GAAP Expenses to Operating Expenses
|
|
 |
| * |
Total expenses for 2003, 2002 and 2001 excludes intercompany management fees of $9.3 million, $8.8 million and $5.4 million, respectively. |
Pre-Tax GAAP Income to Pre-Tax Operating Earnings
|
|
LIQUIDITY
Historically, we have financed our business primarily through cash generated by operations, as well as the proceeds from our stock issuances. As of December 31, 2003, we had $4.0 billion in assets, 90% of which consisted of cash or assets readily convertible into cash, principally receivables from brokers and dealers and securities owned. Receivables from brokers and dealers include interest bearing cash balances held with clearing brokers, including, or net of, amounts related to securities transactions that have not yet reached their contracted settlement date, which is generally within three business days of the trade date. Securities owned principally consist of equity securities that trade in Nasdaq, on the OTC Bulletin Board and on the NYSE and AMEX markets and listed options contracts that trade on national exchanges. At December 31, 2003, the Company had net current assets, which consists of net assets readily convertible into cash, of approximately $389.4 million.
Additionally, our investment in the Deephaven Funds was $201.1 million at December 31, 2003. This investment can be liquidated upon request subject to a ninety-day written notification period and monthly redemption limits, or immediately by invoking our rights as the general partner of the Deephaven Funds.
Income/(loss) before income taxes, minority interest and discontinued operations was $66.9 million, ($63.9 million) and $62.2 million for 2003, 2002 and 2001, respectively. Included in these balances were certain non-cash expenses such as depreciation and amortization and certain non-cash writedowns. Depreciation expense was $25.6 million, $33.6 million and $32.5 million in 2003, 2002 and 2001, respectively. Amortization expense, which related to intangible assets and, prior to 2002, goodwill, was $2.7 million, $2.5 million and $8.9 million during 2003, 2002 and 2001, respectively. Non-cash writedowns consisted of $36.6 million, $29.0 million and $12.3 million during 2003, 2002 and 2001, respectively, primarily related to intangible asset impairment charges, costs associated with excess real estate capacity, fixed assets no longer actively being used and impaired strategic investments.
Purchases, net of proceeds, from strategic investments and acquisitions were $14.0 million, $1.7 million and $15.7 million during 2003, 2002 and 2001, respectively. Strategic investments and acquisition expenditures primarily relate to outside investments and acquisitions of businesses and option specialist posts in support of the development and growth of our business.We increased our investment in the Deephaven Funds by $47.3 million, $102.9 million and $38.3 million during 2003, 2002 and 2001, respectively. Additionally, on January 1, 2004, we invested an additional $25.0 million in the Deephaven Funds and an additional $16.5 million related to employee deferred compensation plans.
Capital expenditures were $11.1 million, $16.3 million and $50.2 million during 2003, 2002 and 2001, respectively. Capital expenditures primarily relate to the purchase of data processing and communications equipment, capitalized software and leasehold improvements. In acquiring fixed assets, particularly technology equipment, we make a decision about whether to lease such equipment or purchase it outright based on a number of factors including its estimated useful life, obsolescence and cost. We anticipate moving our Jersey City, NJ offices into our leased office space at 545 Washington Blvd. in the next 12 to 18 months. Currently, we estimate that we will spend approximately $40 million related to this move, the majority of which will be for leasehold improvements that will be amortized over the remaining life of the lease.
At its May 12, 2003 meeting, the Board of Directors authorized an additional increase in the size of the Company's stock repurchase program from $70 million to $95 million. The Company repurchased 6,355,300 shares during 2003 for a total cost of $33.5 million. Included in the 2003 activity were open market purchases, as well as a privately negotiated block transaction for 4,775,000 shares that was effected with a dealer on behalf of Ameritrade Holding Corporation. Through December 31, 2003, under the Company's previously announced $95 million stock repurchase program, the Company had repurchased 14,315,200 shares for $74.6 million. The Company may repurchase shares in the open market or through privately negotiated transactions, depending on prevailing market conditions, alternative use of capital and other factors. The Company cautions that there are no assurances that any further repurchases may actually occur. Knight Trading Group had approximately 115.1 million shares of common stock outstanding as of December 31, 2003.
As registered broker-dealers, Knight Equity Markets, L.P. ("KEM"), Knight Capital Markets LLC ("KCM"), Knight Financial Products LLC ("KFP") and Knight Execution Partners LLC ("KEP") are subject to regulatory requirements intended to ensure the general financial soundness and liquidity of broker-dealers and requiring the maintenance of minimum levels of net capital, as defined in SEC Rule 15c3-1.These regulations also prohibit a broker-dealer from repaying subordinated borrowings, paying cash dividends, making loans to its parent, affiliates or employees, or otherwise entering into transactions which would result in a reduction of its total net capital to less than 120.0% of its required minimum capital. Moreover, broker-dealers, including KEM, KCM, KFP and KEP, are required to notify the SEC prior to repaying subordinated borrowings, paying dividends and making loans to its parent, affiliates or employees, or otherwise entering into transactions, which, if executed, would result in a reduction of 30.0% or more of its excess net capital (net capital less minimum requirement).The SEC has the ability to prohibit or restrict such transactions if the result is detrimental to the financial integrity of the broker-dealer. At December 31, 2003, KEM had net capital of $177.8 million, which was $170.1 million in excess of its minimum net capital requirement of $7.7 million, KCM had net capital of $37.6 million which was $35.8 million in excess of its minimum net capital requirement of $1.8 million, KFP had net capital of $24.6 million which was $24.3 million in excess of its minimum net capital requirement of $250,000 and KEP had net capital of $4.5 million which was $4.0 million in excess of its minimum net capital requirement of $450,000. Additionally, Knight Securities International Ltd. ("KSIL") is subject to capital adequacy requirements of the Financial Services Authority in the United Kingdom. KSIL had net capital of $6.5 million, which was $1.8 million in excess of its minimum net capital requirement of $4.6 million.
We have no long-term debt at December 31, 2003 nor do we currently have any debt commitments for 2004. We do not anticipate that we will need to incur long-term debt to meet our 2004 capital expenditure and operating needs. We currently anticipate that available cash resources and credit facilities will be sufficient to meet our anticipated working capital and capital expenditure requirements for at least the next 12 months.
Contractual Obligations
In connection with its operating activities, the Company enters into certain contractual obligations. The Company's future cash payments associated with its contractual obligations pursuant to its operating leases and guaranteed employment contracts longer than one year as of December 31, 2003 are summarized below:
|
|

(1) See Note 12 to the Consolidated Financial Statements
|
|
Off-Balance Sheet Arrangements
As of December 31, 2003, we did not have any off-balance sheet arrangements, as defined in Item 303 (a) (4) (ii) of SEC Regulation S-K.
Effects of Inflation
Because the majority of the Company's assets are liquid in nature, they are not significantly affected by inflation. However, the rate of inflation may affect the Company's expenses, such as employee compensation, office leasing costs and communications expenses, which may not be readily recoverable in the prices of the services offered by the Company. To the extent inflation results in rising interest rates and has other adverse effects on the securities markets, it may adversely affect the Company's financial position and results of operations.
Discontinued Operations
Due to changes in market structure, the withdrawal of Nasdaq Japan, poor market conditions and limited market-making opportunities in Japan, KSJ's original business plan was significantly impaired and its operations ceased on May 2, 2003. After the cessation of trading, the Company and its partner, Nikko Cordial Group, liquidated KSJ. The losses, net of tax, included in Loss from discontinued operations on the Consolidated Statements of Operations were approximately $2.1 million, $5.9 million and $4.7 million for the years ended 2003, 2002 and 2001, respectively.
Critical Accounting Policies
The preparation of financial statements in conformity with generally accepted accounting principles requires management to make estimates and assumptions.We believe that, of our significant accounting policies, the following policies involve a higher degree of judgment.
Lease Loss Accrual It is the Company's policy to identify excess real estate capacity and where applicable, accrue against such future costs. In determining the accrual, a nominal cash flow analysis is performed for lease losses initiated prior to December 31, 2002, the effective date of SFAS No. 146 Accounting for Costs Associated with Exit or Disposal Activities (which requires the accrual of future costs to be made using a discounted cash flow analysis for lease losses initiated after such date), and costs related to the excess capacity are accrued. The effect of applying these new provisions to our current lease losses accounted for under a nominal cash flow analysis would not be material. During 2003, we incurred $10.3 million of lease loss expense that is included on the Consolidated Statements of Operations in the Writedown of assets and lease loss accrual line item. The majority of this amount is related to our lease at 545 Washington Boulevard in Jersey City, New Jersey, of approximately 266,000 square feet, all of which is currently unoccupied. The Company engaged a real estate broker in order to sub-lease approximately 78,000 square feet based on an assessment of our real estate needs. In accordance with SFAS No. 13 Accounting for Leases, the Company recorded a lease loss accrual of $9.6 million in 2003 related to this sub-lease. The accrual at December 31, 2003 was derived from assumptions and estimates based on lease terms of the anticipated sub-lease agreement, which assumed a sub-lease would have commenced in the middle of 2005, anticipated market prices along the Jersey City waterfront and estimated up-front costs, including broker fees and build out allowances.We continually monitor the market and space to assess the reasonableness of our applicable assumptions.
Impairment of Goodwill and Intangible Assets The useful lives of goodwill and intangible assets are determined upon acquisition. Intangible assets are amortized over their respective lives. Goodwill and the useful lives of intangible assets are tested for impairment, at a minimum, on an annual basis.
- Our goodwill of $21.1 million is related to the purchase of our listed equities market maker, KCM, our order routing business of KEP and the business of Donaldson. During our annual tests for impairment done in 2003, it was determined that these assets were not impaired. As part of our test for impairment, we considered the profitability of the applicable reporting unit, an assessment of fair value of the reporting unit based on various valuation methodologies, as well as the overall market value of the Company, compared to the Company's book value.We determined that no impairment charge was necessary.
- Our intangible assets balance of $14.7 million is attributable to both our Equity Markets business segment and our Derivative Markets business segment. Included in our Equity Markets business segment is $12.0 million related to our acquisition of the business of Donaldson.These assets are being amortized over their useful lives, which have been determined to range from five to thirty years. Included in our Derivative Markets business segment is $2.7 million related to our trading rights and trading posts on various options exchanges. During our annual tests for impairment done in 2003, it was determined that the intangible assets were permanently impaired. Consequently, the intangible assets relating to our trading rights and trading posts on various options exchanges were written down to fair value, resulting in a $29.5 million impairment charge. The carrying value of the residual intangible assets continues to be amortized over their remaining useful lives, the majority of which are within one year, with the remainder of up to fourteen years.
Strategic Investments Strategic Investments include ownership interests of less than 20% in financial services-related businesses, which are accounted for under the equity method or at fair value. The equity method of accounting is used for investments in limited partnerships and limited liability corporations. The fair value of other investments, for which a quoted market or dealer price is not available for the size of our investment, is based on management's estimate. Among the factors considered by management in determining the fair value of investments are the cost of the investment, terms and liquidity, developments since the acquisition of the investment, the sales price of recently issued securities, the financial condition and operating results of the issuer, earnings trends and consistency of operating cash flows, the long-term business potential of the issuer, the quoted market price of securities with similar quality and yield that are publicly traded, and other factors generally pertinent to the valuation of investments.The fair value of these investments is subject to a high degree of volatility and may be susceptible to significant fluctuations in the near term. The valuations of strategic investments, which include our investment in Nasdaq and the ISE, are reviewed on an ongoing basis. In accordance with this policy, in the first quarter of 2003, the Company wrote down its investment in Nasdaq by $6.8 million.
Market-Making Activities Securities owned and securities sold, not yet purchased, which primarily consist of listed and OTC stocks and listed options contracts, are carried at market value and are recorded on a trade date basis. Market value is estimated daily using market quotations available from major securities exchanges and dealers.
Asset Management Fees The Company earns asset management fees for sponsoring and managing the Deephaven Funds. Such fees are recorded monthly as earned and are calculated as a percentage of the Deephaven Funds' monthly net assets, plus a percentage of a new high net asset value (the "Incentive Allocation Fee"), as defined, for any six month period ended June 30th or December 31st. A new high net asset value is defined as the amount by which the net asset value of the Deephaven Funds exceeds the greater of either the highest previous net asset value in the Deephaven Funds, or the net asset value at the time each investor made his purchase. If the Deephaven Funds recognize a loss in the second half of a calendar year, the Incentive Allocation Fee is recalculated on an annual rather than a semi-annual basis.
Writedown of Fixed Assets Writedowns of fixed assets are recognized when it is determined that the fixed assets are no longer actively used and are determined to be impaired. The amount of the impairment is determined by the difference between the carrying amount and the fair value of the fixed asset. In determining the impairment, an estimated fair value is obtained through research and inquiry of the market. Fixed assets are reviewed for impairment on a quarterly basis.
RECENTLY ISSUED ACCOUNTING STANDARDS
In July 2001, the FASB issued SFAS No. 142, Goodwill and Other Intangible Assets. This statement establishes new standards for accounting for goodwill and intangible assets acquired outside of, and subsequent to a business combination. Under the new standards, goodwill and certain intangible assets with an indefinite useful life will no longer be amortized and are tested for impairment at least annually. Other intangible assets continue to be amortized over their useful lives.The useful lives and any impairment of other intangible assets will also be tested at least annually. We adopted the provisions of SFAS No. 142 effective January 1, 2002. See Note 5 to the Consolidated Financial Statements included in this document to see the impact that the adoption of this statement had on our operations.
In June 2001, the FASB issued SFAS No. 143, Accounting for Asset Retirement Obligations. This statement establishes standards for financial accounting and reporting for obligations associated with the retirement of tangible long-lived assets and the associated asset retirement costs.We adopted the provisions of SFAS No. 143 effective January 1, 2002.The adoption of this statement did not have a material impact on our financial statements.
In August 2001, the FASB issued SFAS No. 144 Accounting for the Impairment or Disposal of Long-Lived Assets. This statement supersedes SFAS No. 121 Accounting for the Impairment of Long-Lived Assets and for Long-Lived Assets to be Disposed Of. SFAS No. 144 establishes a single model for accounting for the impairment or disposal of long-lived assets. We adopted the provisions of SFAS No. 144 effective January 1, 2002. The adoption of this statement did not have a material impact on our financial statements.
In June 2002, the FASB issued SFAS No. 146 Accounting for Costs Associated with Exit or Disposal Activities.This Statement addresses financial accounting and reporting for costs associated with exit or disposal activities and supersedes Emerging Issues Task Force (EITF) Issue No. 94-3, Liability Recognition for Certain Employee Termination Benefits and Other Costs to Exit an Activity (including Certain Costs Incurred in a Restructuring). We adopted the provisions of SFAS No. 146 effective January 1, 2003. The adoption of this statement did not have a material impact on our financial statements.
In November 2002, the FASB issued FASB Interpretation No. 45 ("FIN 45") Guarantor's Accounting and Disclosure Requirements for Guarantees, Including Indirect Guarantees of Indebtedness of Others. FIN 45 requires that a liability be recorded in the guarantor's balance sheet upon issuance of a guarantee. In addition, FIN 45 requires disclosures about the guarantees that an entity has issued, including a rollforward of the entity's product warranty liabilities.We adopted the disclosure provisions of FIN 45 effective December 31, 2002.
In December 2002, the FASB issued SFAS No. 148 Accounting for Stock-Based Compensation — Transition and Disclosure — an amendment of FASB Statement No. 123. This Statement amends FASB Statement No. 123, Accounting for Stock-Based Compensation, to provide alternative methods of transition for a voluntary change to the fair value-based method of accounting for stock-based employee compensation. In addition, this Statement amends the disclosure requirements of SFAS No. 123 to require prominent disclosures in both annual and interim financial statements about the method of accounting for stockbased employee compensation and the effect of the method used on reported results.We adopted the disclosure provisions of SFAS No. 148 effective December 31, 2002, and continue to follow APB 25. The adoption of this statement did not have a material impact on our financial statements.
In November 2002, the EITF reached a consensus on EITF Issue No. 02-03, Issues Involved in Accounting for Derivative Contracts Held for Trading Purposes and Contracts Involved in Energy Trading and Risk Management Activities. EITF Issue No. 02-03 precludes mark-to-market accounting for energy-trading contracts that are not derivatives pursuant to SFAS No. 133, Accounting for Derivative Instruments and Hedging Activities. We adopted the provisions of this statement effective November 1, 2002. The adoption of this statement had no effect on our financial statements.
In January 2003, the FASB issued FIN No. 46, Consolidation of Variable Interest Entities. FIN No. 46 requires a company to consolidate a variable interest entity ("VIE") if the company has variable interests that give it a majority of the expected losses or a majority of the expected residual returns of the entity. Prior to FIN No. 46, VIEs were commonly referred to as SPEs. In October 2003, the FASB deferred the effective date of FIN No. 46 for pre-existing VIEs to no later than February 2004. In December 2003, the FASB issued a revision to FIN No. 46 (FIN No. 46-R), which incorporated the October 2003 deferral provisions and clarified and revised the accounting guidance for VIEs. As the Company does not have any VIEs, the adoption of this statement will not have an effect on our financial statements.
In April 2003, the FASB issued SFAS No. 149, Amendment of Statement 133 on Derivative Instruments and Hedging Activities. This Statement amends and clarifies financial accounting and reporting for derivative instruments, including certain derivative instruments embedded in other contracts, and for hedging activities. This Statement was effective for derivative contracts entered into after June 30, 2003. The adoption of this Statement did not have a material impact on our financial statements.
In May 2003, the FASB issued SFAS No. 150 Accounting for Certain Financial Instruments with Characteristics of both Liabilities and Equity.This Statement establishes standards for how an issuer classifies and measures certain financial instruments with characteristics of both liabilities and equity, and imposes certain additional disclosure requirements. The provisions of SFAS No. 150 were effective immediately for financial instruments entered into or modified after May 31, 2003 and applied to all financial instruments at the beginning of the third quarter of 2003. The adoption of this Statement did not have an effect on our financial statements.
QUANTITATIVE AND QUALITATIVE DISCLOSURES ABOUT MARKET RISK
Our market-making and trading activities expose our capital to significant risks.These risks include, but are not limited to, absolute and relative price movements, price volatility and changes in liquidity, over which we have virtually no control.
For working capital purposes, we invest in money market funds, commercial paper, government securities or maintain interest-bearing balances in our trading accounts with clearing brokers, which are classified as cash and cash equivalents and receivable from brokers and dealers, respectively, in the Consolidated Statements of Financial Condition. These other amounts do not have maturity dates or present a material market risk, as the balances are short-term in nature and subject to daily repricing. Our cash and cash equivalents held in foreign currencies are subject to the exposure of foreign currency fluctuations.These balances are monitored daily, and are not material to the Company's overall cash position.
EQUITY MARKETS
We employ automated proprietary trading and position management systems that provide real-time, on-line position management and inventory control. We monitor our risks by reviewing trading positions and their appropriate risk measures. We have established a system whereby transactions are monitored by senior management on a real-time basis as are individual and aggregate dollar and inventory position totals and real-time profits and losses. The management of trading positions is enhanced by review of mark-to-market valuations and position summaries on a daily basis.
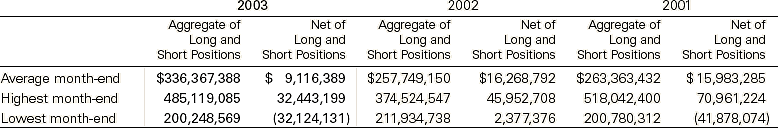
In the normal course of our equities market-making business, we maintain inventories of exchange-listed and OTC equity securities. The fair value of these securities at December 31, 2003 and 2002 was $190.1 million and $130.5 million, respectively, in long positions and $173.1 million and $84.7 million, respectively, in short positions. The potential change in fair value, using a hypothetical 10.0% decline in prices, is estimated to be a $1.7 million loss and a $4.6 million loss as of December 31, 2003 and 2002, respectively, due to the offset of losses in long positions with gains in short positions.The following table illustrates, for the period indicated, our average, highest and lowest month-end inventory at market value (based on both the aggregate and the net of the long and short positions of trading securities from our OTC and listed market making business).
|
|
|
|
DERIVATIVE MARKETS
We maintain inventories of options, futures and equities. Our main exposure is from equity price and volatility risk. We manage these exposures by constantly monitoring and diversifying our exposures and position sizes and establishing offsetting hedges. Our market making staff and trading room managers continuously manage our positions and our risk exposures. Our systems incorporate trades and update our risk profile using options pricing models on a real-time basis.
Our proprietary options risk management system allows us to stress test our portfolio on a real-time basis. On a daily basis, risk reports are distributed to senior management and the firm's risk managers who incorporate this information in our market-making decisions.These reports identify potential exposures with respect to options and futures on individual securities and index contracts, organized in different ways such as industry sectors, under extreme price and volatility movements. At December 31, 2003, 10% movements in volatility and stock prices on our entire equity options and equity index options portfolios, which contain the majority of our market risk, would have resulted in approximately the following gains (losses) in our options market making portfolio:
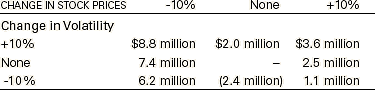
This stress analysis covers positions in options and futures, underlying securities and related hedges. The 10% changes in stock prices and volatility in the charts above make the assumption of a universal 10% movement in all of our underlying positions.The analysis also includes a number of estimates that we believe to be reasonable, however, we cannot assure that they will produce an accurate measure of future risk.
ASSET MANAGEMENT
As of December 31, 2003, we had $201.1 million invested in the Deephaven Funds, which are managed by Deephaven. The general objective of "market neutral" strategies is to capture mispricings or spreads between related capital instruments. Within the Market Neutral Fund, Deephaven employs a variety of market neutral investment strategies, including convertible arbitrage, event/risk arbitrage, relative value equity, distressed debt and private placements in public companies. Because the basis of the Deephaven Funds' strategy is capturing mispricings or spreads between related instruments, rather than attempting to predict or follow absolute price movements, the performance of the Deephaven Funds is expected to be substantially non-correlated with the general debt and equity markets, as well as with a number of other non-traditional investment strategies. However, there will be unhedged credit risk in the convertible arbitrage portfolio and that part of the portfolio will have some correlation to credit spreads. "Market neutral" trading involves substantial risks. Disruptions in historical pricing relationships can result in significant losses. The Deephaven Funds also utilize leverage, to the extent available and deemed by Deephaven to be consistent with the Funds' risk/reward objectives, in an attempt to increase returns while maintaining strict risk controls.
Similar to our Equity and Derivative Markets segments, the Deephaven Funds employ automated proprietary trading and position management systems that provide position management and inventory control.We monitor our risks by reviewing trading positions and their appropriate risk measures.We have established a system whereby transactions are monitored by senior management and a risk control function, as are individual and aggregate dollar and inventory position totals and profits and losses by strategy.There can be no assurances that the Deephaven Funds' strategy will be successful in achieving either its risk control or its profit objectives.
|
|
|
|